 Open Access Article
Creative Commons Attribution 3.0 Unported Licence
Facile fabrication of paper-based analytical devices for rapid and highly selective colorimetric detection of cesium in environmental samples†
Sung-Min Kang‡
a,
Sung-Chan Jang‡ac,
Yuvaraj Haldoraib,
A. T. Ezhil Vilianb,
Muruganantham Rethinasabapathya,
Changhyun Roh*cd,
Young-Kyu Han *b and
Yun Suk Huh
 *ae
*ae
aDepartment of Biological Engineering, Biohybrid Systems Research Center (BSRC), Inha University, 100 Inha-ro, Incheon, 22212, Republic of Korea. E-mail: yunsuk.huh@inha.ac.kr; Fax: +82 32 872 4046; Tel: +82 32 860 9177
bDepartment of Energy and Materials Engineering, Dongguk University-Seoul, Seoul, 04620, Republic of Korea. E-mail: ykenergy@dongguk.edu; Tel: +82 2 2260 4975
cBiotechnology Research Division, Advanced Radiation Technology Institute (ARTI), Korea Atomic Energy Research Institute (KAERI), 29 Geumgu-gil, Jeongeup, Jeonbuk 56212, Republic of Korea. E-mail: chroh@kaeri.re.kr; Tel: +82 63 570 3133
dRadiation Biotechnology and Applied Radioisotope Science, University of Science Technology (UST), 217 Gajeong-ro, Daejeon, 34113, Republic of Korea
eWCSL of Integrated Human Airway-on-a-Chip, Inha University, 100 Inha-ro, Incheon, 22212, Republic of Korea
First published on 16th October 2017
Abstract
Cesium (Cs), a radioactive contaminant of the ecosystem, causes a major risk to human health and environments. Till now, the cesium sensor fabrication methods have been reported with the usage of expensive chemicals that are complex and time-consuming. In this work, we have fabricated a paper-based colorimetric device impregnated with a chrysoidine G (CG) as chemo-indicator which is simple, rapid, low-cost, and portable using a naked-eye quantitative technique for the detection and monitoring of inactive cesium in environmental analysis. This chemo-indicator is designed to exhibit a powerful detection capability featuring high selectivity and sensitivity to inactive Cs, by means of color discrimination from light yellow to red orange. Interestingly, a portable smart phone camera, which determined the relative red/green/blue (RGB) values within 3 s, provided us with further information on environmental pollution. Using our new colorimetric reusable sensor (CRS) platform, the CRS shows excellent detection linearity (R2 = 0.99) of inactive Cs from the contaminated water. Our results will pave the way for portable and versatile sensors and, in turn, for the detection and monitoring of toxic inactive cesium in contaminated water samples.
1. Introduction
The nuclear accidents that befell the Chernobyl (Ukraine, 1986) and Fukushima (Japan, 2011) nuclear power plants are widely regarded as being among the world's worst environmental disasters. The release of radionuclides as a result of these nuclear accidents is an increasingly pressing global concern.1,2 In particular, most of the radionuclides (more than 80%) resulting from the Fukushima Daiichi nuclear accident were allowed to contaminate the offshore area, causing their spread to the world's sea and soil via the Pacific Ocean.3,4Among these radioactive contaminants, cesium is known to be a significant byproduct of nuclear waste. Due to its high mobility and solubility in water, cesium (Cs) is responsible for contaminating surface water and/or ground water which leads to aquatic bioaccumulation of radioactive cesium ions and is passed on to people through contaminated seafood and drinking water.5–7 More seriously, the simple substitution reaction of cesium ions with sodium and potassium ions in the red blood cells can induce adverse health problems in humans such as cardiovascular, gastrointestinal, fetal, and neurological disease.8,9 Radioactive cesium and its radioisotopes are strong gamma emitters with a half-life of 2.06 years (134Cs) or 30.17 years (137Cs), so their existence in the environment has long-term harmful effects.10,11 Currently, various analytical techniques, including laser-induced breakdown spectroscopy, cold-vapor inductively coupled plasma mass spectroscopy, atomic absorption spectroscopy, and electrochemical devices have been accomplished to detect cesium.12 These analytical techniques have disadvantages such as high-cost, time-consuming complex operational procedures, and complicated non-portable equipment which are not suitable for environmental monitoring.
The paper which mainly consists of cellulose fiber is highly abundant and has become a growing concern among researchers as a potential substance in the fabrication of sensors, chemical and analytical devices due to its low cost and flexibility in the fabrication of devices. Recently, a new paper-based analytical sensor is commonly used in environmental monitoring, food safety, and biomedical diagnostics application.13–16 As paper-based analytical devices exhibit a relatively novel analytical sensing platform, several effective approaches have been used to detect multiplex analytes, such as chemiluminescent and FRET-based fluorescence methods, electrochemical and colorimetric methods, and surface-enhanced Raman spectroscopy.17–20 Among these analytical methods, colorimetric methods have established great attention due to their excellent features such as simplicity, rapid execution, and low-cost.21–24 In particular, the paper-based colorimetric device overcomes these existing high-cost time-consuming complex operational procedures with ease of operation and detects cesium in the environmental samples very rapidly with high sensitivity and high selectivity.25,26 In addition, there are various works integrated on the use of smartphones as an on-site detection technique using the paper-based colorimetric device. Visual colorimetric sensors based on reusable substrates (e.g., cellulose, polyester, and non-woven fabric) are well-suited for the on-site detection and monitoring of environmental contaminants.27–30 The colorimetric data can be rapidly converted to a digital image by using smartphones. Their ability to sense harmful substances rapidly will have a significant impact on a variety of danger warning and emergency response systems.
Currently, portable devices for detecting radioactive cesium can be fabricated using semiconductor materials such as germanium (Ge), silicon (Si), diamond, and cadmium (zinc) telluride, which are capable of emitting gamma rays.31 However, even if these devices can provide a sensitive signal for the detection of cesium, there are still a number of technical problems to be addressed before the general public will be able to diagnose cesium easily using mobile sensors in the field. Specifically, in the case of the current portable cesium-measuring apparatus, there are limitations in terms of high production costs per unit, the size of the unit, the level of energy required, and the complex manufacturing processes involved.
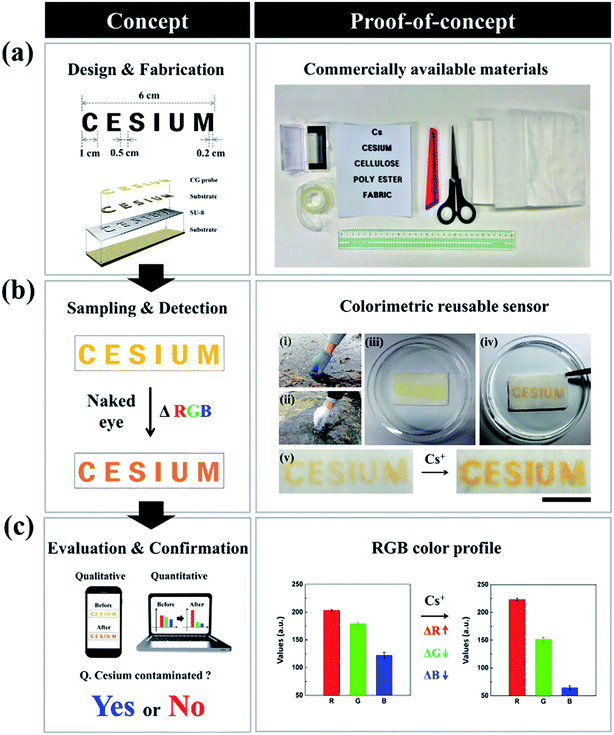
To facilitate the development of an on-site portable sensor device, we here present a colorimetric reusable sensor (CRS) technology for inactive cesium detection based on the color transition of a chrysoidine G (CG) chemo-indicator with highly sensitive and selective signals through fabrication of a strip-type paper-based sensor. The concept of our CRS for the rapid on-site diagnosis of Cs can be described by classifying the process into three major parts, namely, the fabrication of a paper strip impregnated with CG, the detection of a change in color through a reaction with the sample solution, and evaluation and confirmation via an image captured by a mobile phone. In order to implement a cheap, easy to make and operate, and versatile sensor, we used flexible substrates such as paper, plastic, and fabric, which can be used easily in everyday life. This method will detect and provide on-site diagnostic signals about the presence of inactive Cs pollutants in hazardous environment within a short time that can be identified by the human eye, as well as quantitative digital information through analysis of images captured by a smart phone or portable camera.
2. Materials and method
2.1. Materials
4-Phenylazo-m-phenylenediamine (chrysoidine G, CG) and Whatman cellulose chromatography paper were purchased from Sigma-Aldrich Chemicals (MO, USA). Inactive cesium (133Cs) standard solutions were obtained from o2si smart solutions (SC, USA). Lead, mercury, and zinc standard solution were purchased from CPI International (CA, USA). Iron(II) chloride tetrahydrate, iron(III) chloride hexahydrate, magnesium chloride hexahydrate, manganese chloride tetrahydrate, and aluminum chloride hexahydrate were purchased from Sigma-Aldrich Chemicals (MO, USA). The real environmental samples from a stream and a lake were collected from Korea Atomic Energy Research Institute (KAERI), Jeongeup, Republic of Korea. All reagents and chemicals were of analytical grade and were used as purchased without further purification.2.2. Fabrication of a text-reporting colorimetric reusable sensor
The text-reporting colorimetric reusable sensor was fabricated using a standard protocol of photolithography (Fig. S1†).28–30 Briefly, various flexible substrates (cellulose, polyester, and non-woven fabric) were coated with 1 mL of SU-8 photoresist (SU-8 2025, MicroChem Corp., MA, USA) by means of spin coating (1000 rpm, 10 s) (step 1). The SU-8 photoresist was immobilized into flexible substrate networks and then soft baked at 90 °C for 60 min followed by stabilization at room temperature (step 2). Then, the glass photomask and paper were assembled in face to face stacking (step 3). Of note is the fact that we made a glass photomask composed of two slide glasses and a piece of paper printed with text. Also, to achieve high-resolution text patterning, the conformal contact between the glass photomask and the SU-8 impregnated paper was fastened by clamps. The glass photomask was placed on SU-8 coated flexible substrates and then exposed to UV irradiation (λ = 365 nm, UVItec, London, UK) for 1 min (step 4). After UV irradiation, the paper substrate was developed in an alkaline solvent to remove the residual photoresist (step 5). Then, the hydrophilic text region became visible after the paper was washed with distilled water. Finally, a CG aqueous chemo-indicator was introduced on to the hydrophilic text region (step 6).2.3. Fabrication of a colorimetric reusable sensor
The colorimetric reusable sensor (CRS) was fabricated using the drop-casting method.32 Briefly, for the homogeneous distribution of the CG chemo-indicator between the cellulose matrixes, cellulose papers were prepared through immersion in an aqueous CG chemo-indicator. This paper was then allowed to dry in the oven at 50 °C for 30 min to induce slow evaporation (not by aggregated CG molecules, known as the coffee ring effect).33 The fabrication of the CRS using various substrates is performed in the same way.2.4. Photospectrometric titrations
Aqueous solutions of CG chemo-indicator (7 × 10⁻⁵ M) were prepared in H2O. Inactive Cs standard solution (1000 mg L−1) was prepared in 20 mL of double-distilled water and a series concentrations of the Cs solution was transferred to the solution of CG (7 × 10⁻⁵ M). Working solutions were prepared by diluting the stock solution to the desired concentration using double-distilled water. After mixing them by hand shaking for a few seconds, UV-vis spectra were recorded on an Infinite UV M200 spectrophotometer (TECAN, Austria).2.5. Analysis of colorimetric reusable sensors
For the quantitative analysis, the reusable sensors were analyzed with a handy phone camera in high dynamic range (HDR) mode. The color changes of the reusable substrates (cellulose, polyester, and non-woven fabric) were analyzed using a scanner and were saved in TIF format. The numerical single-color coordinate values of the colorimetric images were extracted from nine-grid points in the resulting experimental image using ImageJ software.34,35 The ΔR, ΔG, and ΔB values were then determined from the RGB values before and after the sensing images and were used for the histogram plot.2.6. Detection and analysis of real samples
To demonstrate the utility of the CRS for a real sample in the environmental field, we carried out a series of experiments in the Korea Atomic Energy Research Institute (KAERI) after taking field real samples from two different locations near a small lake (latitude: 37° 38′ 0.57′′ N and longitude: 127° 5′ 6.18′′ E) and stream (latitude: 35° 30′ 44.99′′ N and longitude: 126° 50′ 1.64′′ E). In detail, the CRS was placed at the base and five photographs were taken within 5 s after soaking it in a field real samples. The distance between the camera and CRS, lighting conditions, and camera setting were kept constant for all experiments. No cesium was detected in the water samples, so samples were spiked with a cesium standard solution. Subsequently, 3 mL of a spiked real water sample was pipetted into each of plastic Petri dishes, before adding the standard cesium solution. The concentrations of cesium standard added were 0, 0.2, and 0.5 mg L−1.3. Results and discussion
3.1. Fabrication of a text-reporting colorimetric reusable sensor (CRS)
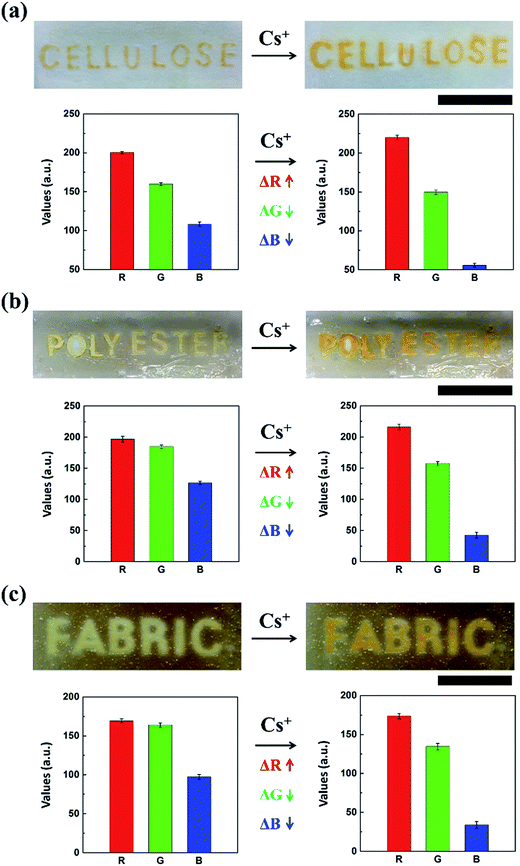
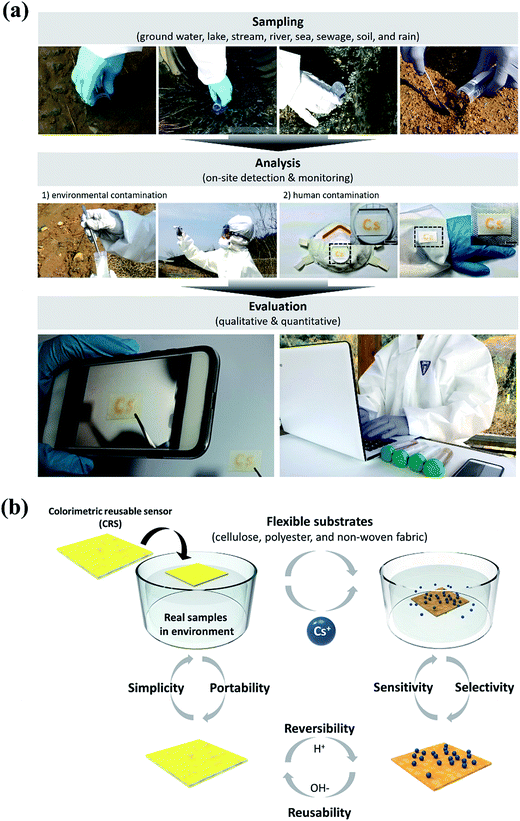
Our proposed detection system is easy to make and operate and can achieve the rapid diagnosis of inactive Cs with a high level of sensitivity and accuracy. As described in Fig. 1a, the strategy for our detection method can be guided through a straightforward “design and fabrication, detection and analysis, and evaluation and confirmation” procedure, which does not require expensive materials, sophisticated devices, or analytical specialists.27,28 The major challenge of chemosensor's insolubility is resolved in our work by developing CRS through the impregnation of a CG chemo-indicator with various types of substrates. The CRS sensing strip was first prepared using simple patterning techniques via a direct dipping process or photolithography, so that the chemo-indicator was impregnated in a stable manner with regard to the position of the intended characters and patterns (Fig. 1a and S1†).29 Here, we patterned the letter “CESIUM” on a substrate comprising a variety of polymers and cotton materials through soft lithography by utilizing surface properties. To be precise, SU-8 photoresist penetrates the cellulose networks as a hydrophobic barrier which contributes to selective wetting in the hydrophilic text region (see the Experimental section for details). As shown in Fig. 1b, the text-reporting CRS may allow the potential use of cesium analysis in real environmental samples using proof-of-concept experiments. To demonstrate the usefulness of the CRS for a real sample in the environmental field, we next carried out a series of experiments in KAERI after taking field samples from two different locations near a small lake and stream, (i) and (ii) (Fig. 1b). In the case of the two samples (see the image (iii) of the CRS in Fig. 1b), there was barely any color change in the sensor, indicating that inactive Cs was not present. In order to confirm the capability of the cellulose-based CRS to distinguish the presence of inactive Cs, the environmental water was spiked with 0.5 mg L−1 of inactive Cs prior to testing. When a sample solution was introduced into the cellulose CRS, the resulting color change remarkably occurred within 3 s ((iv) and (v) in Fig. 1b). To facilitate a quantitative analysis, the resulting CRS image was recorded using a portable smart phone camera. Fig. S2† shows satisfactory analytical results for the artificial contamination of cesium spiked real aqueous samples. As shown in Fig. 1c, the recorded data can be imported into generalized analytical freeware, and the difference in color intensity can then be quantified using the histogram function. These results show the capability of CRS to detect Cs ions in water with a more complex composition. Also, the CRS can be designed and fabricated easily on flexible substrates using patterning techniques, dipping, and photolithography. In this study, the use of various flexible substrates including cellulose, polyester, and non-woven fabric provided a proof-of-concept design for flexible sensors (Fig. 2). Cellulose, which has a white background, is easier to observe changes in the color of the sensor owing to high-contrast enhancement. Unlike other conventional rigid sensing platforms including plastic, glass, and metal, these flexible substrates can offer a new type of custom fitted sensing applications for adjusting to various environmental conditions.3.2. Cellulose-based CRS and its reusability
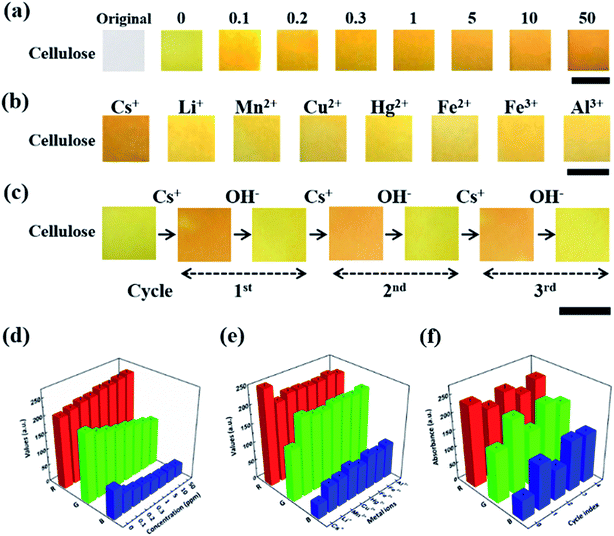
To attain the quantitative numerical values of the sensor, the color transitions of the CRS strips were recorded using portable devices such as smart phone cameras and desktop scanners. As shown in Fig. 3a, when the CRS strips were developed by immersing them into solutions at different concentrations of inactive Cs, the obvious color change was observed from light yellow to red orange.36–38 The CRS strips showed excellent detection sensitivity to cesium in the range from 100 μg L−1 to 50 mg L−1 and provided good linearity up to a cesium concentration of 250 μg L−1 with a detection limit of 100 μg L−1 (Fig. S3†). In addition, we conducted a quantitative measurement of the degree of contamination using mathematical conversion from the RGB color value (Fig. 3d). The red value (R) gradually increased in line with the concentration of cesium. Conversely, in terms of cesium concentration, the cellulose paper showed decreased values for green (G) and blue (B) compared to the control. Therefore, we successfully demonstrated the ability to quantify inactive Cs concentration based on the conversion of the RGB color values. The selective detection of target material among competitive ions by CRS is examined by the changes in the color of the CG chemo-indicator in the presence of other metal ions (Fig. 3b). In the selectivity experiment using cesium and other metal ions with 0.5 mg L−1 concentration, cesium contaminated solution showed a maximum color transition, corresponding to the result of the quantitative RGB numerical analysis in Fig. 3e. These results clearly show that the CRS strips are not notably disturbed by the presence of other metal ions. The most challenging aspects of the conventional sensors based on color changes are their recyclability and reusability. The reusability of our CRS is examined by using a reversible reaction between a CG chemo indicator and Cs ion. As shown in Fig. 3c, a strong external complexing agent was applied after the detection of inactive Cs; that is, a Cs ion can combine favorably with NaOH to transform into a more stable NaOH–Cs+ complex. Also, the colorimetric cellulose paper showed excellent reusability with no color intensity decay over several cycles (Fig. 3f). These results suggest that CRS strips have invaluable practical application potential for on-site environmental detection.3.3. Fabrication of CRS strips using various flexible substrates
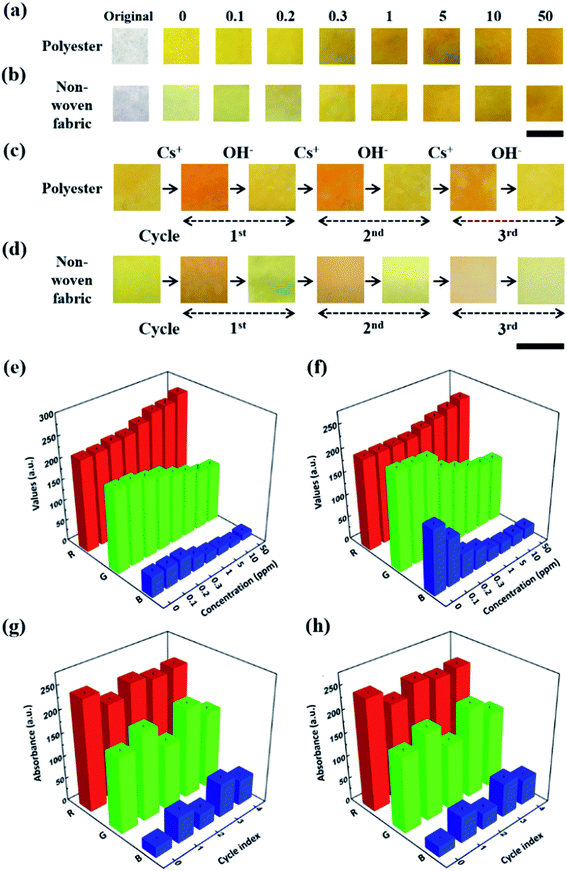
CRS strips of different flexible substrates, cut to a constant size (1 cm × 1 cm), were prepared through a simple dipping method in a CG chemo-indicator solution of optimal concentration at various dipping intervals (10–60 min) followed by drying the strips in order to impregnate a chemo-indicator to form flexible chips at 50 °C for 1 h. This method allows the stable immobilization of a chemo-indicator on all flexible substrates by facilitating electrostatic and hydrophilic interactions between them. Using the resulting strips with polyester and non-woven fabric (Fig. 4a and b),30 we were able to observe the color transition in the concentration range from 100 μg L−1 to 50 mg L−1, which was similar to the result obtained using the cellulose-based strip sensor. However, depending on the different types of flexible substrate, the RGB histogram plot as a quantitative analysis shows a slightly different sensitivity depending on the corresponding change in the concentration of inactive Cs (Fig. 4e and f). This is because each flexible substrate has different intrinsic physical (pore size and surface area) and chemical properties (hydrophilicity) for binding the chemo-indicator. Among the flexible substrates, the cellulose strip sensor showed the most sensitive color change due to higher hydrophilic properties and its white background, in addition to its wide range of pore size distributions, good wettability, high contrast enhancement, and high surface area to weight ratio, as well as its three-dimensional network. On the other hand, the polyester and non-woven fabric-based strip sensors showed a good reversible “turn-on” colorimetric response to inactive Cs over up to four cycles (Fig. 4c–h). It is noteworthy that the hybridized CRS strips providing considerable flexibility, including rigidity, a rapid response time (<3 s), and a low detection limit (100 μg L−1), may be useful as a smart strategy to fabricate a fast, responsive device for real, conventional applications such as analogical colorimetric test kits, skin patches, and wearable devices for monitoring the environment,39 especially for the on-site detection of inactive Cs in contaminated areas.40–423.4. Chemo-indicator for the selective colorimetric sensing of Cs
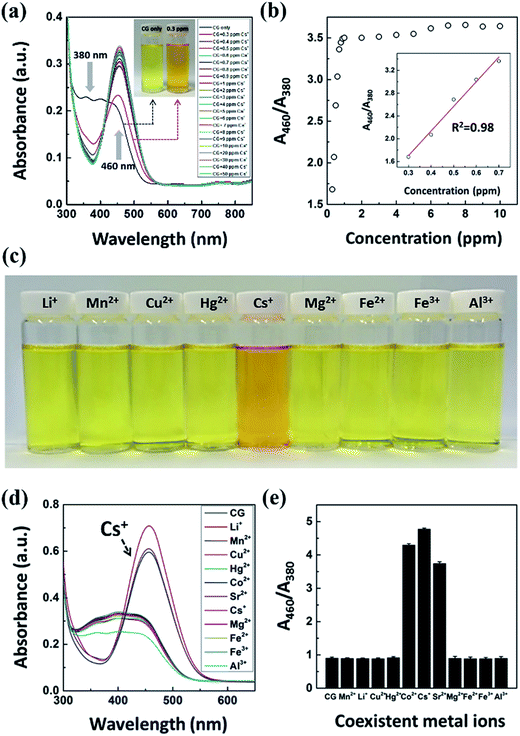
The investigation of photophysical properties of CG showing the color changes in the CG chemo-indicator according to Cs concentration is shown in Fig. 5. The color of the CG solution was changed from light yellow to red orange with increasing concentrations of inactive Cs and was monitored by the naked eye within few seconds (<3 s). Consistent with the spectrophotometric titration technique used,43 the concentration response of the CG chemo-indicator (7 × 10⁻⁵ M) used for inactive Cs detection was quantified by measuring the absorbance intensity at 380 nm and by the formation of a significant red-shifted absorbance band at 460 nm (by 80 nm), with a clear isosbestic point at 410 nm (Fig. 5a). The relative absorbance intensity ratio (A460/A380) was found to increase in line with increasing concentrations of inactive Cs. According to this unique color change behavior, we expect that the quenching of the absorbance intensity at around 380 nm due to the binding of Cs to the CG moiety reduces the electron transfer, thus suppressing the internal charge transfer process and causing the red shift in absorbance intensity.44–46 Moreover, the coordination of cesium ions to nitrogen atoms in the azo functional group suppresses the photo-induced electron transfer quenching process, thus leading to an enhancement in absorbance intensity.47,48 Compared to the color change of the CG chemo-indicator solution seen by the naked eye, we successfully distinguished the color change with a limit of detection on the order of 300 μg L−1 of Cs ions, which indicated a higher sensitivity than any other chemosensor system (Fig. 5a, inset). Fig. 5b shows that the absorbance intensity around 460 nm was increased and attained saturation when inactive Cs concentration reaches 0.7 mg L−1. Additionally, the stability of the CG solution was investigated at different pH levels. The relative absorbance intensity ratio to Cs ions increased in line with the increase in pH to 6 due to the electrostatic interactions between the Cs ions and the CG indicator, as shown in Fig. S4.† This increase in absorbance intensity was associated with an increase in the mutual electrostatic interactions between them in line with pH values, resulting in the formation of a red-shifted band. In contrast, the intensity ratio (A460/A380) sharply decreased in acidic and basic pH because the Cs binding force to the CG indicator was inhibited by H+ or OH− ions, which induce the hydration or dehydration effect. Based on these results, the pH 6 was chosen as an optimum value for the detection of inactive Cs, and will thus be applied to the rest of the study. We next demonstrated the selectivity experiments of the CG aqueous chemo-indicator towards inactive Cs in the presence of several metal ions such as Li+, Mn2+, Cu2+, Hg2+, Co2+, Sr2+, Mg2+, Fe2+, Fe3+, and Al3+ in water (each of these was added to 0.5 mg L−1). As shown in Fig. 5c, there was no significant variation in the color of the CG aqueous chemo-indicator for metal ions, except radionuclides such as Cs, Sr, and Co ions, which still maintained their distinctive light in yellow color. The selectivity of the CG can also be confirmed by a UV-vis analysis, compared with the coexisting metal ions, showed that only the Cs ions can induce UV absorbance enhancement in an aqueous solution (Fig. 5d). The quantitative nature of the selective detection of Cs by CG in the solution is shown in Fig. 5e. The distinct relative absorbance ratio of the Cs ion might be the cause of the distinct red orange color of the CG chemo-indicator containing cesium. Chrysoidine G is highly absorbing, monovalent and possesses low molecular weight with simple chemical structure among other azo dyes. When Cs is added to chrysoidine G, the Cs react with the –N![[double bond, length as m-dash]](https://www.rsc.org/images/entities/char_e001.gif) N– double bond of CG and binds with it. This complexation is selective for Cs among other cations such as Mn2+, Cu2+, Hg2+, Co2+, Sr2+, Mg2+, Fe2+, Fe3+, and Al3+ with a remarkable color discrimination rapidly. The selective complexation of Cs may be attributed to (i) the size of the hydrated Cs ions, and (ii) the entropic free volume and spatial arrangement of azobenzene and the amino groups present in the CG.49,50 Also, the mobility of monovalent Cs+ cations are higher than that of the divalent (Mn2+, Cu2+, Hg2+, Co2+, Sr2+, Mg2+, and Fe2+) and trivalent (Fe3+ and Al3+) cations and offers an acceptable mobility match for the low molecular weight CG. Thus Cs provides the highest possibility for binding with CG and exhibited maximum detection sensitivity. This study suggests that other metal ions showed weak to negligible competition in terms of the performance of the CG chemo-indicator for colorimetric detection.
N– double bond of CG and binds with it. This complexation is selective for Cs among other cations such as Mn2+, Cu2+, Hg2+, Co2+, Sr2+, Mg2+, Fe2+, Fe3+, and Al3+ with a remarkable color discrimination rapidly. The selective complexation of Cs may be attributed to (i) the size of the hydrated Cs ions, and (ii) the entropic free volume and spatial arrangement of azobenzene and the amino groups present in the CG.49,50 Also, the mobility of monovalent Cs+ cations are higher than that of the divalent (Mn2+, Cu2+, Hg2+, Co2+, Sr2+, Mg2+, and Fe2+) and trivalent (Fe3+ and Al3+) cations and offers an acceptable mobility match for the low molecular weight CG. Thus Cs provides the highest possibility for binding with CG and exhibited maximum detection sensitivity. This study suggests that other metal ions showed weak to negligible competition in terms of the performance of the CG chemo-indicator for colorimetric detection.
3.5. Job's plot
To further understand the binding phenomenon and the stoichiometry of the complex formation, the Job's plot for absorbance intensity was determined by changing the molar ratio of inactive Cs (Xm = [Cs+]/([Cs+] + [CG])).51 The total concentrations of CG and Cs were fixed at 10 μM, by continuously varying the molar fraction of Cs. The maximum absorbance intensity was observed in complexes of Cs, where the molar fraction of Cs was 0.3. The plot of the relative absorbance intensity ratio versus Xm, as shown in Fig. S5† indicates that the complex formed between CG and Cs follows a 2![[thin space (1/6-em)]](https://www.rsc.org/images/entities/char_2009.gif) :
:![[thin space (1/6-em)]](https://www.rsc.org/images/entities/char_2009.gif) 1 stoichiometry binding process.
1 stoichiometry binding process.
3.6. Reversible CG chemo-indicator reaction
To facilitate a better understanding of the coordination between CG and cesium, a reversible experiment was performed by adding a 1 N NaOH aqueous solution into an aqueous sample containing 0.5 mg L−1 of inactive Cs with a CG chemo-indicator (Fig. 6). It was observed that the color of the solution recovered its original light yellow state. For the achievement of the reversibility experiment, the color and absorbance of CG–Cs+ complex should be simultaneously recovered through the bonding of Cs to interact with other strong binding forces. Thus, the original color of the CG aqueous chemo-indicator turned back to red orange when injected again into a 1 N HCl aqueous solution (Fig. 6a). This reversibility procedure was successfully repeated in eight cycles, as shown in Fig. 6b. The ability to selectively detect Cs is attributed to a kind of complexing environment similar to that of cryptates. The selective sensing of Cs can be proposed by considering the formation of the cavity on the CG equivalent to that of cryptates. Cryptates consist of a polycyclic ring with both N and O atoms which effectively co-ordinate with the alkali metal ions. In our case, CG act as cryptand (an ideal cation receptor) which forms highly stable complexes (cryptates) with metal cations (Cs+) which are of an appropriate size for the cryptant cavity (or crypt). The hydrated Cs+ spheres whose size matches with that of the cryptates are occupied solely by binding groups of the cryptant and the Cs+ ions are centrally sited in the cryptant cavity. The electron density of the nitrogen atoms is directed toward the inside of the intramolecular cavity and appreciably complexed with electrophilic cesium ions. The effect of pH on the sensing of Cs ions revealed that the sensor exhibited a better response to a neutral pH, whereas it provided a poor signal of low sensitivity at a higher or lower pH. Based on these results, we speculate that the complexation of the Cs ion in the CG-flexible substrates depends on the hydration radius of Cs. At higher and lower pH values, the hydration radius of the Cs ion becomes less. Using the hydration and dehydration behavior of the Cs ion in response to lower and higher pH values, we successfully presented a method to fabricate the reusable sensor strip for the detection of Cs using various flexible substrates impregnated with a CG chemo-indicator.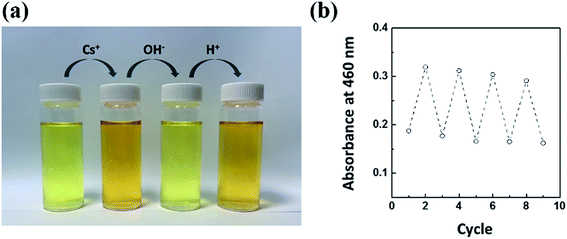 | ||
| Fig. 6 (a) The reversibility behavior between CG and Cs. (b) Changes in the absorbance intensities of CG during step-wise complexation and de-complexation processes. | ||
3.7. Wearable CRS for the on-site detection of Cs
We have demonstrated different roles of CRS and applied them to the simple “colorimetric wearable patch sensor” proof of concept for nuclear disaster, as demonstrated in Fig. 7a. To prove the concept, we carried out simulation training for colorimetric inactive Cs detection. Basically, CRSs are used for detecting environmental contamination. However, in the case of rain, human contamination is inevitable because contaminants such as Cs can be dissolved easily in the atmospheric vapor. For this reason, the CRS is applied to protective clothing (i.e., mask, glasses, and gloves) by attaching the flexible CRS in the form of a wearable patch sensor. According to this simulation, it is anticipated that a newly developed CRS can be used for on-site detection in real-life situations. Finally, the diagram of proposed processes for detecting inactive Cs is schematically shown in Fig. 7b. The major advantages of CG-based detection of Cs using appealing analytical features are illustrated in the following points: (1) a facile and robust synthetic method using low-cost materials; (2) high selectivity and good sensitivity; (3) comparable multiple regeneration cycles (i.e., reversibility and reusability); (4) simplicity and portability; (5) rapid responsive detection time; and (6) a water-compatible sensing system.4. Conclusion
In this paper, we described the development of a CG-based novel colorimetric sensor on hybridized flexible substrates for the on-site detection and monitoring of inactive Cs, a process that facilitates the “naked eye” detection of Cs. By discriminating the color changes of the CRS in accordance with the interaction of the CG chemo-indicator with Cs ions, we successfully detected inactive Cs with a detection limit of 100 μg L−1 and demonstrated the ability to quantify the sample solution through the conversion of mathematical RGB color values from the image of the sensor strip. The colorimetric response of the RGB values and the corresponding Cs concentrations showed a well-matched relationship under dynamic environmental conditions. The recycle test with reversibility indicated that the detection process was stable even after eight consecutive regeneration cycles. More importantly, this can be applied to real samples as a photochromic paper sensor for environmental monitoring. Water sample detection can be achieved by gently dipping the hybridized reusable sensors in water, and the results can be saved by using portable devices such as a smart phone camera. This will allow on-site analysis of unknown samples since the method does not require skilled operators for the colorimetric detection of Cs. Also, the detection time can be shortened to 3 s to change the color response, which offers further evidence of the potential for on-site detection and real-time monitoring. We believe that the newly developed colorimetric reusable sensors could be expanded to real situations that require sensing applications, particularly in the areas of the environmental and the analytical sciences.Conflicts of interest
There are no conflicts of interest to declareAcknowledgements
This work was supported by the Radiation Fusion Technology Program (2015M2A2A6A02045262(3)) from Nulear Research R&D Program through the National Research Foundation of Korea (NRF) funded by the Ministry of Science, ICT & Future Planning (MSIP), Republic of Korea.References
- M. R. Awual, T. Yaita, T. Taguchi, H. Shiwaku, S. Suzuki and Y. Okamoto, J. Hazard. Mater., 2014, 278, 227–235 CrossRef CAS PubMed.
- N. Kinoshita, K. Sueki, K. Sasa, J. Kitagawa, S. Ikarashi, T. Nishimura, Y. Wong, Y. Satou, K. Handa, T. Takahashi, M. Sato and T. Yamagata, Proc. Natl. Acad. Sci. U. S. A., 2011, 108, 19526–19529 CrossRef CAS PubMed.
- S.-C. Jang, Y. Haldorai, G.-W. Lee, S.-K. Hwang, Y.-K. Han, C. Roh and Y. S. Huh, Sci. Rep., 2015, 5, 17510 CrossRef CAS PubMed.
- Y. Morino, T. Ohara and M. Nishizawa, Geophys. Res. Lett., 2011, 38, L00G11 CrossRef.
- J. Smith, O. Voitsekhovitch, L. Håkanson and J. Hilton, J. Environ. Radioact., 2001, 56, 11–32 CrossRef CAS PubMed.
- J. Szabo and S. Minamyer, Environ. Int., 2014, 72, 129–132 CrossRef CAS PubMed.
- T. Mizuno and H. Kubo, Sci. Rep., 2013, 3, 1742 CrossRef PubMed.
- B. Radaram, T. Mako and M. Levine, Dalton Trans., 2013, 42, 16276–16278 RSC.
- P. Melnikov and L. Z. Zanoni, Biol. Trace Elem. Res., 2010, 135, 1–9 CrossRef CAS PubMed.
- X. Liu, G. R. Chen, D. J. Lee, T. Kawamoto, H. Tanaka, M. L. Chen and Y. K. Luo, Bioresour. Technol., 2014, 160, 142–149 CrossRef CAS PubMed.
- H. Deng, Y. Li, Y. Huang, X. Ma, L. Wu and T. Cheng, Chem. Eng. J., 2016, 286, 25–35 CrossRef CAS.
- N. Kumar, I. Leray and A. Depauw, Coord. Chem. Rev., 2016, 310, 1–15 CrossRef CAS.
- L.-J. Sun, Q.-M. Feng, Y.-F. Yan, Z.-Q. Pan, X.-H. Li, F.-M. Song, H. Yang, J.-J. Xu, N. Bao and H.-Y. Gu, Biosens. Bioelectron., 2014, 60, 154–160 CrossRef CAS PubMed.
- L. Feng, H. Li, L.-Y. Niu, Y.-S. Guan, C.-F. Duan, Y.-F. Guan, C.-H. Tung and Q.-Z. Yang, Talanta, 2013, 108, 103–108 CrossRef CAS PubMed.
- H. Tao, L. R. Chieffo, M. A. Brenckle, S. M. Siebert, M. Liu, A. C. Strikwerda, K. Fan, D. L. Kaplan, X. Zhang and R. D. Averitt, Adv. Mater., 2011, 23, 3197–3201 CrossRef CAS PubMed.
- M.-Y. Hsu, C.-Y. Yang, W.-H. Hsu, K.-H. Lin, C.-Y. Wang, Y.-C. Shen, Y.-C. Chen, S.-F. Chau, H.-Y. Tsai and C.-M. Cheng, Biomaterials, 2014, 35, 3729–3735 CrossRef CAS PubMed.
- W. Chen, X. Fang, H. Li, H. Cao and J. Kong, Sci. Rep., 2016, 6, 31948 CrossRef CAS PubMed.
- K. Zhang, J. Zhao, H. Xu, Y. Li, J. Ji and B. Liu, ACS Appl. Mater. Interfaces, 2015, 7, 16767–16774 CAS.
- Y. Wu, P. Xue, Y. Kang and K. M. Hui, Anal. Chem., 2013, 85, 8661–8668 CrossRef CAS PubMed.
- M. He and Z. Liu, Anal. Chem., 2013, 85, 11691–11694 CrossRef CAS PubMed.
- L. Feng, X. Li, H. Li, W. Yang, L. Chen and Y. Guan, Anal. Chim. Acta, 2013, 780, 74–80 CrossRef CAS PubMed.
- C.-M. Shih, C.-L. Chang, M.-Y. Hsu, J.-Y. Lin, C.-M. Kuan, H.-K. Wang, C.-T. Huang, M.-C. Chung, K.-C. Huang and C.-E. Hsu, Talanta, 2015, 145, 2–5 CrossRef CAS PubMed.
- L. Cao, C. Fang, R. Zeng, X. Zhao, Y. Jiang and Z. Chen, Biosens. Bioelectron., 2017, 92, 87–94 CrossRef CAS PubMed.
- Q. Kong, Y. Wang, L. Zhang, S. Ge and J. Yu, Sens. Actuators, B, 2017, 243, 130–136 CrossRef CAS.
- A. S. Kubo and D. J. Rose, Science, 1973, 182, 1205–1211 CAS.
- T. Shahwan and H. Erten, J. Radioanal. Nucl. Chem., 2002, 253, 115–120 CrossRef CAS.
- S.-M. Kang, S.-C. Jang, G. Y. Kim, C.-S. Lee, Y. S. Huh and C. Roh, Sensors, 2016, 16, 626 CrossRef PubMed.
- S.-M. Kang, S.-C. Jang, Y. S. Huh, C.-S. Lee and C. Roh, Chemosphere, 2016, 152, 39–46 CrossRef CAS PubMed.
- A. W. Martinez, S. T. Phillips, G. M. Whitesides and E. Carrilho, Anal. Chem., 2009, 82, 3–10 CrossRef PubMed.
- A. W. Martinez, S. T. Phillips, M. J. Butte and G. M. Whitesides, Angew. Chem., Int. Ed., 2007, 46, 1318–1320 CrossRef CAS PubMed.
- N. Q. Huy and V. X. An, Appl. Radiat. Isot., 2012, 70, 2695–2702 CrossRef CAS PubMed.
- M. Xu, B. R. Bunes and L. Zang, ACS Appl. Mater. Interfaces, 2011, 3, 642–647 CAS.
- P. J. Yunker, T. Still, M. A. Lohr and A. G. Yodh, Nature, 2011, 476, 308–311 CrossRef CAS PubMed.
- C. A. Schneider, W. S. Rasband and K. W. Eliceiri, NIH image to ImageJ: 25 years of image analysis, Nat. Methods, 2012, 9, 671–675 CrossRef CAS PubMed.
- B. Yoon, I. S. Park, H. Shin, H. J. Park, C. W. Lee and J. M. Kim, Macromol. Rapid Commun., 2013, 34, 731–735 CrossRef CAS PubMed.
- Z. Guo, J. Duan, F. Yang, M. Li, T. Hao, S. Wang and D. Wei, Talanta, 2012, 93, 49–54 CrossRef CAS PubMed.
- J. E. Lee, H. W. Shim, O. S. Kwon, Y.-I. Huh and H. Yoon, Analyst, 2014, 139, 4466–4475 RSC.
- Y. Takahashi, H. Kasai, H. Nakanishi and T. M. Suzuki, Angew. Chem., Int. Ed., 2006, 45, 913–916 CrossRef CAS PubMed.
- S. Patel, H. Park, P. Bonato, L. Chan and M. Rodgers, J. Neuroeng. Rehabil., 2012, 9, 1–17 CrossRef PubMed.
- P. Bhandari, T. Narahari and D. Dendukuri, Lab Chip, 2011, 11, 2493–2499 RSC.
- A. Nilghaz, D. H. B. Wicaksono, D. Gustiono, F. A. A. Majid, E. Supriyanto and M. R. A. Kadir, Lab Chip, 2012, 12, 209–218 RSC.
- X. Li, J. Tian and W. Shen, ACS Appl. Mater. Interfaces, 2009, 2, 1–6 Search PubMed.
- A. Y. Nazarenko, Spectrosc. Lett., 2010, 43, 555–560 CrossRef CAS.
- H.-H. Wang, L. Xue, Y.-Y. Qian and H. Jiang, Org. Lett., 2009, 12, 292–295 CrossRef PubMed.
- C. Lu, Z. Xu, J. Cui, R. Zhang and X. Qian, J. Org. Chem., 2007, 72, 3554–3557 CrossRef CAS PubMed.
- S. Goswami, D. Sen and N. K. Das, Org. Lett., 2010, 12, 856–859 CrossRef CAS PubMed.
- H.-F. Ji, R. Dabestani and G. M. Brown, J. Am. Chem. Soc., 2000, 122, 9306–9307 CrossRef CAS.
- C.-I. Wu, C.-T. Lin, Y.-H. Chen, M.-H. Chen, Y.-J. Lu and C.-C. Wu, Appl. Phys. Lett., 2006, 88, 152104 CrossRef.
- I. J. Byun, M. Lee and Y. K. Han, J. Polym. Sci., Part A: Polym. Chem., 2016, 54, 1713–1723 CrossRef CAS.
- K. M. Fromm, Coord. Chem. Rev., 2008, 252, 856–885 CrossRef CAS.
- P. Job, Ann. Chim., 1928, 9, 133–203 Search PubMed.
Footnotes |
| † Electronic supplementary information (ESI) available. See DOI: 10.1039/c7ra08444g |
| ‡ These authors contributed equally to this work. |
| This journal is © The Royal Society of Chemistry 2017 |

