 Open Access Article
Hydrothermal synthesis of nitrogen and boron doped carbon quantum dots with yellow-green emission for sensing Cr(VI), anti-counterfeiting and cell imaging†
Yongming Guo *a,
Yuzhi Chenbc,
Fengpu Caoa,
Lijuan Wanga,
Zhuo Wang
 *bc and
Yumin Lengd
aKey Laboratory of Ecological Security for Water Source Region of Mid-line of South-to-North Diversion Project of Henan Province, Collaborative Innovation Center of Water Security for Water Source Region of Mid-line of South-to-North Diversion Project of Henan Province, Engineering Technology Research Center of Henan Province for Solar Catalysis, College of Chemistry and Pharmaceutical Engineering, Nanyang Normal University, Nanyang 473061, China. E-mail: chinahenangm@163.com
bBeijing Advanced Innovation Center for Soft Matter Science and Engineering, State Key Laboratory of Chemical Resource Engineering, Beijing University of Chemical Technology, Beijing 100029, China. E-mail: wangzhuo77@mail.buct.edu.cn
cState Key Laboratory of Chemo/Biosensing and Chemometrics, Hunan University, Changsha 410082, China
dCollege of Physics and Electronic Engineering, Nanyang Normal University, Nanyang 473061, China
First published on 16th October 2017
Abstract
Nitrogen and boron doped carbon quantum dots (NB-CQDs) with yellow-green emission were prepared via hydrothermal method using 2-hydroxyphenylboronic acid and ethylenediamine in aqueous solution. The as-prepared NB-CQDs exhibited bright yellow-green emission, excellent stability in aqueous solution with high ionic strength and good biocompatibility. We further explored the applications of NB-CQDs for sensing metal ions in aqueous solution. We found that the NB-CQDs could be utilized to sense Cr2O72− in aqueous solution due to the Cr2O72−-induced fluorescence quenching. In the sensing system, as low as 0.5 μM Cr2O72− can be successfully detected and a good linear relationship in the range of 0–250 μM has been obtained. And the NB-CQDs can be also used as ink for writing on paper, revealing the NB-CQDs can be applied for anti-counterfeiting. Moreover, the NB-CQDs exhibit negligible cytotoxicity and good biocompatibility, which is favorable for bioimaging applications. And the NB-CQDs were successfully applied for fluorescence imaging in HeLa cells.
1. Introduction
Fluorescent nanomaterials have recently attracted considerable attention owing to their tremendous potential applications in various fields including bioimaging,1,2 chemo/biosensing,2–6 photocatalysis,2,7,8 optoelectronic devices,2,9 and so on. However, the traditional heavy metal-based quantum dots (QDs), such as CdTe, CdSe and CdS QDs, suffer from the toxicity of these heavy metal ions. Continuous efforts are thus being devoted to synthesis of various fluorescent nanomaterials with low toxicity. Among them, carbon quantum dots (CQDs) have drawn great interest due to fascinating properties including easy fabrication, low-cost, excellent biocompatibility, good photostability, bright fluorescent properties, good water solubility, low cytotoxicity.4 Therefore, considerable efforts have been dedicated to preparation of various CQDs with different emission, and conspicuous progresses of these CQDs on diverse applications including bioimaging, biosensing, photocatalysis, and optoelectronic devices have been made.4,7–9In recent years, heteroatoms-doped CQDs have become research hot spots because the incorporation of heteroatoms in the framework of the CQDs can improve or change the properties of these CQDs, such as optical, electrical and other properties, resulting into more promising applications. Huang's group has prepared nitrogen-doped CQDs (N-CQDs) from the hydrothermal treatment of citric acid and guanidine hydrochloride. And they found that nitrogen doping could improve the emission efficiency and favor excitation-independent emission.10 Ma and co-workers have synthesized N-CQDs from the ultrasonic reaction between glucose and ammonium hydroxide. And the N-CQDs showed strong emission in the visible-to-near infrared range and upconversion photoluminescence properties. Surprisingly, the N-CQDs displayed good photocatalytic property for the photodegradation of methyl orange under visible light.11 Citric acid and polyethylenimine have been utilized to prepare blue-emitting N-CQDs, which can be employed for cell imaging. Interestingly, the N-CQDs can cross the blood–brain barrier in a concentration-dependent manner.12 Gd(III)-doped CQDs (Gd-CQDs) have been prepared. The Gd-CQDs displayed strong fluorescence, strong T1-weighted MRI contrast and low cytotoxicity, which indicated that the Gd-CQDs showed potential applications in biomedical fields.13 We have prepared nitrogen and phosphorus-doped carbon quantum dots (NP-CQDs) via one pot hydrothermal method. The NP-CQDs have been utilized to detect Fe3+ in aqueous solution with good sensitivity.14 Liu and co-workers have synthesized boron and nitrogen-doped carbon quantum dots (NB-CQDs) from the hydrothermal treatment of branched polyethylenimine and 4-formylphenylboronic acid. The NB-CQDs exhibited excitation-dependent emission behavior and high quantum yield. And the as-prepared NB-CQDs have been applied for detecting Fe3+ and cell imaging. However, the NB-CQDs showed blue emission, which is not well suitable for the biological applications due to the bad tissue-penetrating ability of blue fluorescence.15 Thus, development of various CQDs with long-wavelength fluorescence emission is highly desirable.
Herein, we present a facile method for the synthesis of nitrogen and boron doped carbon quantum dots (NB-CQDs) with yellow-green emission through the hydrothermal method using 2-hydroxyphenylboronic acid and ethylenediamine as the precursors. The as-prepared NB-CQDs displayed bright yellow-green emission, excellent stability in aqueous solution with high ionic strength and good biocompatibility. We found that the NB-CQDs could be employed to detect Cr2O72− in aqueous solution owing to the Cr2O72−-caused fluorescence quenching. In the sensing system, as low as 0.5 μM Cr2O72− could be successfully detected and a good linear relationship in the range of 0–250 μM has been obtained. And the NB-CQDs could be also used as ink for writing on different paper, revealing the NB-CQDs can be applied for anti-counterfeiting. Moreover, the NB-CQDs exhibited negligible cytotoxicity and good biocompatibility, which is favorable for bioimaging applications. And the NB-CQDs were successfully applied for fluorescence imaging in HeLa cells (Fig. 1).
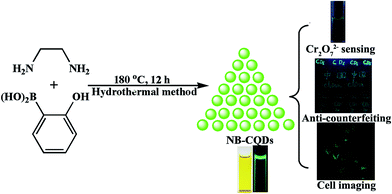 | ||
| Fig. 1 Schematic illustration for the synthesis of NB-CQDs and the applications of NB-CQDs for sensing Cr2O72−, anti-counterfeiting and cell imaging. | ||
2. Experimental section
2.1 Materials
Ethylenediamine (EDA) was bought from Energy Chemical Company (Shanghai, China). 2-Hydroxyphenylboronic acid (2-HPBA), polyvinyl alcohol (PVA) and K2Cr2O7 were obtained from Aladdin Industrial Inc. (Shanghai, China). Other reagents were all of analytical reagent grade and used as received without further purification. Double-distilled water was used during the experiment.2.2 Characterization
The excitation and emission spectra of NB-CQDs were recorded on a Cary Eclipse luminescence spectrometer (Varian, USA). Ultraviolet-visible (UV-vis) absorption spectra were measured at room temperature on a Lambda 650S UV-vis spectrometer (PerkinElmer, USA). Fourier transform-infrared (FT-IR) spectra were obtained using a Nicolet 5700 FT-IR spectrometer (Thermo-Electron Corp., USA) with the KBr pellet technique in the range of 400–4000 cm−1. X-ray photoelectron spectroscope (XPS) spectra were carried on an X-ray photoelectron spectrometer (ESCALAB 250Xi, Thermo Scientific). Transmission electron microscopy (TEM) images were performed on a JEM-2100 transmission electron microscope operated at an acceleration voltage of 200 kV. Fluorescence lifetime and quantum yield were measured using a FLS 980 spectrofluorimeter (Edinburgh Instrument, UK). Photostability tests were conducted at room temperature using the light of 365 nm from an ultraviolet lamp (16W, CBIO-UV3A, Beijing CBIO Bioscience Technology Co. Ltd., Beijing, China). And photographs were gained using a Canon 700D digital camera.2.3 Synthesis of NB-CQDs
In a typical procedure, 2-HPBA (about 71 mg) was dissolved in water (10 mL). EDA (70 mL) was then added into the above solution and stirred for about 10 min. The mixture was sealed and heated at 180 °C for about 12 hours (h). After cooling to room temperature, a yellow solution was obtained and dialyzed in a cellulose ester dialysis membrane with a molecular weight cut-off of 500 Da against distilled water at room temperature for about 12 h. Finally, a clean and light yellow solution containing NB-CQDs was gained and stored at 4 °C. The concentration of NB-CQDs is about 0.5 mg mL−1 by estimating the weight of dried NB-CQDs.2.4 Detection of Cr2O72− with NB-CQDs
For the detection of Cr2O72−, 750 μL phosphate buffer (0.2 M, pH 8.0), NB-CQDs solution (200 μL) and different concentration of K2Cr2O7 were mixed together. And water was added into the mixture to keep the total volume of 3.0 mL. After incubation for about 10 min at room temperature, the fluorescence intensity of NB-CQDs was recorded on the fluorescence spectrometer.2.5 Detection of Cr2O72− in tap water with NB-CQDs
Tap water and lake water were collected in our laboratory and our campus. The real water samples were filtered through a 0.22 μm filter to remove any suspended particles in water. 60 μL tap water, different concentration of K2Cr2O7 and 750 μL phosphate buffer were mixed together. Then NB-CQDs (200 μL) were added into the mixture and water was used to dilute the above mixture to final volume of 3.0 mL. After incubation for about 10 min at room temperature, the fluorescence signal of NB-CQDs was recorded with the fluorescence spectrometer.2.6 Preparation of NB-CQDs/PVA film
10 mL polyvinyl alcohol (PVA, 5% wt) aqueous solution was first prepared. And 0.5 mL NB-CQDs solution was added the PVA solution under magnetic stirring. The mixture was then poured into a plastic Petri dish and dried in an oven with 60 °C. The film was peeled off from the Petri dish.2.7 Cell viability assay of NB-CQDs
HeLa cells were maintained in Dulbecco's modified Eagles Medium (DMEM) supplemented with 10% fetal bovine serum and 1% penicillin-streptomycin at 37 °C in a humidified atmosphere 5% CO2. To determine the cytotoxicity, cells were plated in triplicate at a density of 104 cells per well in 96-well microplates. After incubation for 12 h, the NB-CQDs ranging from 5 to 250 μg mL−1 were added into the cells, and further cultured for about 24 h. The viability of HeLa cells in the culture environment of NB-CQDs was then analyzed using 3-(4,5-dimethyl-2-thiazolyl)-2,5-diphenyl-2-H-tetrazolium bromide (MTT) cytotoxicity assays.2.8 Cell imaging with NB-CQDs
HeLa cells were seeded in 35 mm glass-bottomed dishes at a density of 3 × 10⁵ cells per dish in standard culture media. After overnight culture, cells were treated with 100 μg mL−1 NB-CQDs for about 20 min, and then fluorescence images were acquired by confocal microscopy (Leica SP8 Confocal Laser Scanning Microscope). The cells were excited at 405 nm with a laser and the emission was collected between 500 and 550 nm.3. Results and discussions
3.1 Synthesis of NB-CQDs
The NB-CQDs was synthesized from the hydrothermal treatment of 2-HBPA and EDA at 180 °C for about 12 h (Fig. 1). We first studied the effect of the ratio of 2-HBPA and EDA on the fluorescence properties of NB-CQDs. The NB-CQDs prepared from 2-HPBA and EDA with 1![[thin space (1/6-em)]](https://www.rsc.org/images/entities/char_2009.gif) :
:![[thin space (1/6-em)]](https://www.rsc.org/images/entities/char_2009.gif) 1, 2
1, 2![[thin space (1/6-em)]](https://www.rsc.org/images/entities/char_2009.gif) :
:![[thin space (1/6-em)]](https://www.rsc.org/images/entities/char_2009.gif) 1 and 1
1 and 1![[thin space (1/6-em)]](https://www.rsc.org/images/entities/char_2009.gif) :
:![[thin space (1/6-em)]](https://www.rsc.org/images/entities/char_2009.gif) 2 exhibited similar fluorescence properties. These NB-CQDs showed the maximum excitation wavelength at 410 nm and the maximum emission wavelength centered at 515 nm. And their corresponding UV-vis absorption spectra were also similar. The maximum absorption wavelength was located at 410 nm (Fig. S1–S3†). To obtain the best NB-CQDs prepared from the suitable ratio of 2-HBPA and EDA, I515/A410 was employed to compare their fluorescence properties, where I515 was the fluorescence intensity of NB-CQDs at the maximum emission wavelength of 515 nm, A410 was the absorbance of NB-CQDs at 410 nm. The A410 standed for the concentration of NB-CQDs, because the concentration of NB-CQDs is directly proportional to the A410 based on the Beer's law. The greater I515/A410 showed the stronger fluorescence intensity of NB-CQDs. As shown in Fig. S4,† we could see that the I515/A410 of the NB-CQDs prepared from 2-HBPA and EDA with the ratio of 1
2 exhibited similar fluorescence properties. These NB-CQDs showed the maximum excitation wavelength at 410 nm and the maximum emission wavelength centered at 515 nm. And their corresponding UV-vis absorption spectra were also similar. The maximum absorption wavelength was located at 410 nm (Fig. S1–S3†). To obtain the best NB-CQDs prepared from the suitable ratio of 2-HBPA and EDA, I515/A410 was employed to compare their fluorescence properties, where I515 was the fluorescence intensity of NB-CQDs at the maximum emission wavelength of 515 nm, A410 was the absorbance of NB-CQDs at 410 nm. The A410 standed for the concentration of NB-CQDs, because the concentration of NB-CQDs is directly proportional to the A410 based on the Beer's law. The greater I515/A410 showed the stronger fluorescence intensity of NB-CQDs. As shown in Fig. S4,† we could see that the I515/A410 of the NB-CQDs prepared from 2-HBPA and EDA with the ratio of 1![[thin space (1/6-em)]](https://www.rsc.org/images/entities/char_2009.gif) :
:![[thin space (1/6-em)]](https://www.rsc.org/images/entities/char_2009.gif) 2 was the largest. Moreover, the CQDs from 2-HBPA or EDA were also prepared under the same condition. The CQDs from 2-HBPA showed the maximum excitation wavelength at about 290 nm and the maximum emission wavelength at 400 nm, indicating that the CQDs from 2-HBPA exhibited blue emission. And there is no obvious absorption peak at 410 nm in the UV-vis absorption spectrum (Fig. S5†). For the CQDs from EDA, the maximum excitation wavelength at about 320 nm and the maximum emission wavelength at 390 nm were observed, revealing that the CQDs from EDA showed violet emission (Fig. S6†). The observations were much different from the NB-CQDs from 2-HBPA and EDA. Therefore, we chose the ratio of 2-HBPA and EDA with 1
2 was the largest. Moreover, the CQDs from 2-HBPA or EDA were also prepared under the same condition. The CQDs from 2-HBPA showed the maximum excitation wavelength at about 290 nm and the maximum emission wavelength at 400 nm, indicating that the CQDs from 2-HBPA exhibited blue emission. And there is no obvious absorption peak at 410 nm in the UV-vis absorption spectrum (Fig. S5†). For the CQDs from EDA, the maximum excitation wavelength at about 320 nm and the maximum emission wavelength at 390 nm were observed, revealing that the CQDs from EDA showed violet emission (Fig. S6†). The observations were much different from the NB-CQDs from 2-HBPA and EDA. Therefore, we chose the ratio of 2-HBPA and EDA with 1![[thin space (1/6-em)]](https://www.rsc.org/images/entities/char_2009.gif) :
:![[thin space (1/6-em)]](https://www.rsc.org/images/entities/char_2009.gif) 2 for the synthesis of NB-CQDs.
2 for the synthesis of NB-CQDs.
3.2 Optical properties of NB-CQDs
The native NB-CQDs solution showed yellow in visible light. However, bright yellow-green fluorescence was observed under a 365 nm UV light (Fig. 2A), indicating the formation of NB-CQDs. The NB-CQDs were purified through dialysis. The purified NB-CQDs showed three peaks centered at about 225 nm, 270 nm and 410 nm in the excitation spectrum (Fig. 2A). The excitation spectrum of NB-CQDs was similar with the UV-vis absorption spectrum (Fig. S7†). We then studied the fluorescence emission behavior of NB-CQDs at different excitation wavelengths. The NB-CQDs exhibited dual emission behavior when the excitation wavelength was in the range of 300–350 nm. The two maximum emission wavelengths were 400 nm and 515 nm, respectively. When the excitation wavelength shifted longer wavelength, the NB-CQDs showed single emission behavior and the emission peak was located at about 515 nm. Surprisingly, the NB-CQDs exhibited excitation-independent emission behavior, and the maximum emission wavelength was about 515 nm. When the excitation wavelength was about 410 nm, the fluorescent intensity of NB-CQDs at 515 nm was the largest (Fig. 2B). We thus selected 410 nm as the maximum excitation wavelength in the following experiments. Moreover, the absolute quantum yield of the NB-CQDs was measured to be about 6.59%.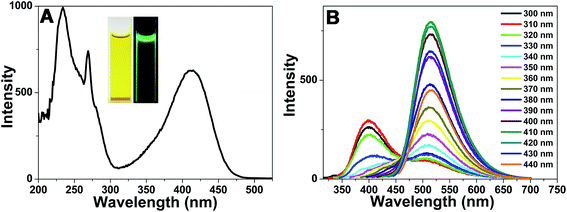 | ||
| Fig. 2 (A) Excitation spectrum of NB-CQDs, inset: photographs of the native NB-CQDs in visible light and 365 nm UV light. (B) Emission spectra of NB-CQDs at different excitation wavelengths. | ||
3.3 Characterization of NB-CQDs
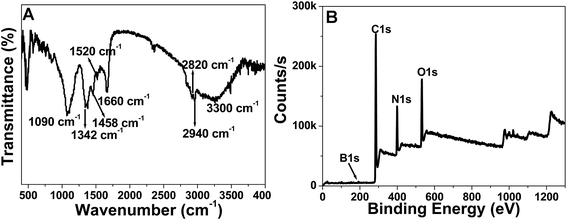
We tried to characterize the surface structure and composition of the NB-CQDs with different methods. In the FT-IR spectrum of the NB-CQDs, the peak at about 3300 cm−1 could be attributed to the stretching vibration of O–H or N–H groups.15 The peaks at 2940 cm−1 and 2820 cm−1 were assigned to the stretching and bending vibrations of C–H groups.15 The peak at 1660 cm−1 resulted from the stretching vibration of C![[double bond, length as m-dash]](https://www.rsc.org/images/entities/char_e001.gif) O groups.15 The bending vibrations of N–H groups could be observed at 1520 cm−1. The weak peak at about 1458 cm−1 could be attributed to the stretching vibration of C–N groups.15 And the sharp peaks at about 1343 cm−1 and 1090 cm−1 could be assigned to the stretching vibrations B–O and C–B groups (Fig. 3A).16 The surface composition and elemental analysis for the NB-CQDs were characterized by XPS. The XPS survey spectrum of the NB-CQDs revealed four peaks at about 190.8, 284.6, 398.8, and 531.0 eV, which were ascribed to B 1s, C 1s, N 1s and O 1s, respectively (Fig. 3B). In the high resolution C 1s spectrum, the C 1s peaks at 283.8, 284.5, 285.3, 287.6 and 290.2 eV could be assigned to carbon in the form of C–B, C–C/C
O groups.15 The bending vibrations of N–H groups could be observed at 1520 cm−1. The weak peak at about 1458 cm−1 could be attributed to the stretching vibration of C–N groups.15 And the sharp peaks at about 1343 cm−1 and 1090 cm−1 could be assigned to the stretching vibrations B–O and C–B groups (Fig. 3A).16 The surface composition and elemental analysis for the NB-CQDs were characterized by XPS. The XPS survey spectrum of the NB-CQDs revealed four peaks at about 190.8, 284.6, 398.8, and 531.0 eV, which were ascribed to B 1s, C 1s, N 1s and O 1s, respectively (Fig. 3B). In the high resolution C 1s spectrum, the C 1s peaks at 283.8, 284.5, 285.3, 287.6 and 290.2 eV could be assigned to carbon in the form of C–B, C–C/C![[double bond, length as m-dash]](https://www.rsc.org/images/entities/char_e001.gif) C, C–O/C–N, C
C, C–O/C–N, C![[double bond, length as m-dash]](https://www.rsc.org/images/entities/char_e001.gif) O and O–C
O and O–C![[double bond, length as m-dash]](https://www.rsc.org/images/entities/char_e001.gif) O, respectively (Fig. S8A†).15–17 The N 1s peaks at 398.5, 399.7 and 401.5 eV showed that nitrogen existed mostly in the form of N–B, N–C and N–H, respectively (Fig. S8B†).18,19 The O 1s spectrum could be deconvoluted into two peaks at 530.5 and 531.8 eV, which were corresponding to C
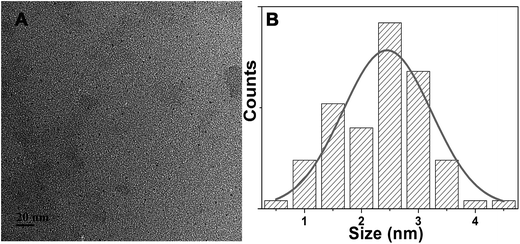
O, respectively (Fig. S8A†).15–17 The N 1s peaks at 398.5, 399.7 and 401.5 eV showed that nitrogen existed mostly in the form of N–B, N–C and N–H, respectively (Fig. S8B†).18,19 The O 1s spectrum could be deconvoluted into two peaks at 530.5 and 531.8 eV, which were corresponding to C![[double bond, length as m-dash]](https://www.rsc.org/images/entities/char_e001.gif) O and C–OH/C–O–C, respectively (Fig. S8C†).15 And the B 1s spectrum could be separated into two peaks at 191.1 and 191.8 eV, indicating that the presence of B–N and B–C (Fig. S8D†).16,18 These results were corresponding to the FT-IR results. And the above results also verified the as-prepared CQDs were nitrogen and boron-doped CQDs. The morphology and particle size of NB-CQDs were investigated by TEM. The NB-CQDs were well-dispersed and nearly spherical, and the diameter was about 2.32 nm in average (Fig. 4).
O and C–OH/C–O–C, respectively (Fig. S8C†).15 And the B 1s spectrum could be separated into two peaks at 191.1 and 191.8 eV, indicating that the presence of B–N and B–C (Fig. S8D†).16,18 These results were corresponding to the FT-IR results. And the above results also verified the as-prepared CQDs were nitrogen and boron-doped CQDs. The morphology and particle size of NB-CQDs were investigated by TEM. The NB-CQDs were well-dispersed and nearly spherical, and the diameter was about 2.32 nm in average (Fig. 4).
3.4 Stability of NB-CQDs
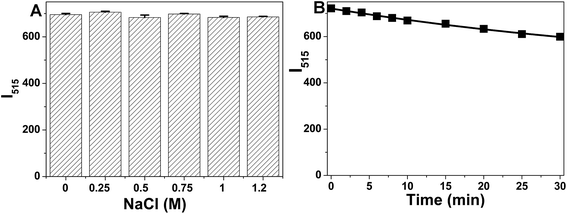
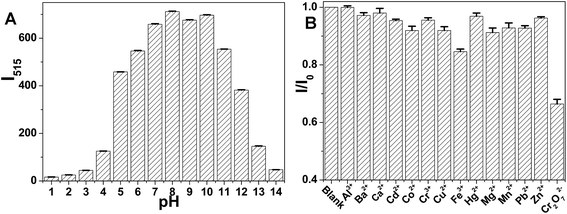
The stability of NB-CQDs is of great importance for the wide applications of NB-CQDs. We first studied the effect of ionic strength on the fluorescent intensity of NB-CQDs in the presence of different concentrations of NaCl. When the concentration of NaCl was as high as 1.2 M, the fluorescent intensity of NB-CQDs was little affected, revealing the excellent stability of the NB-CQDs in high-salt conditions (Fig. 5A). The photostability of NB-CQDs was also tested through the continuous irradiation of 365 nm UV light. The fluorescent intensity decreased slightly with the increase of irradiation time, and only 17% decrease in fluorescent intensity was observed after continuous irradiation for 30 min (Fig. 5B). The influence of scanning times on the fluorescent intensity was also investigated. The fluorescent intensity of NB-CQDs remained unchanged after scanning for 30 times (Fig. S9†). We also studied the temperature effect on the fluorescent intensity of NB-CQDs. Surprisingly, we noticed that the increase in temperature could result in a red shift of the fluorescence emission spectrum and a slight reduction in fluorescence intensity (Fig. S10†), revealing that the NB-CQDs may be constructed into nano-thermometers. These results revealed that the good stability of NB-CQDs. Moreover, the pH effect on the fluorescent intensity of NB-CQDs was also measured. The pH of the solution exhibited great influence on the fluorescent intensity of NB-CQDs. In the pH range of 1–8, the fluorescence intensity increased with the increase in the pH value, and the fluorescence intensity was the highest at pH 8. Further increase of the pH value could result in a gradual decrease in fluorescence intensity (Fig. 6A). The pH-responsive properties showed NB-CQDs the potential application in pH sensing. We thus chose pH 8.0 for the following experiments.3.5 Effect of metal ions on the fluorescence intensity of NB-CQDs
Due to the presence of rich functional groups on the surface of NB-CQDs, metal ions may greatly affect the fluorescence intensity of the NB-CQDs. For the test, 14 metal ions, including Al3+, Ba2+, Ca2+, Cd2+, Co2+, Cr3+, Cu2+, Fe3+, Hg2+, Mg2+, Mn2+, Pb2+, Zn2+, and Cr2O72−, were chosen to study the influence on the fluorescence intensity of the NB-CQDs at 515 nm. Their concentrations were 200.0 μM. As shown in Fig. 6B, only Cr2O72− could cause the significant decrease of the fluorescence intensity, and other metal ions showed slight impact on the fluorescence intensity of NB-CQDs. The results demonstrated that the as-prepared NB-CQDs could be utilized for sensing Cr2O72− in aqueous solution.3.6 Detection of Cr2O72− with NB-CQDs
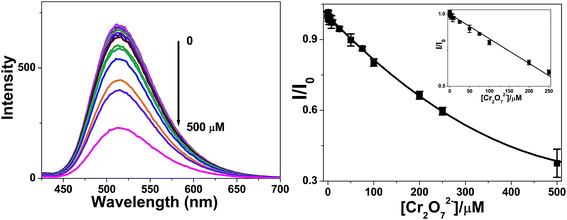
Cr(VI) is highly toxic and carcinogenic to humans, and cause different disorders and severe environmental problems.20 It is thus essential to develop a new method for selectively determination trace levels of Cr(VI). Cr2O72− is the dominant form of Cr(VI) in nature. Thus, the detection of Cr2O72− is of great importance. The fluorescent detection of Cr2O72− could be realized by using NB-CQDs. Different concentration of Cr2O72− was added into the NB-CQDs solution, and the corresponding fluorescent spectra were recorded. With the increase of Cr2O72− concentration, the fluorescence intensity of NB-CQDs continuously decreased. And the shape and position of the fluorescence spectra did not changed obviously (Fig. 7A). A plot about the fluorescence intensity ratio (I/I0) against Cr2O72− was obtained. Notably, a good linearity (R = 0.995) between I/I0 and the concentration of Cr2O72− in the range of 0–250 μM was established, revealing that the as-prepared NB-CQDs have the potential to detect Cr2O72− in aqueous solution (Fig. 7B). Moreover, the lowest detection concentration of Cr2O72− was 0.5 μM, which was not comparable to that of the reported nanosensors for Cr2O72− (Table S1†).20–24 However, the value was much below the allowed lowest concentration in drinking water set by the US Environmental Protection Agency.21,22 Most importantly, the linear range is much wider than those reported results (Table S1†), revealing that the NB-CQDs have the potential to detect Cr2O72− in some practical samples.3.7 Practical application of NB-CQDs for the detection of Cr2O72− in real water samples
The applicability of the NB-CQDs-based fluorescent sensor was validated by the detection of Cr2O72− in tap water and lake water. The real water samples were diluted to 50 times. The analysis results were shown in Table S2.† Cr2O72− was not determined in tap water and lake water, indicating that there was no Cr2O72− or the Cr2O72− concentration in the two real water samples was lower than the lowest detection concentration of NB-CQDs. Then, different concentration of Cr2O72− was added into the NB-CQDs solution and the corresponding fluorescent intensity was recorded. Compared with the initial addition of Cr2O72−, the final recoveries were determined between 102.0% and 113.4%, revealing that the NB-CQDs could be applied to detect Cr2O72− in some real water samples.3.8 Detection mechanism of Cr2O72− with NB-CQDs
The fluorescence quenching mechanism of NB-CQDs against Cr2O72− is still a matter of current debate and requires further elucidation. The UV-vis absorption spectra were first utilized to elaborate the fluorescence quenching mechanism of NB-CQDs. As indicated in Fig. S11,† the maximum absorption spectrum of K2Cr2O7 partially overlapped with the excitation spectrum of NB-CQDs, suggesting that the Cr2O72−-caused fluorescence quenching of NB-CQDs was ascribed to the inner filter effect.19 Moreover, the addition of NB-CQDs could enhance the absorbance of K2Cr2O7 at 370 nm. And the addition of K2Cr2O7 could change the absorption spectrum of NB-CQDs, demonstrating that the fluorescence quenching mechanism was static quenching mechanism (Fig. S12†).25,26 And the fluorescence lifetime test can be utilized to reveal the fluorescence quenching mechanism because the static quenching process is related to the unchanged fluorescence lifetime of NB-CQDs.25,26 The lifetime of NB-CQDs was about 3.3581 ns. However, in the presence of 100 and 500 μM, the lifetime of NB-CQDs was 3.3857 ns and 3.3708 ns, respectively (Fig. S13†). The altered lifetime indicated the fluorescence quenching mechanism of NB-CQDs by Cr2O72− was dynamic quenching.25 These results could effectively confirm the inner filter effect contributed the fluorescence quenching of NB-CQDs. And static and dynamic quenching also caused the fluorescence quenching mechanism.3.9 Anti-counterfeiting of NB-CQDs
We further investigated the application of NB-CQDs for anti-counterfeiting. We first found that the NB-CQDs could be used as ink for writing letters, number and Chinese characters Xuan Paper and weighing paper. With the decrease of the concentration of NB-CQDs, these letters, number and Chinese characters gradually changed from light yellow to colorless under visible light. However, upon the irradiation of 365 nm UV light, they were clearly observed with blue color (Fig. 8). And the blue fluorescence still retained after three months, revealing that the NB-CQDs could be utilized for anti-counterfeiting. The NB-CQDs could be mixed with PVA solution to fabricate NB-CQDs/PVA film, which was transparent and exhibited light yellow under visible light. However, the film showed blue emission in 365 nm UV light (Fig. S14†). In the excitation spectrum of NB-CQDs/PVA film, the maximum excitation wavelength was located at about 420 nm, which showed a weak red shift when compared with the NB-CQDs in solution (Fig. S15A†). And the emission spectra of NB-CQDs/PVA film excited with different wavelengths were shown in Fig. S15B.† The NB-CQDs/PVA film displayed wavelength-independent emission and the maximum fluorescence emission at about 450 nm with excitation wavelength of 420 nm. Surprisingly, the maximum fluorescence emission wavelength exhibited a large blue shift when compared with NB-CQDs in aqueous solution, which may be attributed to the alteration of average NB-CQDs⋯NB-CQDs distance.27,28 The compactness of the NB-CQDs/PVA film induced the interaction between these NB-CQDs, thus increasing the average NB-CQDs⋯NB-CQDs distance, resulting into the blue shift in the fluorescence emission.28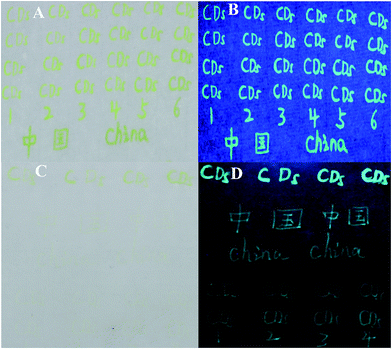 | ||
| Fig. 8 Handwritten letters, number and Chinese characters using NB-CQDs as ink on Xuan paper (A and B) and weighing paper (C and D) under visible light (A and C) and 365 nm UV light (B and D). | ||
3.10 Cell imaging with NB-CQDs
In order to evaluate the cytotoxicity of the as-prepared NB-CQDs, MTT assays were carried out.19,29,30 Therefore, HeLa cells were selected as representative cell lines to incubate with NB-CQDs at different concentrations for 24 h. As shown in Fig. 9A, the cell viability decreased by 17% when the concentration of N-CQDs reached up to 100 μg mL−1. These results clearly revealed that the as-synthesized NB-CQDs showed low cytotoxicity to living cells when compared with those semiconductor QDs.31 The good water solubility and low cytotoxicity of the NB-CQDs could be applied for cell imaging with confocal microscopy. And HeLa cells were incubated with NB-CQDs (100 μg mL−1) for 20 min at 37 °C. As shown in Fig. 9B and C, a bright blue-green fluorescence was observed inside the cells, indicating that the NB-CQDs were quickly internalized by the HeLa cells. The above results suggested that the NB-CQDs exhibited good biocompatibility, low cell cytotoxicity, and could be used for cell imaging.4. Conclusions
In summary, we have presented a method for the synthesis of NB-CQDs through the hydrothermal method using 2-HPBA and EDA in aqueous solution. The as-prepared NB-CQDs exhibited bright yellow-green emission, excellent stability in aqueous solution with high ionic strength and good biocompatibility. The NB-CQDs could be utilized to sense Cr2O72− in aqueous solution due to the Cr2O72−-induced fluorescence quenching. In the sensing system, as low as 0.5 μM Cr2O72− can be successfully detected and a good linear relationship in the range of 0–250 μM has been obtained. And the NB-CQDs can be also used as ink for writing on different paper, revealing the NB-CQDs can be applied for anti-counterfeiting. Moreover, the NB-CQDs exhibited low cytotoxicity and good biocompatibility, which is favorable for bioimaging applications. And the NB-CQDs were successfully applied for fluorescence imaging in HeLa cells. Therefore, the NB-CQDs exhibit great potential applications in various fields.Conflicts of interest
There are no conflicts to declare.Acknowledgements
The work was financially supported by the National Natural Science Foundation of China (21401113, 21575032), the Natural Science Foundation of Henan Department of Science & Technology (172102310668), the Natural Science Foundation of Nanyang Normal University (ZX2014043), scientific research and service platform fund of Henan Province (2016151); the fund scientific and technological innovation team of water ecological security for Water Source Region of Mid-line of South-to-North Diversion Project of Henan Province (17454), the Fundamental Research Funds for the Central Universities (PYBZ1707, buctrc201607), and Open Ground from State Key Laboratory of Chemo/Biosensing and Chemometrics Hunan University.Notes and references
- L. Yan, Y. Zhang, B. Xu and W. Tian, Nanoscale, 2016, 8, 2471–2487 RSC.
- A.-J. Wang, H. Li, H. Huang, Z.-S. Qian and J.-J. Feng, J. Mater. Chem. C, 2016, 4, 8146–8160 RSC.
- Y. Guo, F. Cao, X. Lei, L. Mang, S. Cheng and J. Song, Nanoscale, 2016, 8, 4852–4863 RSC.
- Y. Guo, L. Zhang, S. Zhang, Y. Yang, X. Chen and M. Zhang, Biosens. Bioelectron., 2015, 63, 61–71 CrossRef CAS PubMed.
- S. M. Ng, M. Koneswaran and R. Narayanaswamy, RSC Adv., 2016, 6, 21624–21661 RSC.
- H.-B. Wang, Y. Chen, Y. Li, H.-D. Zhang and J.-T. Cao, RSC Adv., 2015, 5, 94099–94104 RSC.
- H. Yu, R. Shi, Y. Zhao, G. I. N. Waterhouse, L.-Z. Wu, C.-H. Tung and T. Zhang, Adv. Mater., 2016, 28, 9454 CrossRef CAS PubMed.
- Z. Zhang, T. Zheng, X. Li, J. Xu and H. Zeng, Part. Part. Syst. Charact., 2016, 33, 457–472 CrossRef.
- Q. Zhang, C.-F. Wang, L.-T. Ling and S. Chen, J. Mater. Chem. C, 2014, 2, 4358–4373 RSC.
- Y. H. Yuan, Z. X. Liu, R. S. Li, H. Y. Zou, M. Lin, H. Liu and C. Z. Huang, Nanoscale, 2016, 8, 6770–6776 RSC.
- Z. Ma, H. Ming, H. Huang, Y. Liu and Z. Kang, New J. Chem., 2012, 36, 861–864 RSC.
- S. Lu, S. Guo, P. Xu, X. Li, Y. Zhao, W. Gu and M. Xue, Int. J. Nanomed., 2016, 11, 6325–6336 CrossRef PubMed.
- A. B. Bourlinos, A. Bakandritsos, A. Kouloumpis, D. Gournis, M. Krysmann, E. P. Giannelis, K. Polakova, K. Safarova, K. Hola and R. Zboril, J. Mater. Chem., 2012, 22, 23327–23330 RSC.
- Y. Guo, F. Cao and Y. Li, Sens. Actuators, B, 2017 DOI:10.1016/j.snb.2017.1008.1104.
- J. Liu, J. Li, L. Xu, Y. Qiao and J. Chen, Ind. Eng. Chem. Res., 2017, 56, 3905–3912 CrossRef CAS.
- P. Shen and Y. Xia, Anal. Chem., 2014, 86, 5323–5329 CrossRef CAS PubMed.
- G. Caballero-Manrique, E. Brillas, F. Centellas, J. A. Garrido, R. M. Rodriguez and P.-L. Cabot, Catalysts, 2015, 5, 815–837 CrossRef CAS.
- D. He, W. Cheng, J. Qin, J. Yue, E. Xie and G. Chen, Appl. Surf. Sci., 2002, 191, 338–343 CrossRef CAS.
- G. Li, H. Fu, X. Chen, P. Gong, G. Chen, L. Xia, H. Wang, J. You and Y. Wu, Anal. Chem., 2016, 88, 2720–2726 CrossRef CAS PubMed.
- X. Liu, T. Li, Q. Wu, X. Yan, C. Wu, X. Chen and G. Zhang, Talanta, 2017, 165, 216–222 CrossRef CAS PubMed.
- W. Chen, F. Cao, W. Zheng, Y. Tian, Y. Xianyu, P. Xu, W. Zhang, Z. Wang, K. Deng and X. Jiang, Nanoscale, 2015, 7, 2042–2049 RSC.
- C. Dong, G. Wu, Z. Wang, W. Ren, Y. Zhang, Z. Shen, T. Li and A. Wu, Dalton Trans., 2016, 45, 8347–8354 RSC.
- M. Cui, G. Song, C. Wang and Q. Song, Microchim. Acta, 2015, 182, 1371–1377 CrossRef CAS.
- L. Zhu, X. Peng, H. Li, Y. Zhang and S. Yao, Sens. Actuators, B, 2017, 238, 196–203 CrossRef CAS.
- Y. Guo, L. Zhang, F. Cao and Y. Leng, Sci. Rep., 2016, 6, 35795 CrossRef CAS PubMed.
- Y. Guo, L. Zhang, F. Cao, L. Mang, X. Lei, S. Cheng and J. Song, Anal. Methods, 2016, 8, 2723–2728 RSC.
- Q. Benito, X. F. Le Goff, S. Maron, A. Fargues, A. Garcia, C. Martineau, F. Taulelle, S. Kahlal, T. Gacoin, J.-P. Boilot and S. Perruchas, J. Am. Chem. Soc., 2014, 136, 11311–11320 CrossRef CAS PubMed.
- Z. Wu, J. Liu, Y. Gao, H. Liu, T. Li, H. Zou, Z. Wang, K. Zhang, Y. Wang, H. Zhang and B. Yang, J. Am. Chem. Soc., 2015, 137, 12906–12913 CrossRef CAS PubMed.
- S. Zhu, Q. Meng, L. Wang, J. Zhang, Y. Song, H. Jin, K. Zhang, H. Sun, H. Wang and B. Yang, Angew. Chem., Int. Ed., 2013, 52, 3953–3957 CrossRef CAS PubMed.
- R. Atchudan, T. N. J. I. Edison and Y. R. Lee, J. Colloid Interface Sci., 2016, 482, 8–18 CrossRef CAS PubMed.
- S. Ghaderi, B. Ramesh and A. M. Seifalian, J. Drug Targeting, 2011, 19, 475–486 CrossRef CAS PubMed.
Footnote |
| † Electronic supplementary information (ESI) available. See DOI: 10.1039/c7ra09785a |
| This journal is © The Royal Society of Chemistry 2017 |

