 Open Access Article
Corona discharge-induced reduction of quinones in negative electrospray ionization mass spectrometry†
Jiying Pei ab,
Cheng-Chih Hsu
 c,
Yinghui Wang*ab and
Kefu Yu*ab
aSchool of Marine Sciences, Guangxi University, Nanning, 53004, P. R. China. E-mail: wyh@gxu.edu.cn; kefuyu@scsio.ac.cn
bCoral Reef Research Center of China, Nanning, 53004, P. R. China
cDepartment of Chemistry, National Taiwan University, Taipei 10617, Taiwan
First published on 8th September 2017
Abstract
Quinones, including 2,6-dichloro-1,4-benzoquinone (DCBQ), 1,4-benzoquinone (BQ), methyl-p-benzoquinone (MBQ), 1,4-naphthoquinone (1,4-NQ), 1,2-naphthoquinone (1,2-NQ), and 1,4-anthraquinone (AQ), generate M˙− and [M + H]− anions, rather than deprotonated molecules, in negative electrospray ionization mass spectrometry (ESI MS), meaning a reduction occurs during the electrospray process. The ratio of the signal intensities of M˙− and [M + H]− changed with the adjustment of experimental parameters. To gain more insight into the mechanism of quinone reduction, we explored the effect of experimental factors that are influential to corona discharge (CD). The results showed that a severe CD, such as high spray voltage, using water as spray solvent, no use of sheath gas, metal spray emitter, and slow flow rate of electrospray, facilitated the production of M˙− ions while suppressing the production of [M + H]− ions. Therefore, a conclusion can be drawn that the reduction of quinones is closely related to CD. Moreover, the generation of M˙− and [M + H]− is related to the quinone structure. Quinones with higher reduction potentials are more readily reduced to the [M + H]− form.
1. Introduction
The quinone/quinol couple is a well-defined reversible redox pair for electrochemistry investigations.1 However, phenol oxidation or quinone reduction is also generally observed in various mass spectrometry (MS) ionization sources. 1,4-Hydroquinone and several other phenolic compounds generated [M − 2]˙− radical-anions under certain negative-ion mass spectrometric conditions with atmospheric pressure chemical ionization (APCI), helium-plasma ionization (HePI) and electrospray ionization (ESI) sources.2 Superoxide radical-anions (O2˙−), known to be present in many atmospheric-pressure plasma ion sources, were thought to play a critical role in the oxidative ionization process. Quinones, including 1,4-naphthoquinone (1,4-NQ), 1,2-naphthoquinone (1,2-NQ), and 5-hydroxy-1,4-naphthaquinone, were also found to experience reduction during positive electron impact (EI),3,4 fast atom bombardment (FAB),5 and secondary ion mass spectroscopy (SIMS),6 as well as negative FAB5 and desorption electrospray ionization (DESI).7 [M + 2H]˙+ and [M + 3H]+ cations were generated in positive ion mode while M˙− and [M + H]− anions were generated in negative ion mode. Electrons released by the metal substrates and protons contained in the solid matrix were supposed to be collaboratively involved in quinone reduction in SIMS, and the plasma produced by corona discharge (CD) in the gas phase was thought to be responsible for quinone reduction in negative mode DESI MS.Qin et al. observed the generation of [M + H]− ions of 2,6-dichloro-1,4-benzoquinone (DCBQ) in negative mode ESI MS, based on which they have identified DCBQ as a new disinfection by-product in drinking water.8 The authors attributed the reduction to electrochemical reduction occurring at the spraying tip. However, in-depth evidence was still absent. An ESI source can be viewed as a controlled-current electrolytic cell, in which oxidation reaction occurs in the positive mode and reduction reaction occurs in the negative mode.9,10 In addition, CD occurring during ESI, especially in negative ion mode,11 can also result in analytes redox through producing plasmas containing abundant H2O2, O3 and ˙OH.12,13 Recently, we have observed unexpected reduction of iminoquinone and quinone derivatives in positive ESI MS, and illustrated that the reduction was related with CD by adjusting experimental parameters that were influential to CD.14 Though CD ionization was specially designed as a new kind of ionization source, [M + H]+ ions were generally generated in positive ion mode and [M − H]− ions were generated in negative ion mode.2,11,15,16
In this study, we continued the investigation of the reduction of quinones (DCBQ, 1,4-benzoquinone (BQ), methyl-p-benzoquinone (MBQ), 1,4-NQ, 1,2-NQ, and 1,4-anthraquinone (AQ)) in negative ESI MS, and explored the possible mechanism for that phenomenon. By adjusting experimental parameters of spray voltage, solvent composition, sheath gas, spray emitter material, and flow rate of electrospray, it illustrated that the reduction of these quinones in negative ESI MS was closely related with CD in the gas phase. Knowing the mechanism of quinone reduction is beneficial to efficient qualitative and quantitative analysis of quinonoid compounds in various complex matrixes, such as the analysis of DCBQ in drinking water.
2. Experimental
2.1. Materials and reagents
HPLC grade methanol (CH3OH) was purchased from Honeywell Burdick & Jackson Inc. (Muskegon, MI, U.S.A.). BQ, MBQ, 1,4-NQ, 1,2-NQ, AQ, DCBQ, and reserpine were obtained from Sigma-Aldrich Chemical Co. Ltd. (St. Louis, MO, U.S.A.). Ammonium acetate (NH4Ac) was obtained from Sinopharm Chemical Reagent Co. Ltd. (Beijing, China). All these reagents were used without any further purification. Distilled water (18.2 MΩ) was produced by Milli-Q system (Millipore Inc., Bedford, MA, U.S.A.).2.2. ESI setup
The home-built ESI setup is shown in Fig. S1.† Spray voltage was applied on the syringe needle, and the solution was electrosprayed from an approximate 50 cm-long fused silica capillary (100 μm-i.d., 365 μm-o.d.). To achieve stable spray with the home-built ESI source, the top 5 mm of the fused silica capillary was etched with the method introduced by Kelly.17 Sheath gas was applied through a T-junction. Unless otherwise stated, the home-made ESI source was used throughout. When investigating the effect of spray emitter material on quinone reduction, home-made ESI source (fused silica capillary emitter) and commercial ESI source (named HESI with stainless-steel capillary emitter) were compared.2.3. Mass spectrometry
All MS experiments were carried out using a Thermo LTQ or Orbitrap Exactive Plus mass spectrometer (Thermo Fisher Scientific, San Jose, CA, U.S.A.). The mass spectrometric conditions throughout the study were set as: S lens voltage, 60% (negative mode); capillary temperature, 275 °C; ion injection time, 10 ms. The mass spectrum signals were averaged by three microscans.3. Results and discussion
3.1. Reduction of DCBQ in negative ESI MS
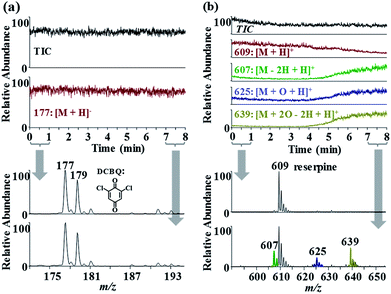
The setup in Fig. S1† was used to investigate quinone reduction in negative ESI MS. When DCBQ solution was electrosprayed, unexpected [M + H]− ions (m/z 177, 179), rather than [M − H]− ions (m/z 175, 177), were observed in the mass spectra (Fig. 1a). [M + H]− ions of DCBQ were identified by MS/MS analysis (Fig. S2†). Both electrochemical reaction and CD possibly resulted in analyte reduction during ESI. It has been intensively investigated that ESI can be viewed as a controlled-current electrolytic cell.18,19 When negative spray voltage is applied, anions will be sprayed into the gas phase, and cations will be accumulated in the liquid phase. To maintain charge balance, reduction reaction will occur at the solution/electrode interface to consume the excessive cations. However, the possibility of electrochemistry-induced reduction of DCBQ could be excluded based on the following experiments. Electrochemical reaction occurred at the electrode/solution interface which corresponded to the syringe needle/solution interface in the experimental setup. Since there was an approximate 50 cm-long fused silica capillary between the electrode and the spray tip, electrochemistry-induced reduction would be observed with a time delay, as that observed for reserpine oxidation in positive ESI mode (Fig. 1b) (the oxidation pathway of reserpine is shown in Fig. S3,† with the main products of 3,4-dehydroreserpine (m/z 607), 1-hydroxyreserpine (m/z 625), and methoxyl substituted reserpine (m/z 639)20,21). Herein, the volume of the approximate 50 cm-long fused silica capillary with a diameter of 100 μm was approximate 4 μL. Therefore, it took about 4 min for sample solution with electrode contact to pass through it with a flow rate of 1 μL min−1. However, [M + H]− ions of DCBQ were observed at the very beginning of the spray (Fig. 1a). Therefore, electrochemistry would not be responsible for DCBQ reduction in negative ESI MS.3.2. Effect of experimental parameters on DCBQ reduction
Benassi et al. observed the reduction of BQ in negative DESI MS when investigating the asymmetrical incidence of oxidation and reduction reaction.7 The authors speculated that standard solution-phase electrochemical processes had only limited influence on the redox transformations, but discharge-created radicals in the gas phase were dominant. To gain more insight into the mechanism of quinone reduction in negative ESI mode, we investigated the effect of experimental factors that were influential to CD, including spray voltage, solvent composition, sheath gas, spray emitter material, and flow rate of electrospray, on quinone reduction.Solvent composition affects the extent of discharge in electrospray.22 For example, the extent of discharge for the following three solvents is: H2O > CH3OH/H2O (v/v, 1![[thin space (1/6-em)]](https://www.rsc.org/images/entities/char_2009.gif) :
:![[thin space (1/6-em)]](https://www.rsc.org/images/entities/char_2009.gif) 1) > CH3OH,23 which can be characterized by the luminescence extent of electrospray.24 When pure CH3OH was used as the solvent, most of DCBQs were reduced to the [M + H]− form. When CH3OH/H2O (v/v, 1
1) > CH3OH,23 which can be characterized by the luminescence extent of electrospray.24 When pure CH3OH was used as the solvent, most of DCBQs were reduced to the [M + H]− form. When CH3OH/H2O (v/v, 1![[thin space (1/6-em)]](https://www.rsc.org/images/entities/char_2009.gif) :
:![[thin space (1/6-em)]](https://www.rsc.org/images/entities/char_2009.gif) 1) was used as the solvent, the signal intensity of [M + H]− ions was slightly higher than that of M˙− ions (m/z 176, 178) (M˙− ions of DCBQ were identified by MS/MS analysis (Fig. S2†)). However, when pure H2O was used as the solvent, the mass spectra were dominated by M˙− ions (Fig. 2). The results showed that a more severe CD facilitated the formation of M˙− ions, while a weaker CD favoured the formation of [M + H]− ions. As the CD strengthens, the ESI source increasingly behaves as a composite ESI/APCI source. M˙−, corresponding to the molecular radical ion of analytes, is generally produced in plasma-based atmospheric pressure ionization sources, such as APCI,15 LTP,25 and DBDI,26 by gaining an electron during the ionization process. However, [M + H]−, corresponding to the deprotonated molecule of the hydrogenated product, is rarely encountered in most of the atmospheric pressure ionization sources. The reduction of DCBQ to [M + H]− and M˙− might involve with proton- and electron-initiated reduction,6,27 respectively, because addition of NH4Ac, a proton-rich matrix,6 to the DCBQ solution facilitated the formation of [M + H]− ions (Fig. S4†). Although the two reduction pathways need more investigations, it can be concluded that the formation of [M + H]− and M˙− ions of DCBQ is related with CD occurring in the gas phase.
1) was used as the solvent, the signal intensity of [M + H]− ions was slightly higher than that of M˙− ions (m/z 176, 178) (M˙− ions of DCBQ were identified by MS/MS analysis (Fig. S2†)). However, when pure H2O was used as the solvent, the mass spectra were dominated by M˙− ions (Fig. 2). The results showed that a more severe CD facilitated the formation of M˙− ions, while a weaker CD favoured the formation of [M + H]− ions. As the CD strengthens, the ESI source increasingly behaves as a composite ESI/APCI source. M˙−, corresponding to the molecular radical ion of analytes, is generally produced in plasma-based atmospheric pressure ionization sources, such as APCI,15 LTP,25 and DBDI,26 by gaining an electron during the ionization process. However, [M + H]−, corresponding to the deprotonated molecule of the hydrogenated product, is rarely encountered in most of the atmospheric pressure ionization sources. The reduction of DCBQ to [M + H]− and M˙− might involve with proton- and electron-initiated reduction,6,27 respectively, because addition of NH4Ac, a proton-rich matrix,6 to the DCBQ solution facilitated the formation of [M + H]− ions (Fig. S4†). Although the two reduction pathways need more investigations, it can be concluded that the formation of [M + H]− and M˙− ions of DCBQ is related with CD occurring in the gas phase.
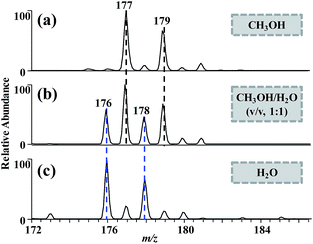 | ||
Fig. 2 ESI mass spectra of DCBQ (2 μg mL−1) in (a) CH3OH, (b) CH3OH/H2O (v/v, 1![[thin space (1/6-em)]](https://www.rsc.org/images/entities/char_2009.gif) : :![[thin space (1/6-em)]](https://www.rsc.org/images/entities/char_2009.gif) 1), and (c) H2O. Flow rate = 2 μL min−1, spray voltage = 3 kV. 1), and (c) H2O. Flow rate = 2 μL min−1, spray voltage = 3 kV. | ||
Flow rate is another factor affecting CD during ESI MS.12 Our previous work has shown that the discharge extent of electrospray was inversely proportional to the flow rate. With higher flow rate, the intensity of CD-induced luminescence was weaker.12,28 When the DCBQ solution was electrosprayed with the flow rate of 2 and 5 μL min−1, more [M + H]− ions were generated with the higher flow rates (Fig. 3). The results indicated that a weaker CD favoured the formation of [M + H]− ions of DCBQ.
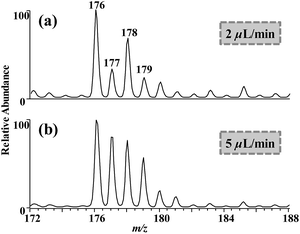 | ||
| Fig. 3 ESI mass spectra of DCBQ (2 μg mL−1 in H2O with 5 mmol L−1 NH4Ac) with flow rates of (a) 2 μL min−1 and (b) 5 μL min−1. Spray voltage = 3 kV. | ||
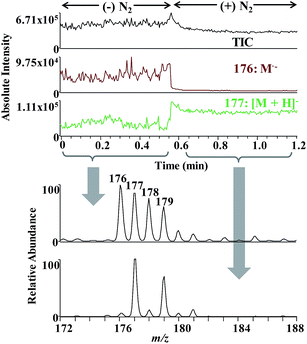
Sheath gas affects CD via changing the surrounding circumstance where CD occurs.23 When no sheath gas was used, the surrounding environment of electrospray was air consisting of 78% nitrogen (N2) and 21% oxygen, and the signal intensities of [M + H]− and M˙− were comparative without use of sheath gas (Fig. 4). However, when N2 was used as sheath gas, the signal intensity of [M + H]− raised accompanying the significant decrease of the signal intensity of M˙−. Similarly, sulfur hexafluoride (SF6) facilitated the formation of [M + H]− ions (Fig. S5†). The dielectric strengths of O2, N2, and SF6 are 0.92, 1, and 2.6, respectively.29 Gas with higher dielectric strength more readily suppresses discharge, for which SF6 is commonly used as discharge-suppression gas.30 Therefore, the results indicated that a more severe CD facilitated the formation of M˙− ions, while a weak CD favoured the formation of [M + H]− ions.
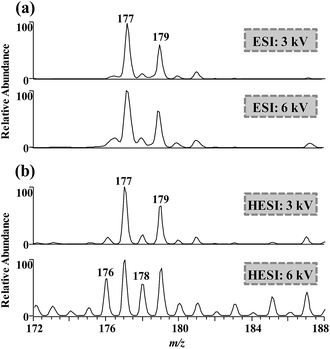
Spray voltage and spray emitter material can also affect CD during ESI,14 which was characterized via luminescent intensity in our previous work.28 When DCBQ solution was electrosprayed at spray voltages of 3 and 6 kV using fused silica capillary as spray emitter, the mass spectra were dominated by [M + H]− ions. However, when DCBQ solution was electrosprayed with stainless-steel capillary as spray emitter (conducted with a commercial ESI source), more M˙− ions were generated with spray voltage of 6 kV (Fig. 5). Metal spray emitter discharges more drastically than fused silica spray emitter under the same conditions, because the metal emitter releases electrons more easily than the Taylor cone of the electrospray solution.22 On the other hand, higher spray voltage will result in more vigorous CD, based on which Downard's group have done intensive proteomics-related research.31–33 Therefore, the results indicated that a more sever CD through raising spray voltage or using metal spray emitter facilitated the formation of M˙− ions.
Besides, we explored the effect of NH4Ac, solvent composition, and sheath gas on the reduction of DCBQ in a commercial ESI source, and similar results as home-made ESI source were obtained. Addition of NH4Ac, solvent of CH3OH and using N2 as sheath gas also facilitated the formation of [M + H]− ions in negative ESI MS (Fig. S6†).
3.3. Reduction of other quinones in negative ESI MS
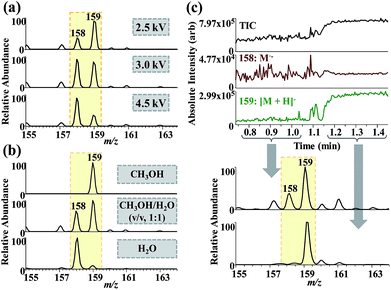
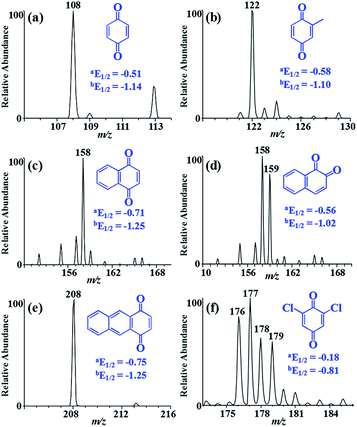
In addition, we studied the reduction behaviours of other quinones during negative ESI MS. The effect of spray voltage, solvent composition, and sheath gas on 1,2-NQ reduction is shown in Fig. 6. When 1,2-NQ in CH3OH/H2O (v/v, 1![[thin space (1/6-em)]](https://www.rsc.org/images/entities/char_2009.gif) :
:![[thin space (1/6-em)]](https://www.rsc.org/images/entities/char_2009.gif) 1) was electrosprayed, [M + H]− (m/z 159) and M˙− (m/z 158) ions dominated the mass spectra at spray voltages of 2.5 and 4.5 kV, respectively (Fig. 6a) (the ions of m/z 158 and 159 were identified via the MS/MS analysis, Fig. S7†). With the solvent composition changed from methanol to water, more M˙− ions were produced during the ESI process (Fig. 6b). Besides, the signal intensity of [M + H]− increased with the decrease of that of M˙− when N2 was used as the sheath gas (Fig. 6c). The effect of sheath gas (N2) on 1,2-NQ reduction in a commercial ESI source with Orbitrap Exactive Plus mass spectrometer is shown in Fig. S8.† All above results showed that experimental factors facilitating CD, including high spray voltage, using water as spray solvent, and using N2 as sheath gas, contributed to the formation of M˙− ions of 1,2-NQ.
1) was electrosprayed, [M + H]− (m/z 159) and M˙− (m/z 158) ions dominated the mass spectra at spray voltages of 2.5 and 4.5 kV, respectively (Fig. 6a) (the ions of m/z 158 and 159 were identified via the MS/MS analysis, Fig. S7†). With the solvent composition changed from methanol to water, more M˙− ions were produced during the ESI process (Fig. 6b). Besides, the signal intensity of [M + H]− increased with the decrease of that of M˙− when N2 was used as the sheath gas (Fig. 6c). The effect of sheath gas (N2) on 1,2-NQ reduction in a commercial ESI source with Orbitrap Exactive Plus mass spectrometer is shown in Fig. S8.† All above results showed that experimental factors facilitating CD, including high spray voltage, using water as spray solvent, and using N2 as sheath gas, contributed to the formation of M˙− ions of 1,2-NQ.
When BQ, MBQ, 1,4-NQ, and AQ in CH3OH/H2O (v/v, 1![[thin space (1/6-em)]](https://www.rsc.org/images/entities/char_2009.gif) :
:![[thin space (1/6-em)]](https://www.rsc.org/images/entities/char_2009.gif) 1) were separately electrosprayed in negative ion mode, all their mass spectra were dominated by M˙− ions, which was quite different from the behaviours of 1,2-NQ and DCBQ. We suspected that the different reduction behaviours of various quinones might correlate to their reduction potentials, which had been used to explain quinone reduction in FAB5 and ESI MS.34 Quinone reduction involves with two steps of electron transfer, and their reduction potentials are shown in Fig. 7.35 A trend was observed that quinones with higher reduction potential tended to form [M + H]− ions.
1) were separately electrosprayed in negative ion mode, all their mass spectra were dominated by M˙− ions, which was quite different from the behaviours of 1,2-NQ and DCBQ. We suspected that the different reduction behaviours of various quinones might correlate to their reduction potentials, which had been used to explain quinone reduction in FAB5 and ESI MS.34 Quinone reduction involves with two steps of electron transfer, and their reduction potentials are shown in Fig. 7.35 A trend was observed that quinones with higher reduction potential tended to form [M + H]− ions.
DCBQ in CH3OH/H2O (v/v, 1![[thin space (1/6-em)]](https://www.rsc.org/images/entities/char_2009.gif) :
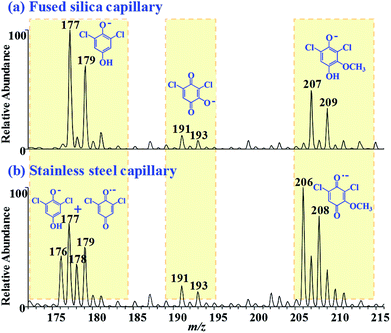
:![[thin space (1/6-em)]](https://www.rsc.org/images/entities/char_2009.gif) 1) can be transformed to hydroxylated and methoxylated DCBQ (their structures were identified by high resolution and MSn spectra in Fig. S9†).36 When DCBQ in CH3OH/H2O (v/v, 1
1) can be transformed to hydroxylated and methoxylated DCBQ (their structures were identified by high resolution and MSn spectra in Fig. S9†).36 When DCBQ in CH3OH/H2O (v/v, 1![[thin space (1/6-em)]](https://www.rsc.org/images/entities/char_2009.gif) :
:![[thin space (1/6-em)]](https://www.rsc.org/images/entities/char_2009.gif) 1) was electrosprayed from fused silica capillary emitter, DCBQ and methoxylated DCBQ were detected as the [M + H]− form (m/z 177, 179; m/z 207, 209), and hydroxylated DCBQ was detected as the M˙− form (m/z 191, 193). However, when stainless-steel capillary was used as the spray emitter, methoxylated DCBQ and partial DCBQ were transformed to the M˙− form (Fig. 8). Therefore, the hydrogenation reduction ability of the three compounds could be ranked as: DCBQ > methoxylated DCBQ > hydroxylated DCBQ. The results further illustrated that the reduction behaviours of various quinones were related with their chemical structures.
1) was electrosprayed from fused silica capillary emitter, DCBQ and methoxylated DCBQ were detected as the [M + H]− form (m/z 177, 179; m/z 207, 209), and hydroxylated DCBQ was detected as the M˙− form (m/z 191, 193). However, when stainless-steel capillary was used as the spray emitter, methoxylated DCBQ and partial DCBQ were transformed to the M˙− form (Fig. 8). Therefore, the hydrogenation reduction ability of the three compounds could be ranked as: DCBQ > methoxylated DCBQ > hydroxylated DCBQ. The results further illustrated that the reduction behaviours of various quinones were related with their chemical structures.
Experimental parameters that relate to CD greatly affect the signal intensities of [M + H]− and M˙− ions of quinones. Attentions should be paid to control the ions in one form as much as possible for quantitative analysis of quinones. For quinones with low reduction potentials, such as 1,4-NQ and AQ, M˙− ions can be chosen as the quantitative ions because M˙− ions are generally produced under common experimental conditions. For quinones with high reduction potentials, such as DCBQ and 1,2-NQ, both [M + H]− and M˙− ions can be chosen as the quantitative ions, depending on the experimental parameters. While M˙− will be chosen as the quantitative ion under strong discharge conditions, [M + H]− will be chosen as the quantitative ion under weak discharge conditions.
4. Conclusions
Quinones can be reduced to [M + H]− and M˙− ions in negative ESI MS, and the reduction behaviours are related with experimental parameters. Those experimental parameters resulting in a severe CD, such as high spray voltage, slow flow rate, using water as spray solvent, no use of sheath gas, and metal spray emitter, facilitate the formation of M˙− ions, whereas weak CD conditions favour the formation of [M + H]− ions. Moreover, the reduction behaviours of quinones are associated with the chemical structures. Quinones with higher reduction potentials tend to form [M + H]− ions.Conflicts of interest
There are no conflicts to declare.Acknowledgements
This work was supported by the National Key Basic Research Program of China (No. 2013CB956102), the Guangxi Natural Science Fund Project (No. 2016GXNSFBA380140), the BaGui Scholars Program Foundation (2014) and the National Natural Science Foundation of China (21665003, 41473118).References
- Y. L. Hui, E. L. K. Chng, C. Y. L. Chng, H. L. Poh and R. D. Webster, J. Am. Chem. Soc., 2009, 131, 1523–1534 CrossRef CAS PubMed.
- I. Hassan, J. Pavlov, R. Errabelli and A. B. Attygalle, J. Am. Soc. Mass Spectrom., 2017, 28, 270–277 CrossRef CAS PubMed.
- R. W. A. Oliver and R. M. Rashman, J. Chem. Soc. B, 1968, 1141–1143 RSC.
- S. Ukai, K. Hirose, A. Tatematsu and T. Goto, Tetrahedron Lett., 1967, 8, 4999–5002 CrossRef.
- R. Cooper and S. Unger, J. Antibiot., 1985, 38, 24–30 CrossRef CAS PubMed.
- O. W. Hand, L. D. Detter, S. A. Lammert, R. G. Cooks and R. A. Walton, J. Am. Chem. Soc., 1989, 111, 5577–5583 CrossRef CAS.
- M. Benassi, C. Wu, M. Nefliu, D. R. Ifa, M. Volný and R. G. Cooks, Int. J. Mass Spectrom., 2009, 280, 235–240 CrossRef CAS.
- F. Qin, Y. Y. Zhao, Y. L. Zhao, J. M. Boyd, W. J. Zhou and X. F. Li, Angew. Chem., Int. Ed., 2010, 49, 790–792 CrossRef CAS PubMed.
- G. J. V. Berkel and F. M. Zhou, Anal. Chem., 1995, 67, 3958–3964 CrossRef.
- M. Abonnenc, L. Qiao, B. Liu and H. H. Girault, Annu. Rev. Anal. Chem., 2010, 3, 231–254 CrossRef CAS PubMed.
- J. R. Lloyd and S. Hess, J. Am. Soc. Mass Spectrom., 2009, 20, 1988–1996 CrossRef CAS PubMed.
- S. D. Maleknia and K. M. Downard, Chem. Soc. Rev., 2014, 43, 3244–3258 RSC.
- M. Chen and K. D. Cook, Anal. Chem., 2007, 79, 2031–2036 CrossRef CAS PubMed.
- J. Y. Pei, C. C. Hsu, R. J. Zhang, Y. H. Wang, K. F. Yu and G. M. Huang, J. Am. Soc. Mass Spectrom., 2017 DOI:10.1007/s13361-017-1770-4.
- F. J. Andrade, J. T. Shelley, W. C. Wetzel, M. R. Webb, G. Gamez, S. J. Ray and G. M. Hieftje, Anal. Chem., 2008, 80, 2654–2663 CrossRef CAS PubMed.
- M. Tabrizchi, T. Khayamian and N. Taj, Rev. Sci. Instrum., 2000, 71, 2321–2328 CrossRef CAS.
- R. T. Kelly, J. S. Page, Q. Luo, R. J. Moore, D. J. Orton, K. Tang and R. D. Smith, Anal. Chem., 2006, 78, 7796–7801 CrossRef CAS PubMed.
- S. Plattner, R. Erb, J. P. Chervet and H. Oberacher, Anal. Bioanal. Chem., 2012, 404, 1571–1579 CrossRef CAS PubMed.
- J. Y. Pei, X. Zhou, X. Q. Wang and G. M. Huang, Anal. Chem., 2015, 87, 2727–2733 CrossRef CAS PubMed.
- G. J. V. Berkel, K. G. Asano and M. C. Granger, Anal. Chem., 2004, 76, 1493–1499 CrossRef PubMed.
- D. V. C. Awang, B. A. Dawson, M. Girard, A. Vincent and I. Ekiel, J. Org. Chem., 1990, 55, 4443–4448 CrossRef CAS.
- N. B. Cech and C. G. Enke, Mass Spectrom. Rev., 2001, 20, 362–387 CrossRef CAS PubMed.
- M. G. Ikonomou, A. T. Blades and P. Kebarle, J. Am. Soc. Mass Spectrom., 1991, 2, 497–505 CrossRef CAS PubMed.
- I. L. Kanev, A. Y. Mikheev, Y. M. Shlyapnikov, E. A. Shlyapnikova, T. Y. Morozova and V. N. Morozov, Anal. Chem., 2014, 86, 1511–1517 CrossRef CAS PubMed.
- A. Albert and C. Engelhard, Anal. Chem., 2012, 84, 10657–10664 CrossRef CAS PubMed.
- N. Na, C. Zhang, M. Zhao, S. Zhang, C. Yang, X. Fang and X. Zhang, J. Mass Spectrom., 2007, 42, 1079–1085 CrossRef CAS PubMed.
- Y. Zhao, F. Qin, J. M. Boyd, J. Anichina and X. F. Li, Anal. Chem., 2010, 82, 4599–4605 CrossRef CAS PubMed.
- G. Y. Li, J. Y. Pei, Y. Yin and G. M. Huang, Analyst, 2015, 140, 2623–2627 RSC.
- B. L. Boys, M. C. Kuprowski, J. J. Noël and L. Konermann, Anal. Chem., 2009, 81, 4027–4034 CrossRef CAS PubMed.
- R. B. Cole and A. K. Harrata, J. Am. Soc. Mass Spectrom., 1993, 4, 546–556 CrossRef CAS PubMed.
- J. W. Ha, A. B. Schwahn and K. M. Downard, Rapid Commun. Mass Spectrom., 2010, 24, 2900–2908 CrossRef CAS PubMed.
- K. M. Downard, S. D. Maleknia and S. Akashi, Rapid Commun. Mass Spectrom., 2012, 26, 226–230 CrossRef CAS PubMed.
- S. D. Maleknia and K. M. Downard, Rapid Commun. Mass Spectrom., 2012, 26, 2311–2318 CrossRef CAS PubMed.
- R. Vessecchi, Z. Naal, J. N. Lopes, S. E. Galembeck and N. P. Lopes, J. Phys. Chem. A, 2011, 115, 5453–5460 CrossRef CAS PubMed.
- M. E. Peover, J. Chem. Soc., 1962, 4540–4549 RSC.
- Y. Qian, W. Wang, J. M. Boyd, M. Wu, S. E. Hrudey and X. F. Li, Environ. Sci. Technol., 2013, 47, 4426–4433 CrossRef CAS PubMed.
Footnote |
| † Electronic supplementary information (ESI) available. See DOI: 10.1039/c7ra08523k |
| This journal is © The Royal Society of Chemistry 2017 |

