 Open Access Article
Surface crystallization of low thermal expansion Ba0.5Sr0.5Zn2Si2O7 from an 8 BaO·8 SrO·34 ZnO·50 SiO2 glass
Michael Kracker *a,
Liliya Vladislavovaa,
Christian Thiemeb,
Tilman Zscheckela,
Katrin Thiemea,
Thomas Höcheb and
Christian Rüssela
aOtto-Schott-Institut für Materialforschung, Jena University, Fraunhoferstr. 6, 07745 Jena, Germany. E-mail: kracker.michael@googlemail.com; Fax: +49 3641 948502; Tel: +49 3641 98507
bFraunhofer-Institut für Mikrostruktur von Werkstoffen und Systemen IMWS, Walter-Hülse-Straße 1, 06120 Halle (Saale), Germany
First published on 19th September 2017
Abstract
Thermal treatment of a glass with the composition 8 BaO·8 SrO·34 ZnO·50 SiO2 has led to the crystallization of a Ba1−xSrxZn2Si2O7 solid solution. This solid solution has a very low or even negative thermal expansion. The glass system possesses a strong tendency towards surface crystallization, while bulk nucleation is negligible. The surface crystallization behavior was characterized using differential scanning calorimetry, X-ray diffraction, optical microscopy, and scanning electron microscopy including electron backscatter diffraction. The observed morphology strongly depends on the type of surface pretreatment. Two different surface qualities were compared: a polished surface and a surface obtained by cutting. The as-cut surface shows a significantly enhanced nucleation rate, which leads to smaller crystals caused by a growth selection near to the surface. The crystal orientation related to the inward growth starting from the surface was successfully investigated by EBSD, for the first time, using a recently reported crystal structure. The crystals show a preferred orientation of the c-axis perpendicular to the surface; this has a significant effect on the crack formation.
Introduction
The most common characteristic of thermal expansion is that materials tend to expand with heating.1 By contrast, materials possessing zero-thermal expansion (ZTE) or even a negative-thermal expansion (NTE) behavior are scarce.2 Representatives of this latter type of material, such as beta quartz, spodumene or beta-eucryptite are all non-cubic. Due to crystal symmetry, coefficients of thermal expansion depend on crystallographic direction and typically have positive values along two directions, and only negative values along one specific crystallographic direction. The advantage, however, is that these phases could be crystallized from glasses based on lithium alumosilicate in the former cases. These materials are of great economic importance3 and consequently also provoke major scientific interest, particularly on considering the intrinsic reasons for unusual thermal expansion processes. There are also cubic phases such as ZrW2O8 that show advantageous, isotropic NTE behavior.4 Unfortunately, from these cubic phases, materials with zero thermal expansion are difficult to prepare, and the usual method of glass crystallization is not suitable since these phases are not glass forming.Recently, a new oxidic crystal phase corresponding to a solid solution containing Ba, Sr, Zn, and Si was reported.5 This solid-solution with the composition Ba1−xSrxZn2Si2O7 (BSZS) also shows negative thermal expansion behavior, although the same phase without Sr is rather well known for very high thermal expansion coefficients.6 The Sr-free BaZn2Si2O7 shows a phase transition to a high temperature phase (HT phase), which already shows negative thermal expansion, at 280 °C.6 A substitution of more than 10% of Ba by Sr leads to the stabilization of a crystal structure, comparable to the as mentioned HT-phase, down to room temperature;5 hence, the negative thermal expansion behavior could also be observed at room temperature. Unfortunately, this crystalline phase shows an unfavorable and large anisotropy, thus the CTE in different crystallographic directions varies between around −30 × 10−6 K−1 (for the crystallographic b axes) and +20 × 10−6 K−1 (for the crystallographic c axes) in a temperature range from 30 to 600 °C.7 However, in this case, not only are the thermal properties decisive but also the manufacturing process of the glass-ceramic. A powder with the expected properties could be prepared by a common solid state reaction, but in contrast, the preparation of a ceramic body leads to problems caused by the large anisotropy of the crystal phase.8 Therefore, in order to avoid mechanical stresses, the crystals should be small.9,10 It has already been shown that the preparation of single phase BSZS materials is possible using sol–gel derived powders.8 An alternative synthesis route involves precipitating the expected phase from a glass; however, the respective glasses show a high tendency to surface crystallization, which makes the preparation of bulk materials challenging.11 A detailed characterization and understanding of the mechanisms of phase formation and crystal growth at the surface will help to improve the material properties of BSZS glass-ceramics.
The present glass system containing 8 mol% BaO, 8 mol% SrO, 34 mol% ZnO, and 50 mol% SiO2 tends, in comparison to many glasses without nucleating agents, toward surface crystallization caused by the preferred formation of nuclei at the surface.12
For this purpose, the growth behavior of the negative and strongly anisotropic crystal phase at the surface of a glass has to be examined. Crystal orientation, growth morphology, the effect of the large anisotropy as well as the nucleation behavior will be described, also with respect to future volume crystallization experiments, because the growth behavior is also decisive in this case.
Experimental procedure
The glass was melted from reagent grade raw materials without further purification. The used raw materials were ZnO, BaCO3, SrCO3, ZnO, and SiO2. The calculated batch with the composition 8 BaO·8 SrO·34 ZnO·50 SiO2 (mol%) was heated in an induction furnace in a Pt crucible up to 1420 °C and kept for 2 h while stirring. The glass was cast in an Inconel mold coated with a boron nitride film and subsequently heated to 700 °C. The solidified glass was transferred to a muffle furnace also preheated to 700 °C. The furnace was immediately switched off to allow the glass block to cool down slowly.A proper amount of the cooled glass block was crushed and separated into different particle size fractions to investigate the thermal properties as well as the crystallization behavior. For this purpose, differential scanning calorimetry (DSC) was conducted with a Linseis DSC Pt 1600. Glass powders (60 ± 0.1 mg) with different grain size fractions were placed into Pt crucibles, and heated to 1000 °C at 10 K min−1.
In order to investigate the crystallization behavior, the samples were cut into small discs with a diameter of 10 mm and a thickness of 3 mm. One side of the obtained samples was polished using a cerium oxide containing lapping abrasive with a mean grain size of 1 μm. The other side of the sample remained unpolished. The surface properties were determined with a Zeiss Axio Imager Z1m equipped with a LSM 700 laser-scanning module. The image processing was performed using the Confomap software.
According to the results from the DSC measurements, crystallization was carried out in a muffle furnace at temperatures of 750, 770, and 790 °C for several hours.
To perform microstructure analyses of the volume, the crystallized samples were embedded in a polymer matrix and subsequently cut perpendicular to the former sample surface and then polished. A Jeol JSM 6510 LV equipped with a semiconductor backscattered electron detector was used to study the crystals grown from the surface into the bulk.
In order to investigate the phase composition, an X-ray diffractometer, Rigaku MiniFlex 300, with Ni-filtered CuKα radiation was used. The polished and subsequently heat treated surfaces of bulk samples were measured in Bragg–Brentano-geometry.
Density measurements were performed with a Micromeritics AccuPyc 1330 helium pycnometer. The ultrasound technique was used for the determination of elastic constants, i.e., the Young's Modulus and the Poisson's ratio. The respective samples had a cylindrical shape with a diameter of 15 mm and a length of 30 mm; front faces were made parallel. From the ultrasound velocities of a longitudinal (5 MHz) and a transversal (4 MHz) probe, the elastic constants could be calculated as described in ref. 13.
For the thermal expansion behavior, a Netzsch Dil 402 PC dilatometer equipped with a fused silica sample holder was used by applying a heating rate of 5 K min−1. A glass cylinder with a diameter of 5 mm and a length of 10 mm was used as the sample.
The viscosities were measured by a beam bending viscometer Bähr VIS 401 (108.5 to 1012.5 dPa s), supplying a heating rate of 10 K min−1 and using glass bars with the dimensions 5 × 5 × 50 and 5 × 4 × 50 mm3. In order to increase the temperature range in which the beam bending viscosities could be determined, three different loads (10, 50, and 250 g) were used. Moreover, measurements in the low viscosity range 101.2 to 105 dPa s were performed using a rotation viscometer Bähr VIS 403. For this purpose, different rotation rates (10 and 250 rpm) were used and a cooling rate of 5 K min−1 was applied. The determined viscosities were fitted using the Vogel–Fulcher–Tammann equation (VFT-equation).
The crystal morphology was studied on carbon coated samples using a Scanning Electron Microscope (SEM) JEOL 7001 F. The crystal orientation studies were performed by the electron backscatter diffraction (EBSD) technique as a module of the SEM. A Digiview 3 EBSD-camera was used to collect the diffraction patterns, which were interpreted using the software packages TSL OIM Data Collection and Data Analysis 5.31. The patterns were obtained at an acceleration voltage of 20 kV with a working distance of 15 mm. The scan step size was set to 0.25 μm. In order to increase the fraction of reliably indexed data points, Confidence Index (CI) standardization and fit standardization clean-up procedures were applied to the dataset with grain angle tolerance = 5 and minimum CI ≥ 0.1 as parameters. Following this, only points with a CI ≥ 0.1 were used for visualization. The Image Quality (IQ) was used as gray scale in the background, where the gray value increases with crystal perfection from black to white (grain boundaries appear dark, homogeneous monocrystalline regions appear bright). The reference direction of the inverse pole figure (IPF) color code is [001], i.e. the normal of the sample surface.
Results
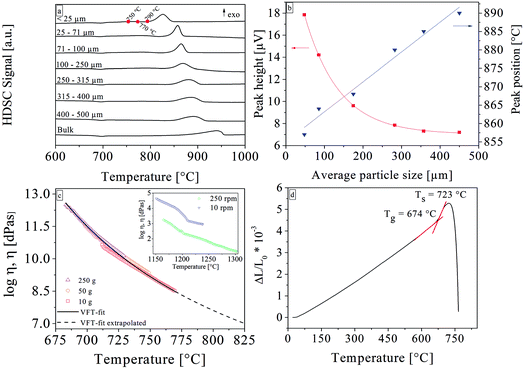
The basic properties of the glass are summarized in Table 1. DSC analyses of glass powders with different grain sizes (see Fig. 1a and b) show the crystallization behavior. The glass transition temperature, which could hardly be seen in Fig. 1, is at 677 °C. The bulk sample shows an exothermal peak at 939 °C (onset at 874 °C); the exothermic peak shifts to lower temperatures and becomes sharper with decreasing grain size. The upper right graph of Fig. 1 shows this behavior in more detail. The bulk values as well as the values for grain sizes below 25 μm are not included in the upper right graph, as the values could not be quantified. For particle sizes below 25 μm, the crystallization peak occurred at 826 °C (onset at 801 °C), which was the lowest observed value. The glass samples were thermally treated at temperatures of 750 °C, 770 °C, and 790 °C, which is somewhat below the lowest crystallization onset of 801 °C. The viscosities determined by beam bending and rotation viscometry were fitted in the entire temperature range using the Vogel–Fulcher–Tammann (VFT)-equation. The rotation viscometry data obtained by the measurement using a rotation rate of 10 rpm were not included in this fit. The results of the beam bending viscometry measurements are shown in Fig. 1 along with the VFT-fit (black solid line). The viscosities were extrapolated for higher temperatures marked by the black dashed line. It is apparent that the choice of the load is decisive for the measurable temperature range. In the inset, the results of the rotation viscometry are displayed. Here, it is obvious that the viscosities determined by a measurement using 10 rpm are about 1.5 orders of magnitude higher than those derived from the 250 rpm measurement. Normally, the curves should overlap and solely the measurable temperature range should be different. Moreover, there are several kinks in the viscosity curves. The deviations in the viscosity as well as the kinks were reproduced by repeated measurements using different rates.| Property | Value | Error | Method | |
|---|---|---|---|---|
| Young's modulus [GPa] | 84.0 | ±1.5 | Ultrasonic technique | |
| Density [g cm−3] | 3.832 | ±0.01 | He pycnometer | |
| Tg [°C] | 677 | ±5 | DSC | |
| 674 | ±5 | Dilatometry | ||
| Tonset of surface crystallization [°C] for various grain size fractions | 801 (< 25 μm) | ±5 | DSC | |
| 874 (bulk) | ||||
| Tmax of surface crystallization [°C] for various grain size fractions | 826 (< 25 μm) | ±5 | DSC | |
| 939 (bulk) | ||||
| CTE [10−6 K−1] for different temperature intervals | 6.76 (30–600 °C) | ±0.1 | Dilatometry | |
| 6.69 (100–400 °C) | ||||
| 7.54 (400–600 °C) | ||||
| Dilatometric softening temperature [°C] | 723 | ±5 | Dilatometry | |
| Viscosity | A = −2.967 dPa s | ±0.070 | Beam bending and rotation viscometer | |
| B = 4074 °C | ±75 | |||
| T0 = 417 °C | ±4.00 |
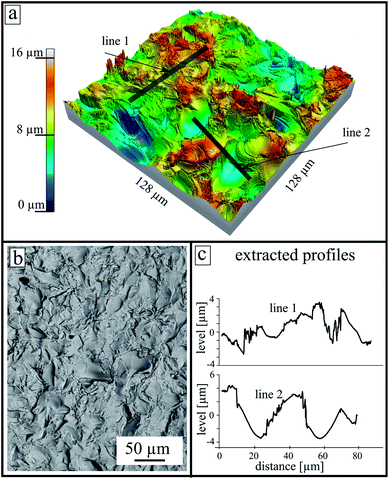
The surface morphology of an untreated as-cut surface (directly after the cutting) is presented in Fig. 2. At the top, a reconstructed 3D model calculated from an LSM image stack is shown. After cutting, areas with a high number density of sharp edges and almost smooth shell-like areas are observed. The height scale was established regarding the lowest point in the measured area and is in a range up to 16 μm. The two gray lines (line 1 and line 2 in the upper panel) represent the extracted profiles shown at the lower right side. Additionally, an SEM micrograph of the sample surface is shown at the lower part.
The resulting thickness of the crystal layer was determined using SEM micrographs of cross sections. Fig. 3 shows the resulting thickness of the crystalline layer as an effect of the surface pretreatment, temperature, and treatment time. As expected, the thickness and the growth rate of the crystal layer increase with time and temperature. The thickness of the crystallized layer is also higher for the as-cut surfaces. It must be noted that crystalline layers below approx. 30 μm are not fully closed. At the latter depth, small isolated crystals appear. The largest distance of these crystals perpendicular to the surface is considered as layer thickness. In the case of samples with polished surfaces, subsequently crystallized at 790 and 770 °C, induction times for the crystallization process are observed as indicated by the linear regressions. By contrast, for as-cut surfaces, at an annealing time of 0 h (the heating program is just finished), crystals are present and the layer thickness is above zero.
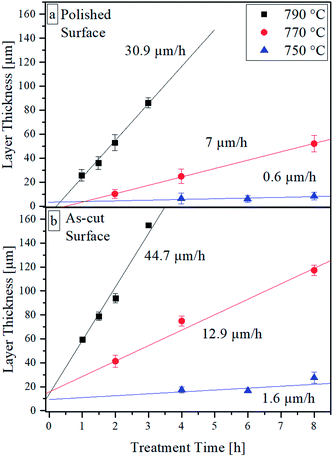 | ||
| Fig. 3 Crystal growth velocities at different annealing temperatures parallel to (a) a polished surface, (b) a rough surface. | ||
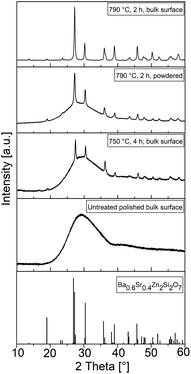
The XRD pattern at the bottom of Fig. 4 illustrates the theoretical peak positions and the relative intensities of a crystal with the composition Ba0.6Sr0.4Zn2Si2O7. For all bulk samples, the former polished surface was measured by XRD. The untreated and polished surfaces show one broad maximum at a diffraction angle of around 30°. After heat treatment at 750 °C for 4 h, additional peaks according to the theoretical positions are observed, but the broad peak at 30° persists. After treatment at an elevated temperature of 790 °C for 2 h, the relative peak intensities increase, the shape of the pattern becomes sharper, and additional peaks are observed for both the powdered and bulk samples. However, the broad maximum is no longer visible for the bulk sample heat treated at 790 °C for 2 h. All apparent peaks could be attributed to the theoretical peak positions displayed in the lower part of Fig. 4.
The crystallization behavior of the glass was further studied by SEM using a backscatter electron detector. In order to compare the crystallization in different directions, plane-view samples were considered as well as the growth behavior perpendicular to the surface by inspection of cross sections. In Fig. 5, a comparison of plane views heat treated at different temperatures and different surface pretreatments are shown. In Fig. 5a, after a heat treatment at 750 °C for 4 h, isolated crystals with sizes of approximately 10 μm are observed. Some of these crystals appear sharp with a clear ray-like morphology and others have a bright rim and generally appear blurred. However, in Fig. 5b, a fully crystallized surface consisting of grains with sizes above 100 μm is observed after heat treatment of 790 °C for 2 h. Also, some cracks at the assumed center of the crystals are seen. Additionally, two different morphologies are present. Sharp, ray-like structures and a blurred area in the upper part of the micrograph were observed. Near the blurred morphology a deepening and/or cavity is located. This impression is enhanced using a superimposed topography mode available in the microscope acquisition software. The lower images Fig. 5c and d are recorded from samples thermally treated at 770 °C for 4 h using different surface roughness. At the initially polished surface, just a few partly isolated crystals with size of around 50 μm were formed. In contrast, more crystals were formed at the as-cut surface. Crystal sizes observed were comparable to those of the polished surface. Some small areas at the surface were not covered with crystals.
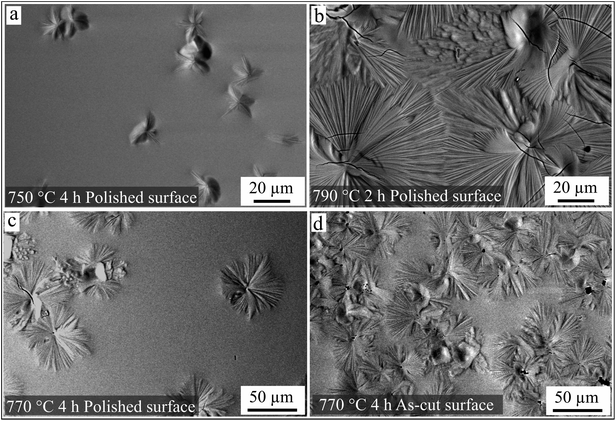 | ||
| Fig. 5 SEM micrographs of samples heat-treated at different temperatures, and with surfaces having different pretreatments. (a) Polished surface heat treated at 750 °C for 4 h; (b) polished surface heat treated at 790 °C for 2 h; (c) polished surface heat treated at 770 °C for 4 h; (d) as-cut surface (compare with Fig. 2) heat treated at 770 °C for 4 h. | ||
As already mentioned above, the crystallization was also studied in samples cut perpendicular to the surface. Fig. 6 compares the surface crystals at an early stage of growth. Both SEM micrographs are presented with the same magnification. The left image shows a plane view of a glass surface after heat treatment at 750 °C for 4 h. Isolated crystals with a morphology comparable to that in Fig. 5 could be identified. In contrast, a cross-section of an equally treated sample is shown on the right panel. Only one crystal could be seen in the whole cross section area. The black area in the upper part of the micrograph belongs to the embedding polymer matrix related to the cross-section preparation method.
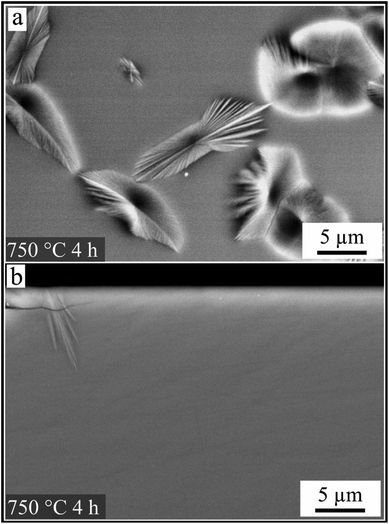 | ||
| Fig. 6 Microstructures of a polished surface after a heat treatment at 750 °C for 4 h. Comparison of crystals observed in plane view (a) and corresponding cross section (b) at the same magnification. | ||
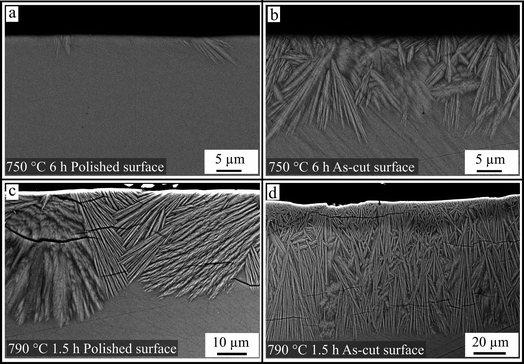
Fig. 7 provides an overview of the crystal morphologies of cross sections dependent on the heat treatment and the initial surface conditions. Fig. 7a shows the cross section of a polished sample surface, annealed at 750 °C for 6 h. Some isolated crystals with sizes between 2 and 6 μm are shown. In Fig. 7b, an SEM micrograph of the same sample but with an as-cut surface is depicted. A closed crystalline layer with an average thickness of 15 μm has formed. The resulting morphologies after thermal treatment at higher temperatures (790 °C for 1.5 h) are illustrated in Fig. 7c and d for a polished and an as-cut surface, respectively. The crystals grow from a former polished surface (c) to form a closed layer; however, the thickness varies between 20 and 40 μm. In the case of the as-cut surface (see Fig. 7d), many more crystals were formed at the surface and the crystals were longer and thinner. In contrast to Fig. 7b and c, the overall thickness of the crystalline layer varied by only a few microns.
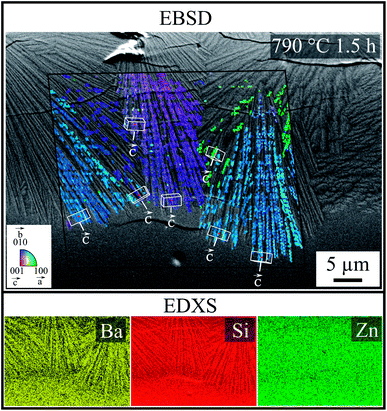
In order to investigate how crystals formed at the surface were oriented, and to what extent the cracks correlated with crystal orientation, combined EBSD-EDXS measurements were performed at the cross section on a sample crystallized from a polished surface at 790 °C for 1.5 h. Fig. 8 shows an SEM micrograph superimposed with a combined IQ and IPF-map, as well as the elemental analysis, containing the signals of Ba, Si and Zn. The collected EBSD-patterns and EDX-Spectra originate from positions within the black frame. The patterns of this sample were indexed using the ICSD data file no. 429939 of Ba0.6Sr0.4Zn2Si2O7. The colors of the IPF map represent the crystal direction normal to the plane of image. Within the three large ray-like domains, the orientation is similar and changes only gradually. The color changes indicate stresses in the crystals. Due to the small structures in combination with the stresses, the general IQ-value is quite low and not all patterns from the crystalline regions could be indexed reliably. Orientations of some single structures were visualized by white unit cells, where the orientations of the c-axes are highlighted by labeled white arrows. Red dots in the center of the unit cells mark the corresponding data points. In the three ray-like domains, the c-axis is oriented parallel to the length axis of the thin sub crystals and perpendicular to the cracks at the same time. The elemental analysis shows only small differences in the chemical composition of the glass and the crystal. The contrast and brightness of the elemental distribution map was adapted for a suitable recognizability. The ray-like structure was also reflected in the distribution maps of Ba and Si and it seems that the needles were enriched with Ba, whereas Si was enriched beyond the needles, and the distribution of Zn is homogenous.
Discussion
The crystallization behavior was studied first by thermal analysis (DSC). A change in the surface to volume ratio of the glass powder by using smaller grain sizes while keeping the mass constant, leads to a shift in the crystallization peak and the crystallization onset temperature towards lower temperatures.14–16 Furthermore, smaller particle sizes also lead to a higher and sharper exothermic peak. With decreasing grain size, the crystallization starts at lower temperatures because the ratio surface to volume increases. A higher surface area leads to more nucleation processes and thus to a more pronounced exothermic reaction. These results prove that this glass system crystallizes from the surface.The DSC results from the powder fraction smaller than 25 μm and the bulk sample are not included in Fig. 1b because the mean particle size could not be quantified. Nevertheless, it should be noted that the onset for the grains smaller than 25 μm reveals a strong additional shift towards lower temperatures. These are the lowest crystallization temperatures found in all DSC profiles. The temperature attributed to the onset of the exothermic peak is 801 °C and therefore temperatures slightly below this value were chosen for the static crystallization experiments. This was done in order to study the initial stages of crystallization, to get a better insight into the underlying processes and also to describe an easy to handle procedure with respect to a further technical application.
The results from the viscosity measurements are also shown in Fig. 1. The fact that a higher rotation rate leads to viscosities drastically lower than those of the measurements using the lower speed indicates the non-Newtonian behavior of the glass melt. Strictly speaking, the viscosity does not follow the VFT-equation and therefore the viscosities were only extrapolated up to 820 °C. The kinks in the rotation viscometry curves could be related to crystallization during cooling of the melt. This behavior was previously reported for glass ceramic melts of lithium disilicate17 and fluoroapatite.18,19
Two different surface pretreatments were used to describe the effect of surface roughness. The samples were cut by a diamond saw and subsequently polished. In order to compare the crystallization behavior, one side of the sample retained the typical rough structure of an as-cut surface. Fig. 2 shows such a surface morphology measured by LSM. The surface shows areas with a high number of edges, and almost smooth areas. This is a typical structure of a brittle fracture due to the glass cutting step because if the formed stresses in the glass matrix are too high during the cutting process, cracks are formed that propagate into the material. These cracks create new surfaces that are then very smooth and reveal a shell-like structure, called a conchoidal fracture.20 The cutting step creates two different types of surfaces, one with a high number density of edges, tips and striae caused by the diamond saw, as well as the described smooth clamshell marked fractures. Both types have a different effect on the crystallization properties21 as discussed below.
Most glass systems described in literature tend to nucleate and crystallize at their surfaces. In many systems, the formation of nuclei is strongly preferred at the surface. The reason for this behavior is frequently considered to be due to the smaller energy required for elastic deformations.21 In this sense, it is not surprising that an as-cut surface leads to a higher crystal number density than a polished surface. Such behavior has been discussed in detail in glasses such as stoichiometric cordierite.21,22 At a rough surface, more sites exist where the required energy for material displacement is further reduced, i.e., at an edge or at a tip (compare with Fig. 2). Furthermore, Fig. 3 exactly represents this behavior. Therefore, nucleation and crystal growth start earlier and the total number of crystals is higher than at a polished surface (see also Fig. 7). Also, the possibility of a smaller interfacial energy being required if the interfacial energy crystal/glass is replaced by the interfacial energy crystal/gas atmospheres should not be disregarded.
A higher number density of nuclei leads to a higher number of growing crystals and consequently, the crystals should preferably grow with their fastest growing axis perpendicular to the surface because otherwise, the crystals, which have another orientation hinder each other during growth. Thus, at the same growth velocity, a somewhat thicker crystal layer should be formed.
Finally, since crystal growth is usually controlled by diffusion, higher temperatures should result in higher crystal growth velocities.
The theoretical peak positions of the desired crystal phase, which possess a negative thermal expansion, are shown in the pattern at the bottom of Fig. 4. Before thermal treatment, the sample shows just a broad halo at around 30°, which corresponds to the glass structure. Discrete peaks at other 2θ values are not observed and there are therefore no indications of residual raw materials or spontaneous crystallization during cooling of the glass melt. A heat treatment at 750 °C for 4 h results in numerous sharp diffraction peaks, which all are attributable to the desired BSZS crystal phase. Nevertheless, the halo at 30° is still visible. The crystalline layer is therefore just not thick enough to fully absorb the diffracted signals for the underlying glass. In contrast, the amorphous background signal completely disappears after heat treatment at 790 °C for 2 h. This agrees with the observation that the glassy structure could also be seen again if the same sample is powdered and examined. This is due to the fact that the crystals grown at the surface are mixed with the residual glass between the layers.
Since the structures in the powdered samples are comparable to those recorded from the sample surface, it could be concluded that the crystal phase growing into the glass matrix is the same as that grown at the glass surface.
Furthermore, additional peaks that could be attributed to other phases than the BSZS solid solutions are not observed.
The growth morphology at the top of the surface is shown in Fig. 5. After crystallization at a temperature of 750 °C maintained for 4 h, small isolated crystals were grown. In contrast, after crystallization at 790 °C, a few huge crystals were observed and a residual glassy phase in between the crystals could no longer be observed; the different numbers of the crystals at different treatment temperatures is striking. Obviously, at a crystallization temperature of 750 °C, the nuclei have more time to form, whereas at 790 °C, the crystal growth velocity is much higher and the complete surface is crystallized before numerous new nuclei may have formed. Supposedly, the nucleation rate does not increase with temperature in the same manner as the crystal growth velocity increases. Thus, the number of formed crystals is much higher after thermal treatment at 750 °C. This behavior was expected, following the nucleation and crystallization theory of glasses, where the temperature attributed to the maximum nucleation rate is lower than the temperature where a maximum crystal growth velocity is observed.23,24 The effect of the increased nucleation rate at a rough surface is shown in Fig. 5c and d. The numbers of the formed crystals are much higher for a surface that was rough. Caused by the cutting procedure, surface areas with high densities of edges, tips and fine glass grains are formed. These sites are known to result in a high nucleation rate because of the high number density of energetically favorable places.21,25 In contrast, a cutting morphology also reveals areas where crack propagation into the bulk occurs. These places are very smooth and lead to a very low nucleation rate. This could be a possible explanation for the inhomogeneous surface coverage shown in Fig. 5d.
A further special aspect of the crystallization is presented in Fig. 6. While a micrograph of the surface shows a fairly large number of crystals, in the cross section only one crystal is observed. This might be explained as follows: after a nucleus is formed, it grows along the surface with a depth of only a few nanometers. These crystals could not therefore be observed in the micrograph of a cross section, since the immediate surface layer could hardly be characterized by SEM, due to the superimposed edge effect. Hence, it could be assumed that the first formed crystals are aligned with their fastest growing axes parallel to the surface.
Fig. 7 shows the resulting morphology as an effect of the surface treatment for two different temperatures. The polished surface of the sample crystallized at 750 °C shows some isolated crystals. In comparison, at the as-cut surface, the number of grown crystals is much higher and consequently, due to the lack of space, the crystals are smaller. The surface roughness initiates nucleation caused by numerous, energetically more favorable positions at the edges and tips of the glass/atmosphere interface.17 However, the roughly cut surface also has very smooth areas caused by the conchoidal fracture of the glass. These areas do not contribute to the increased nucleation rate. Hence, the enhanced nucleating behavior does not result in a homogeneous distribution of the crystals at the surface (see Fig. 2).
The effect of as-cut and polished surfaces at a higher temperature (790 °C) is shown in Fig. 7c and d. If the crystallization temperature is increased to 790 °C, crystals grown from a polished surface become very large and reveal a ray-like morphology. Because of the large size of these structures, the formed crystal layer is uneven in thickness and the crystallized regions show a high number of cracks. In the case of the as-cut surface, the fine granular growth continues as already shown in Fig. 7b. However, the crystal size of the whole structure increases during growth into the bulk. It follows that in the regions near the surface, a growth selection takes place due to the large number of crystals; thus, at some distance from the surface, only a few crystals remain. Nevertheless, the resulting morphology is still narrower than that grown from the polished surface.
It has already been mentioned that the formed crystal phase has a large anisotropy concerning the thermal expansion along individual crystallographic axes. The thermal expansion is very large in the direction of the crystallographic c-axis, while it is strongly negative in the direction of the b-axis.
According to the EDXS map, the difference in chemical composition is low; hence, the grown crystals have a similar chemical composition. For this reason and in agreement with the XRD-patterns (see Fig. 4), ICSD file no. 429939 (Ba0.6Sr0.4Zn2Si2O7) is used for the EBSD indexing process. Furthermore, only this ICSD file results in the reliable indexing of the EBSD-patterns. As shown by EBSD, the orientation of the crystals is not statistical, but oriented. During growth of the crystals into the bulk, they become more and more oriented with their c-axes perpendicular to the surface, which is a strong hint at growth selection.
During the formation of crystals at the surface at temperatures well above the glass transition temperature of the glass, the glass-ceramic material should be free of stress because the glassy matrix is able to relax stress. During cooling, the contraction of the crystals is largest perpendicular to the surface, which is caused by the highest CTE in the direction of the crystallographic c-axis. It is therefore not surprising that the direction of the cracks is correlated to the strongly contracting crystallographic axis; hence, the crack is oriented according to the ray-like growing morphology, as seen in Fig. 7c. For this purpose, an EBSD analysis was carried out to determine the orientation of the grown crystals. Fig. 8 shows a superimposed SEM micrograph containing the information on the crystal orientation. Confirming this approach, the ray-like domains show the discrete correlation between c-axis and morphology.
Conclusions
The surface crystallization behavior in a system with the composition 8 BaO·8 SrO·34 ZnO·50 SiO2 has been studied using DSC, XRD, SEM, and LSM. Two different surface conditions where compared. On the one hand, a well-polished surface and on the other hand a surface as obtained after cutting. The influence of the surface pretreatment is correlated to size, morphology, frequency, and crystal growth rate. It has been found that not only does the number density of nuclei increase, but also the growth morphology is decisively changed if the surface remains unpolished. The growth rate is apparently higher, but this could be attributed to growth selection and the resulting more homogeneous layer thickness within the first microns. Also at the as-cut surfaces, differences in the number density of nucleation sites were found and explained by the presence of conchoidal fracture morphologies. In contrast to the polished surface, the crystals become larger and spread out simultaneously. Thus, a non-uniform layer thickness and surface coverage was obtained.A special growth mechanism was found where in the early stages of growth, crystals were spread parallel to the surface and afterwards they started growing into the volume of the glass; hence, the growth along the surface might initially be preferred.
Due to the strong anisotropy of the thermal expansion of the crystallized phase, the obtained glass ceramic is interspersed with cracks. The present study is the first where EBSD is successfully applied on glass ceramics with the crystal structure of Ba0.6Sr0.4Zn2Si2O7. It has been shown that the propagation direction of the cracks is correlated to the grown c-axes and their thermal expansion. Hence, the cracks are perpendicular to the c-axis, which is the crystallographic direction with the highest coefficient of thermal expansion. As oriented surface crystallization is found along the c axis of BSZS, cracks are mainly aligned parallel to the surface.
Conflicts of Interest
There are no conflicts of interest to declare.Acknowledgements
This study was funded by the German Federal Ministry of Education and Research under the grant numbers 03VP01701 and 03VP01702.References
- M. A. H. Gepreel, Key Eng. Mater., 2011, 495, 62–66 CrossRef.
- J. R. Salvador, F. Guo, T. Hogan and M. G. Kanatzidis, Nature, 2003, 425, 702–705 CrossRef CAS PubMed.
- K. Bauch, Low Thermal Expansion Glass Ceramics, Springer-Verlag Berlin Heidelberg, Berlin, Heidelberg, 2005 Search PubMed.
- T. A. Mary, J. S. O. Evans, T. Vogt and A. W. Sleight, Science, 1996, 272, 90–92 CAS.
- C. Thieme, H. Görls and C. Rüssel, Sci. Rep., 2015, 5, 18040 CrossRef CAS PubMed.
- J. Lin, G. Lu, J. Du, M. Su, C.-K. Loong and J. Richardson, J. Phys. Chem. Solids, 1999, 60, 975–983 CrossRef CAS.
- C. Thieme and C. Rüssel, Dalton Trans., 2016, 45, 4888–4895 RSC.
- M. Kracker, C. Thieme, J. Häßler and C. Rüssel, J. Eur. Ceram. Soc., 2016, 36, 2097–2107 CrossRef CAS.
- Y. Ohya, Z.-e. Nakagawa and K. Hamano, J. Am. Ceram. Soc., 1987, 70, C-184–C-186 CrossRef.
- S. Sakka, Applications of Sol-Gel Technology, Handbook of Sol-Gel Science and Technology. Processing, characterization and applications, Kluwer, Boston [u.a.], 2005, vol. 3 Search PubMed.
- L. Vladislavova, C. Thieme and C. Rüssel, J. Mater. Sci., 2017, 52, 4052–4060 CrossRef CAS.
- M. O. Prado, M. L. F. Nascimento and E. D. Zanotto, J. Non-Cryst. Solids, 2008, 354, 4589–4597 CrossRef CAS.
- U. Veit and C. Rüssel, Ceram. Int., 2016, 42, 5810–5822 CrossRef CAS.
- V. Reynoso, K. Yukimitu, T. Nagami, C. Carvalho, J. Moraes and E. Araújo, J. Phys. Chem. Solids, 2003, 64, 27–30 CrossRef CAS.
- M. J. Pascual, C. Lara and A. Durán, Phys. Chem. Glasses: Eur. J. Glass Sci. Technol., Part B, 2006, 47, 572–581 CAS.
- C. S. Ray and D. E. Day, Thermochim. Acta, 1996, 280–281, 163–174 CrossRef.
- J. Deubener and R. Brückner, J. Non-Cryst. Solids, 1997, 209, 96–111 CrossRef CAS.
- Y. Z. Yue, G. Carl and C. Rüssel, Glass: Sci. Technol., 1999, 72, 67–75 CAS.
- Y. Yue, C. Moisescu, G. Carl and C. Rüssel, Phys. Chem. Glasses, 1999, 40, 243–247 CAS.
- D. R. Askeland and W. Fahland, Materialwissenschaften, Spektrum Akad. Verl., Heidelberg, 1996 Search PubMed.
- J. Schmelzer, J. Möller, I. Gutzow, R. Pascova, R. Müller and W. Pannhorst, J. Non-Cryst. Solids, 1995, 183, 215–233 CrossRef CAS.
- V. M. Fokin, N. S. Yuritsin, V. N. Filipovich and A. M. Kalinina, J. Non-Cryst. Solids, 1997, 219, 37–41 CrossRef CAS.
- K. Thieme and C. Rüssel, J. Eur. Ceram. Soc., 2014, 34, 3969–3979 CrossRef CAS.
- W. Vogel, Glaschemie, Springer, Berlin, 3rd edn, 1992 Search PubMed.
- R. Müller, E. D. Zanotto and V. M. Fokin, J. Non-Cryst. Solids, 2000, 274, 208–231 CrossRef.
| This journal is © The Royal Society of Chemistry 2017 |

