 Open Access Article
Creative Commons Attribution 3.0 Unported Licence
Fast screening method to characterize lithium ion battery electrolytes by means of solid phase microextraction – gas chromatography – mass spectrometry
Fabian Horsthemkea,
Alex Friesena,
Xaver Mönnighoffa,
Yannick P. Stenzela,
Martin Grützkea,
Jan T. Anderssonb,
Martin Winterac and
Sascha Nowak *a
*a
aUniversity of Münster, MEET Battery Research Center, Institute of Physical Chemistry, Corrensstraße 46, 48149 Münster, Germany. E-mail: sascha.nowak@uni-muenster.de; Fax: +49-251-83-36032; Tel: +49-251-83-36735
bUniversity of Münster, Institute of Inorganic and Analytical Chemistry, Corrensstraße 30, 48149 Münster, Germany
cHelmholtz Institute Münster, IEK-12 FZ Jülich, Corrensstraße 46, 48149 Münster, Germany
First published on 5th October 2017
Abstract
Several electrolytes of commercially available lithium ion batteries (LIBs) were analyzed by solid phase microextraction – gas chromatography – mass spectrometry (SPME-GC-MS). The uptake and subsequent injection of the conducting salt LiPF6 into the GC system was prevented by using a headspace SPME setup. Thus, a removal step prior to the GC-MS measurements was not necessary and it was possible to analyze the untreated electrolyte without injecting the hazardous LiPF6 into the GC system. Furthermore, all SPME experiments were carried out at room temperature to exclude further thermal alteration of the electrolyte during sampling. In LIB electrolytes, different linear and cyclic carbonate solvents and additives such as succinonitrile (SN) and fluoroethylene carbonate (FEC) could be identified using the SPME-GC-MS setup. Moreover, the aging products dimethyl-2,5-dioxahexane dicarboxylate (DMDOHC) and ethylmethyl-2,5-dioxahexane dicarboxylate (EMDOHC) were identified in the electrolyte of aged 18![[thin space (1/6-em)]](https://www.rsc.org/images/entities/char_2009.gif) 650-type cells. In the case of the cells of one specific supplier, various additional hydrocarbons were detected via SPME-GC-MS. These compounds could not be obtained when a GC-MS setup with conventional liquid or headspace injection is used. Consecutive experiments were carried out by extracting the electrolyte components directly from the headspace above anode, separator and cathode of an aged 18
650-type cells. In the case of the cells of one specific supplier, various additional hydrocarbons were detected via SPME-GC-MS. These compounds could not be obtained when a GC-MS setup with conventional liquid or headspace injection is used. Consecutive experiments were carried out by extracting the electrolyte components directly from the headspace above anode, separator and cathode of an aged 18![[thin space (1/6-em)]](https://www.rsc.org/images/entities/char_2009.gif) 650-type cell, which confirmed the findings of the prior analysis of pure electrolytes. Within this work it was possible to develop a method for the investigation of LIB electrolytes and their decomposition products with high sensitivity and low GC column bleeding.
650-type cell, which confirmed the findings of the prior analysis of pure electrolytes. Within this work it was possible to develop a method for the investigation of LIB electrolytes and their decomposition products with high sensitivity and low GC column bleeding.
1. Introduction
Lithium ion batteries (LIBs) are the most applied electrochemical energy storage systems in portable electric devices as well as in electric vehicles.1,2 Furthermore, the shift from energy production by fossil fuels or nuclear power towards renewable energy sources requires stationary energy storage systems (=“grid batteries”).3 Therefore, the requirement for investigations regarding the improvement of existing systems and the development of new LIB technologies is of great importance.1 As the state-of-the-art LIB electrochemical voltage exceeds the stability window of aqueous electrolytes,4,5 mixtures of different aprotic, organic carbonates are used. Prominent examples are dimethyl carbonate (DMC), diethyl carbonate (DEC), ethylene carbonate (EC) and propylene carbonate (PC).6,7 These organic carbonate solvent mixtures provide a sufficient solubility regarding different lithium salts like LiPF6. Due to its overall performance, LiPF6 is commercially the most commonly applied conducting salt.6,7 Its solubility as well as the good Li ion mobility lead to an appropriate conductivity, but the electrolytes suffer from thermal and chemical decomposition already at slightly elevated temperatures.8,9 However, even the aprotic organic carbonates are not stable in the voltage window in which LIBs are operated.10 Due to the decomposition of the electrolyte during the first charge/discharge cycles (called formation cycles) an effective solid electrolyte interphase (SEI)11,12 is formed at the graphite anode surface. This layer protects the electrolyte from further decomposition. Analogously, depending on the cathode chemistry a protective layer is also formed at the cathode. This was first generally described for LiCoO2 by Thomas et al.13 and is nowadays with respect to the LIB chemistry referred to as cathode electrolyte interphase (CEI).14 These protective surface layers prevent severe aging effects at and on the electrode surfaces with ongoing cycling.6,15 However, for aging studies it is an intricate task to identify the affiliation of a compound. Especially the boundary between these surface layers and the electrolyte is indistinct.16,17To monitor the aging effects in LIB electrolytes, different mechanisms like calendar, thermal and cyclic aging were evaluated in previous studies. Therefore, a variety of analytical methods, for instance differential scanning calorimetry (DSC),18 nuclear magnetic resonance spectroscopy (NMR),19,20 ion chromatography (IC),21–23 high performance liquid chromatography (HPLC)24,25 and GC26–31 were applied. Various aging products e.g. the transesterification products of the carbonates like dimethyl-2,5-dioxahexane dicarboxylate (DMDOHC), different organo fluorophosphates (OFPs) and organo phosphates (OPs) were detected and presented in the literature.9,27,29,32 As the OFPs are known for their high toxicity33,34 a determination of their presence is important in the LIB context.27,35–38 Furthermore, a variety of different pathways regarding the formation of common aging products in LIB electrolytes as well as the formation of the passivation layers are discussed in literature.9,27,28
Recent publications report on the extraction of electrolytes from the jelly roll of commercially available LIBs with supercritical and subcritical CO2.26,31,32,38,39 One of the advantages of these methods associated with the study of aging products is that LiPF6 is not extracted by CO2 without co-solvent.26,32 Due to this advantage subsequent gas chromatographic (GC) measurements are not interfered by the presence of LiPF6. The conducting salt preferably reacts with silicon containing parts of injection unit and GC columns, leading to severe column bleeding. Another approach in order to prevent column bleeding related to the analysis of electrolyte samples with GC-MS systems includes the dilution of the electrolytes with dichloromethane (DCM). The low solubility of LiPF6 in DCM leads to a precipitation of the conducting salt which can subsequently be separated.27
A different extraction method which provides the possibility for a direct hyphenation to GC systems is the solid phase microextraction (SPME) developed by Arthur, Belardi and Pawliszyn.40,41 The SPME fibers can be directly immersed into a liquid, exposed to gases/air or the headspace above a solid or liquid sample.42,43 Due to the geometry of the SPME fibers, a direct transfer to the GC-system is possible.44 The method is used in different analytical fields, e.g. when investigating traces of pesticides45,46 or in food analysis.47,48 In case of headspace SPME, the fibers do not touch the liquid sample and a direct uptake of the conducting salts like LiPF6 is prevented. Furthermore, the extraction behavior of different fiber materials with respect to their uptake rates of different OPs from gaseous samples was investigated by Isetun et al.49,50
This work reports on the use of SPME-GC-MS for the detection and identification of volatile organic aging products emerging in commercially available LIBs. It had to be ascertained that the compounds studied are distributed into the SPME phase from the organic electrolyte. Furthermore, the uptake of the aging products from undiluted electrolytes as well as solid LIB components was examined.
2. Experimental
2.1. Chemicals and materials
The cells investigated in this study were fabricated by different suppliers and exhibit different cell chemistries. All cells were of the 18![[thin space (1/6-em)]](https://www.rsc.org/images/entities/char_2009.gif) 650-type and purchased from BattEnergy (Germany). The different cells sorted by the suppliers are shown in Table 1. The organic carbonates DMC (>99%), EMC (99.0%), DEC (99.9%) and EC (99.9%) as well as the GC grade DCM (99.8%) and succinonitrile (SN) (99.0%) were purchased from Merck (Germany). Fluoroethylene carbonate (FEC) (99.0%), n-dodecane (99%) and the isododecane [mixture of isomers] (≥80%) were bought from Sigma Aldrich (USA); DMDOHC (98%) and triethyl phosphate (TEP) (98%) from abcr chemicals (Germany).
650-type and purchased from BattEnergy (Germany). The different cells sorted by the suppliers are shown in Table 1. The organic carbonates DMC (>99%), EMC (99.0%), DEC (99.9%) and EC (99.9%) as well as the GC grade DCM (99.8%) and succinonitrile (SN) (99.0%) were purchased from Merck (Germany). Fluoroethylene carbonate (FEC) (99.0%), n-dodecane (99%) and the isododecane [mixture of isomers] (≥80%) were bought from Sigma Aldrich (USA); DMDOHC (98%) and triethyl phosphate (TEP) (98%) from abcr chemicals (Germany).
| Abbreviation | Cell identifier | Nominal capacity |
|---|---|---|
| Supplier 1.1 | Samsung ICR 18650 22P | 2050 mA h (minimum) |
| Supplier 1.2 | Samsung ICR 18650 26H | 2550 mA h (minimum) |
| Supplier 1.3 | Samsung ICR 18650 22F | 2200 mA h |
| Supplier 2.1 | Panasonic NCR 18650 PD | 2750 mA h (minimum) |
| Supplier 3.1 | Molicel IHR 18650 BN | 2100 mA h (minimum) |
2.2. Cycling procedure
The cycling of the supplier 1.1 cells for the proof-of-principle experiments was performed with a Maccor Series 4000 Battery Tester (Maccor, Inc., USA) in a Binder MK 240 climate test chamber (BINDER GmbH, Germany) at constant chamber temperatures of 0 °C. The cycling protocol consisted of a constant current/constant voltage (CC/CV) charge followed by a CC discharge in the full voltage window between 4.2 V and 2.75 V according to the material safety data sheets (MSDS). The CC step was performed with 1C (2.2 A) and the CV step until the current fell below C/20. The end-of-life (EOL) criterion was defined as a state-of-health (SOH) of less than or equal to 70%.The supplier 1.1 cells for the aging experiment were cycled at constant chamber temperatures of 20 °C. The same cycling protocol as described above was applied with the exception of the C-rates during discharge and the EOL, which was an SOH of 80%. The applied C-rates for the CC step during discharge were 1C, 3C and 4.55C respectively. The 4.55C results from the MSDS which states 10 A as the upper limit of the discharge step of this specific cell format.
All cells were discharged to 2.75 V with a CC/CV protocol prior to the sample preparation.
2.3. Sample preparation
For the proof-of-principle experiments, 1000 ppm TEP (v/v) and 100 ppm DEC (v/v) were spiked on a mixture of DMC/EC (1![[thin space (1/6-em)]](https://www.rsc.org/images/entities/char_2009.gif) :
:![[thin space (1/6-em)]](https://www.rsc.org/images/entities/char_2009.gif) 1; w/w).
1; w/w).
The cells were opened in a glovebox (O2, H2O ≤ 0.1 ppm) by cutting off the caps on both ends of the cell housing with an in-house-made cutter similar to Aurbach et al.30 In order to investigate the remaining liquid electrolyte the jelly roll was transferred into a 50 mL tube and centrifuged for 30 min at 4200 rpm with a centrifuge from Sigma (Germany).
For the separate investigation of anode, separator and cathode, one aged jelly roll was partially uncoiled in a dry room (dew point: −65 °C; H2O < 5.4 ppm). Square sheets (1 × 1 cm) were cut out of the three different components and then transferred into headspace vials.
2.4. Analytical equipment
The alkane standards were measured as pure samples with extraction times of 10 s.
The solid samples were transferred to headspace vials and extracted without stirring. All other parameters were kept as described in the previous paragraph.
The GC-MS measurements were done with a Shimadzu GCMS-QP2010 Ultra single quadrupole (SQ) equipped with an AOC 5000 Plus autosampler. A nonpolar Supelco SLB™-5ms (30 m × 0.25 mm × 0.25 μm) column was used. The system was controlled by the GCMS Real Time Analysis with implemented Cycle Composer for an AOC 5000 Plus autosampler (both Shimadzu). The chromatograms were analyzed with GCMS Postrun Analysis (Shimadzu). Compounds were validated with NIST 11 library. DMC, EMC, DEC, FEC, EC, SN, DMDOHC and n-dodecane were additionally confirmed by the comparison of their retention times and fragment patterns with commercially available standards. The presence of EMDOHC was determined according to Grützke et al.32 The different isoalkanes were compared with a standard solution regarding their fragment patterns and retention times. Helium (6.0 purity, Westfalen Gas, Germany) was used as carrier gas with 1.16 mL min−1 column flow and 3 mL min−1 purge flow. The temperature program started at 40 °C which was held for 1 min. Afterwards, temperature ramps with 3 °C min−1 until 60 °C and 30 °C min−1 until 260 °C followed. The final temperature was held for 2 min.
The overall measurement time was 16.32 min with a mass range from 20–350 m/z and an event time of 0.1 s in scan mode. The mass spectrometer was run in the electron impact ionization (EI) mode with the following parameters: the temperature of the ion source was set to 200 °C; the interface was held at 250 °C and the filament was operated at a voltage of 70 V; the detector voltage was set relative to the respective tuning results.
![[thin space (1/6-em)]](https://www.rsc.org/images/entities/char_2009.gif) 000. The mass spectrometer was run in EI mode with an ion source temperature of 200 °C and a transfer line temperature of 250 °C. The filament was operated at 70 V. The oven program was chosen to be the same with the experiments on the SQ. The fiber was manually introduced into the GC injector and the extraction time was 1 min with a split ratio of 1
000. The mass spectrometer was run in EI mode with an ion source temperature of 200 °C and a transfer line temperature of 250 °C. The filament was operated at 70 V. The oven program was chosen to be the same with the experiments on the SQ. The fiber was manually introduced into the GC injector and the extraction time was 1 min with a split ratio of 1![[thin space (1/6-em)]](https://www.rsc.org/images/entities/char_2009.gif) :
:![[thin space (1/6-em)]](https://www.rsc.org/images/entities/char_2009.gif) 10.
10.3. Results and discussion
The first proof-of-principle experiments were done with TEP which is known in literature to be an aging product of LIB electrolytes27 and a suitable analyte for SPME to be extracted from gaseous samples.49,50 TEP was diluted in EC/DMC (1![[thin space (1/6-em)]](https://www.rsc.org/images/entities/char_2009.gif) :
:![[thin space (1/6-em)]](https://www.rsc.org/images/entities/char_2009.gif) 1 by weight) in order to examine the uptake from the headspace over an organic matrix by SPME. The matrix was chosen to be similar to the carbonate based mixtures used in state-of-the-art LIB electrolytes. In addition to TEP, DEC was spiked to compare the different uptake rates. Furthermore, DEC is known to be an aging product emerging during cycling in DMC/EC based electrolytes.28 As already described in literature the PDMS fibers showed better uptake rates for TEP than acrylate fibers. However, the PDMS fibers cannot be utilized with electrolyte samples. The fluoride containing conducting salt LiPF6 is in equilibrium with LiF and PF5, which leads to the formation of traces of PF5 even at room temperature. Subsequently, the gaseous compounds react with the silicon of the fiber material. This results in fiber bleeding even after short extraction times. Therefore, all following experiments were performed with acrylate fibers. The uptake behavior of DEC (m/z: 45) and TEP (m/z: 155) is shown in Fig. 1, where the corresponding peak area of each compound was evaluated as a function of the extraction time, using acrylate fibers. For the analytes two different behaviors were observed. In case of DEC, it was shown that the peak area increases as a function of time until a plateau is reached at approximately 30 min. Extended extraction times did not render increases in peak areas, suggesting that the fibers may have reached an equilibrium. In contrast, the TEP amount increases even after extraction times of over 1.5 h. However, extractions exceeding 1.5 h led to high standard deviations and in some cases to fiber swelling resulting in a destroyed coating. Furthermore, extraction times beyond 30 min with LiPF6 containing samples caused fiber bleeding. In these cases the gaseous PF5 was presumably able to pass through the acrylate coating and reach the silicon containing backbone of the fiber. Therefore, an extraction time of 10 min was established as a balanced analysis regarding work flow, an appropriate uptake of the analytes and fiber stability.
1 by weight) in order to examine the uptake from the headspace over an organic matrix by SPME. The matrix was chosen to be similar to the carbonate based mixtures used in state-of-the-art LIB electrolytes. In addition to TEP, DEC was spiked to compare the different uptake rates. Furthermore, DEC is known to be an aging product emerging during cycling in DMC/EC based electrolytes.28 As already described in literature the PDMS fibers showed better uptake rates for TEP than acrylate fibers. However, the PDMS fibers cannot be utilized with electrolyte samples. The fluoride containing conducting salt LiPF6 is in equilibrium with LiF and PF5, which leads to the formation of traces of PF5 even at room temperature. Subsequently, the gaseous compounds react with the silicon of the fiber material. This results in fiber bleeding even after short extraction times. Therefore, all following experiments were performed with acrylate fibers. The uptake behavior of DEC (m/z: 45) and TEP (m/z: 155) is shown in Fig. 1, where the corresponding peak area of each compound was evaluated as a function of the extraction time, using acrylate fibers. For the analytes two different behaviors were observed. In case of DEC, it was shown that the peak area increases as a function of time until a plateau is reached at approximately 30 min. Extended extraction times did not render increases in peak areas, suggesting that the fibers may have reached an equilibrium. In contrast, the TEP amount increases even after extraction times of over 1.5 h. However, extractions exceeding 1.5 h led to high standard deviations and in some cases to fiber swelling resulting in a destroyed coating. Furthermore, extraction times beyond 30 min with LiPF6 containing samples caused fiber bleeding. In these cases the gaseous PF5 was presumably able to pass through the acrylate coating and reach the silicon containing backbone of the fiber. Therefore, an extraction time of 10 min was established as a balanced analysis regarding work flow, an appropriate uptake of the analytes and fiber stability.
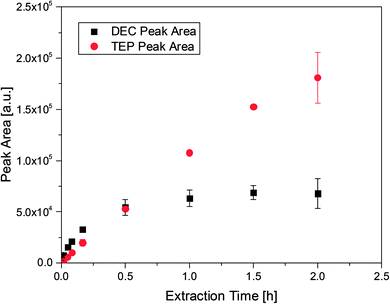 | ||
Fig. 1 Peak areas and deviations for 100 ppm DEC and 1000 ppm TEP at different extraction times, obtained with acrylate fibers and a split ratio of 1![[thin space (1/6-em)]](https://www.rsc.org/images/entities/char_2009.gif) : :![[thin space (1/6-em)]](https://www.rsc.org/images/entities/char_2009.gif) 100. 100. | ||
The first experiments with electrolyte from commercially available 18![[thin space (1/6-em)]](https://www.rsc.org/images/entities/char_2009.gif) 650-type cells were done with supplier 1.1 cells, which were only formatted by the supplier, i.e. were in the electrochemical condition after shipment. The chromatogram of the GC-MS measurement with liquid injection (Fig. 2) showed five peaks. The peaks were assigned to the two linear carbonates DMC and EMC, the cyclic carbonate EC and the additives FEC and SN. Fig. 3 shows the corresponding chromatogram of the same electrolyte analyzed by SPME-GC-MS. The retention times above 4 min is additionally shown as magnified excerpt. All analytes detected with the state-of-the-art-method were also obtained when using the SPME setup. Since the linear carbonates provide a high vapor pressure6 compared with the other electrolyte components, their concentration in the headspace is higher. Thus, they are likely to be absorbed by the SPME fiber in larger amounts. Therefore, their signal heights increase when the SPME setup is used instead of liquid injection. However, even EC, which has a low vapor pressure at room temperature, was accessible by using the SPME setup and exhibits intensities in the same range as the liquid injections. In addition, an electrolyte of an aged cell was analyzed by means of SPME-GC-MS. In order to achieve accelerated aging, the cell was cycled at 0 °C.51,52 The charge and discharge capacities as function of the cycle number are shown in Fig. 4. The capacities show a fast decrease until the EOL (70%) was reached after 11 cycles. A comparison between the pristine and the aged electrolyte analyzed with SPME-GC-MS is depicted in Fig. 5. The chromatogram of the pristine electrolyte shows distinct peaks for FEC, EC and SN, whereas DMC and EMC eluted before the solvent cut. Furthermore, a group of compounds eluting between 10 and 12 min was detected, which will be discussed in a following paragraph. The aged electrolyte shows a peak eluting at 4.5 min, which corresponds to DEC. Moreover, in the aged electrolyte the FEC and its corresponding peak at 7 min was not detected anymore. In addition to EC and SN two peaks eluting at 11.5 and 12 min were obtained. These peaks were assigned to DMDOHC and EMDOHC, respectively. DEC is known to be an aging product formed e.g. by a transesterification of EMC during cyclic aging.30 FEC is known as electrolyte additive to improve SEI formation and is consumed during this process.52 Moreover, SN was detected in both the cycled and the uncycled electrolyte which is consistent with the fact that SN is used as an additive to enhance the electrolyte performance at elevated temperatures53,54 and when applying high cutoff voltages.54,55 Thus, the disappearance of FEC and the remaining SN peak in case of the aged electrolyte is in agreement with the results of Friesen et al.52
650-type cells were done with supplier 1.1 cells, which were only formatted by the supplier, i.e. were in the electrochemical condition after shipment. The chromatogram of the GC-MS measurement with liquid injection (Fig. 2) showed five peaks. The peaks were assigned to the two linear carbonates DMC and EMC, the cyclic carbonate EC and the additives FEC and SN. Fig. 3 shows the corresponding chromatogram of the same electrolyte analyzed by SPME-GC-MS. The retention times above 4 min is additionally shown as magnified excerpt. All analytes detected with the state-of-the-art-method were also obtained when using the SPME setup. Since the linear carbonates provide a high vapor pressure6 compared with the other electrolyte components, their concentration in the headspace is higher. Thus, they are likely to be absorbed by the SPME fiber in larger amounts. Therefore, their signal heights increase when the SPME setup is used instead of liquid injection. However, even EC, which has a low vapor pressure at room temperature, was accessible by using the SPME setup and exhibits intensities in the same range as the liquid injections. In addition, an electrolyte of an aged cell was analyzed by means of SPME-GC-MS. In order to achieve accelerated aging, the cell was cycled at 0 °C.51,52 The charge and discharge capacities as function of the cycle number are shown in Fig. 4. The capacities show a fast decrease until the EOL (70%) was reached after 11 cycles. A comparison between the pristine and the aged electrolyte analyzed with SPME-GC-MS is depicted in Fig. 5. The chromatogram of the pristine electrolyte shows distinct peaks for FEC, EC and SN, whereas DMC and EMC eluted before the solvent cut. Furthermore, a group of compounds eluting between 10 and 12 min was detected, which will be discussed in a following paragraph. The aged electrolyte shows a peak eluting at 4.5 min, which corresponds to DEC. Moreover, in the aged electrolyte the FEC and its corresponding peak at 7 min was not detected anymore. In addition to EC and SN two peaks eluting at 11.5 and 12 min were obtained. These peaks were assigned to DMDOHC and EMDOHC, respectively. DEC is known to be an aging product formed e.g. by a transesterification of EMC during cyclic aging.30 FEC is known as electrolyte additive to improve SEI formation and is consumed during this process.52 Moreover, SN was detected in both the cycled and the uncycled electrolyte which is consistent with the fact that SN is used as an additive to enhance the electrolyte performance at elevated temperatures53,54 and when applying high cutoff voltages.54,55 Thus, the disappearance of FEC and the remaining SN peak in case of the aged electrolyte is in agreement with the results of Friesen et al.52
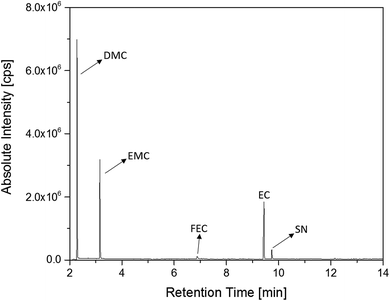 | ||
Fig. 2 Chromatogram of a pristine electrolyte from a supplier 1.1 cell. GC-MS measurements were carried out with liquid injection and a split ratio of 1![[thin space (1/6-em)]](https://www.rsc.org/images/entities/char_2009.gif) : :![[thin space (1/6-em)]](https://www.rsc.org/images/entities/char_2009.gif) 100. 100. | ||
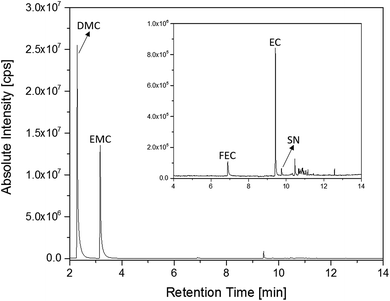 | ||
Fig. 3 Chromatogram of an electrolyte from a pristine supplier 1.1 cell measured with an SPME-GC-MS setup and a split ratio of 1![[thin space (1/6-em)]](https://www.rsc.org/images/entities/char_2009.gif) : :![[thin space (1/6-em)]](https://www.rsc.org/images/entities/char_2009.gif) 100. The area from retention times of 4 min to 14 min is magnified. 100. The area from retention times of 4 min to 14 min is magnified. | ||
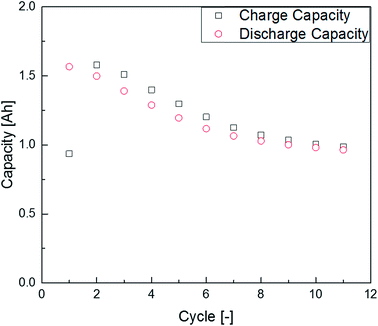 | ||
| Fig. 4 Charge and discharge capacities of the supplier 1.1 cell at 0 °C during the applied cyclic aging procedure. | ||
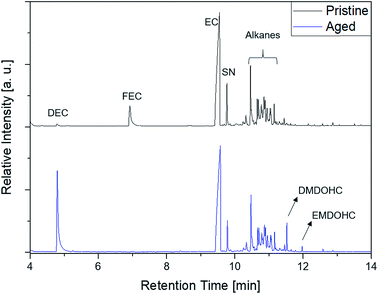 | ||
Fig. 5 Comparison of a pristine (black, top) and an aged (blue, bottom) electrolyte from supplier 1.1 cells measured with an SPME-GC-MS setup and a split ratio of 1![[thin space (1/6-em)]](https://www.rsc.org/images/entities/char_2009.gif) : :![[thin space (1/6-em)]](https://www.rsc.org/images/entities/char_2009.gif) 10. 10. | ||
Considering DMC, EMC and EC as matrix and the additives as analytes, there was no extraction feasible. On the contrary, peak areas of DMC and EMC even increased in relation to the peak areas of the additives. Thus, a behavior of the matrix to analyte as described for organic compounds in aqueous matrices by Arthur41 et al. could not be achieved. This is not surprising since LIB electrolyte matrices and analytes are mainly organic compounds. However, an injection of the conducting salt, a major part of the electrolyte (10–15 wt%, depending on the cell chemistry and geometry), into the GC system is prevented. Therefore, the removal of the conduction salt e.g. by extracting the electrolyte with sc. CO2 or by dilution in DCM as sample preparation step prior to the GC-MS measurement is not required when using SPME.26,27 Thus, the sample preparation was shortened and it was possible to apply a lower split ratio without causing column bleeding (Fig. 5). However, the utilization of a low split ratio leads to a severe increase of the carbonate signals. Thus, the method requires a shutdown of the filaments during the elution of the linear carbonates used as solvents in the respective electrolyte.
The SPME experiments for the cell of supplier 1.1 showed various peaks in the range of 10 to 12 min. These peaks were not obtained when using the setup with liquid injection. In order to exclude an introduction of these compounds as contaminants during the sample preparation, cells with different cell chemistries from supplier 1 as well as cells from two other suppliers (suppliers 2 and 3) were investigated. Fig. 6 displays the excerpts from 10 to 12 min of the chromatograms obtained from all discussed commercially available cells. However, the chromatograms of the cells from supplier 1 show compounds eluting in this timeframe. As the cells manufactured by suppliers 2 and 3 exhibit a different behavior a contamination resulting from the sample preparation procedure could be excluded. However, these compounds were present in every cell manufactured by supplier 1 even with the same slope in the chromatograms. Unfortunately, the different compounds could not be baseline separated. All fragment patterns of the different compounds showed several fragments with differences of 14 m/z, which are likely to result from a loss of CH2 groups and give a hint that the compounds consist, at least partially, of alkane-type structures. Furthermore, the electrolyte from all cells manufactured by supplier 1 reveal similar fragment patterns for peaks with the same retention times. However, the compounds do not seem to act as substrates in cell aging, since appearing in both the aged and the uncycled electrolyte.
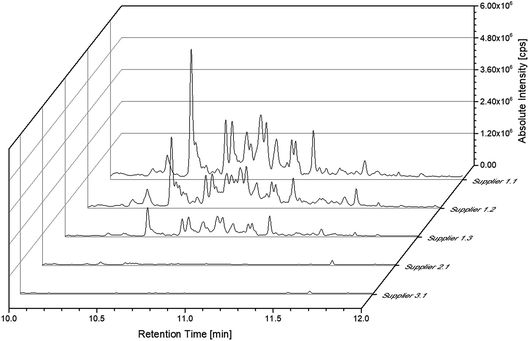 | ||
Fig. 6 Chromatograms of all discussed commercially available cells. The chromatograms were obtained with the SPME-GC-MS system and a split ratio of 1![[thin space (1/6-em)]](https://www.rsc.org/images/entities/char_2009.gif) : :![[thin space (1/6-em)]](https://www.rsc.org/images/entities/char_2009.gif) 10. 10. | ||
A more detailed investigation of these compounds revealed that they belong to the alkane group without other functional groups or cyclic domains. Moreover, measurements with GC-HR-MS made the exact masses for the corresponding fragments from the SQ measurements accessible. A comparison of the masses obtained by the SQ-MS and the HR-MS is displayed in Table 2. A calculation of these exact masses with a mass calculator suggests CxHy type fragments.56 However, the separation and the peak heights of the alkanes in the GC-HR-MS was not comparable peak by peak with the results achieved by SQ. An automation of the SPME device with an autosampler and further method development is currently in process. In order to get a better classification of the chain length of these compounds n-dodecane was measured as standard. Fig. 7 shows the n-dodecane as major peak for the standard solution, which is displayed as overlay with the alkane fraction of the electrolytes. The peak at 12.7 min which is present in both chromatograms resulted from the system and the compound is assigned as an impurity emerging from acrylate fiber materials.57 n-Dodecane elutes at a later retention time than most of the other alkanes in the sample. The alkane fraction in the electrolyte shows a peak eluting at the same retention time as the n-dodecane. In addition, the fragment patterns of the standard and the corresponding peak in the electrolyte are depicted in the same figure showing identical fragments. The identical retention times and fragment patterns lead to the conclusion that n-dodecane is present in the electrolyte. Taking into account that n-alkanes typically elute later than branched alkanes with the same molecular formula, the chain length of the alkanes found in the sample can be narrowed down to C11H24 to C13H28. Therefore, an isododecane standard was measured and compared with the alkane compounds. An overlay of the measurements is shown as excerpt in Fig. 8. The isododecane mixture shows various peaks in the area of interest. The main compound of the isododecane standard shows a shorter retention time than all compounds found in the electrolytes. Therefore, the peak which elutes at 10.09 min is not included in the chromatogram. However, some of the minor components present in the isododecane mixture show an overlap with the sampled alkanes. The fragment patterns of compounds with the same retention time as well as similar fragment patterns are displayed in Fig. 9.
| m/z (SQ) | m/z (orbitrap) | m/z calculated | Molecular formula | Deviation [ppm] |
|---|---|---|---|---|
| 57 | 57.07005 | 57.07043 | C4H9 | 6.6 |
| 71 | 71.08552 | 71.08608 | C5H11 | 7.8 |
| 85 | 85.10118 | 85.10173 | C6H13 | 6.4 |
| 99 | 99.11684 | 99.11738 | C7H15 | 5.4 |
| 113 | 113.13248 | 113.13303 | C8H17 | 4.8 |
| 127 | 127.14881 | 127.14868 | C9H19 | 1.1 |
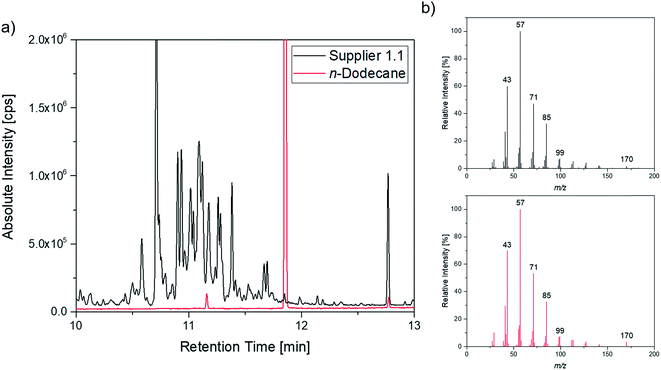 | ||
Fig. 7 (a) Overlay of the chromatogram of a supplier 1.1 cell (black; 1![[thin space (1/6-em)]](https://www.rsc.org/images/entities/char_2009.gif) : :![[thin space (1/6-em)]](https://www.rsc.org/images/entities/char_2009.gif) 10 split) and the n-dodecane standard (red; 1 10 split) and the n-dodecane standard (red; 1![[thin space (1/6-em)]](https://www.rsc.org/images/entities/char_2009.gif) : :![[thin space (1/6-em)]](https://www.rsc.org/images/entities/char_2009.gif) 100 split); (b) corresponding fragment patterns of the peak eluting at 11.85 min. 100 split); (b) corresponding fragment patterns of the peak eluting at 11.85 min. | ||
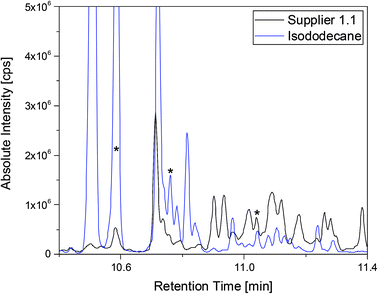 | ||
Fig. 8 Chromatograms of a supplier 1.1 cell (black) and the isododecane standard (blue) shown as overlay. Both measurements were executed with a 1![[thin space (1/6-em)]](https://www.rsc.org/images/entities/char_2009.gif) : :![[thin space (1/6-em)]](https://www.rsc.org/images/entities/char_2009.gif) 10 split and the fragment patterns of the peaks marked with asterisks are displayed in Fig. 9. 10 split and the fragment patterns of the peaks marked with asterisks are displayed in Fig. 9. | ||
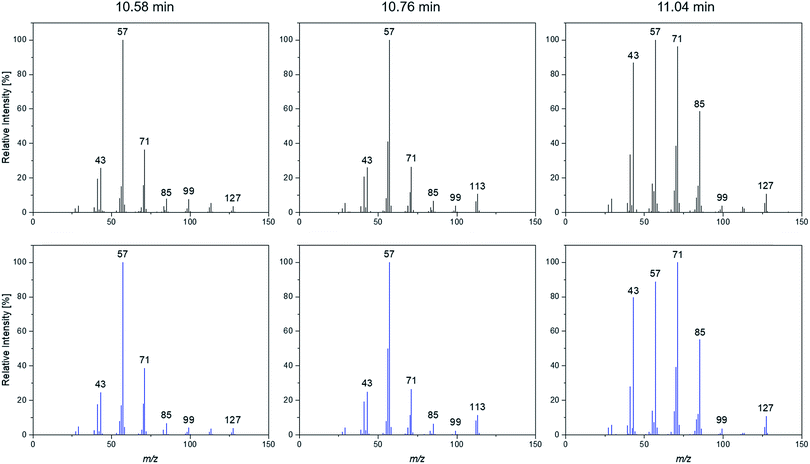 | ||
| Fig. 9 Fragmentation patterns of the peaks marked with an asterisk shown in Fig. 8. | ||
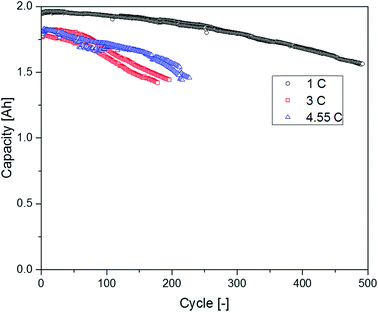
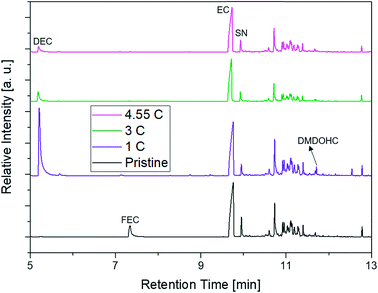
The supplier 1.1 cells aged at different C-rates showed a completely different behavior regarding their capacity retention (Fig. 10). The cells discharged at 1C exhibited the best capacity retention and reached the highest cycle number until the EOL was reached. The cells discharged with 3C had a clearly decreased cycle number until an SOH of 80% was reached. Surprisingly, the cells cycled at 4.55C showed a better capacity retention profile again leading to higher cycle numbers in comparison with the cells aged at 3C. In the chromatograms displayed in Fig. 11, the FEC peak eluting at 7.3 min is only visible in the pristine electrolyte. However, EC, SN and the alkanes show a response for all different electrolytes. Furthermore, the peaks assigned to DEC, DMDOHC and EMDOHC are present in all cycled electrolytes. They show their most intense response in the electrolyte discharged at 1C. The FEC was consumed during cycling which is typical for an SEI-forming additive. However, in the electrolytes aged at 3 and 4.55C a small response resulting from FEC residues could be obtained. Except for the pristine electrolyte, all electrolytes contained DMDOHC and EMDOHC. The highest amount of the three discussed degradation products was detected in the cell cycled at 1C. On the other hand, there are only minor differences between the chromatograms of both electrolytes aged at high C-rates. However, the chromatogram of the cell cycled at 1C exhibits distinct differences to all other electrolytes. In addition to the completely vanished FEC peak, the DEC peak eluting at 5.2 min has increased drastically. Considering the absence of FEC and the higher cycle number of this cell, the origin of the degradation products DEC, DMDOHC and EMDOHC might have been cracks in the FEC supported SEI which could not be sealed again.
The DEC content seems to be in the same range for both cells cycled with 1C (0 °C and 20 °C) and for both cells no FEC peak could be detected. However, the cycle numbers of these cells differ drastically. According to Friesen et al. for cells cycled at 0 °C the aging of the electrolyte and especially the FEC consumption is strongly accelerated. The aging happens in this case mostly at the surface of high surface area lithium (HSAL) which was plated on top of the anode.52 Therefore, the much faster DEC formation (<20 cycles) in this case might be due to the higher available surface or a higher reactivity at metallic lithium.
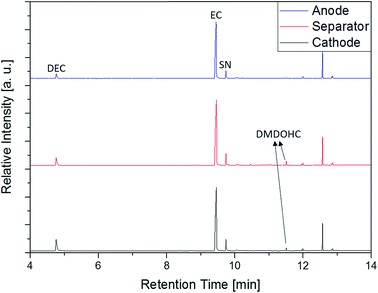
In addition to the experiments with the electrolyte, anode, cathode and separator of the aged (0 °C) supplier 1.1 cell were directly investigated with the SPME-GC-MS setup. The results of these measurements are displayed in Fig. 12. The chromatograms show four peaks of interest assigned to DEC, EC, SN and DMDOHC, respectively. EMDOHC was identified for the three samples as well but provided a smaller peak in the chromatogram. Only the alkane-type compounds described in the previous paragraph could not be detected. Except of the alkanes, all compounds detected in the prior discussed experiments with the pure electrolyte were accessible. Since the SPME method is based on the equilibrium occurring between the sample and the fiber, the different sample type has to be taken into account. Thus, a prolonged extraction time as well as an increased amount of the sample could be beneficial for the measurements of the different solid components. However, this setup provides the possibility to screen an electrolyte for aging products with simplified and timesaving sampling procedure. Furthermore, the method enables the investigation of electrolytes from ‘dry’ cells at room temperature without prior solvent extraction. Thus, the probability of a carryover of potential SEI components into the analyzed medium is most likely impeded.
4. Conclusions
The electrolytes of different commercially available 18![[thin space (1/6-em)]](https://www.rsc.org/images/entities/char_2009.gif) 650-type cells were investigated with a SPME-GC-MS setup at room temperature. The acrylate fibers were exposed to the headspace above the samples. Thus, subsequent reactions of the conducting salt in the GC system were prevented and a destruction of the column inhibited. Furthermore, all compounds detected using the GC-MS setup with liquid injection were also accessible with the SPME-GC-MS setup. However, to detect compounds of low vapor pressure a decrease of the split ratio was necessary. This necessitated that the filament had to be turned off during the elution of the linear carbonates used as solvents to protect the MS system from an overload. In case of the supplier 1 18
650-type cells were investigated with a SPME-GC-MS setup at room temperature. The acrylate fibers were exposed to the headspace above the samples. Thus, subsequent reactions of the conducting salt in the GC system were prevented and a destruction of the column inhibited. Furthermore, all compounds detected using the GC-MS setup with liquid injection were also accessible with the SPME-GC-MS setup. However, to detect compounds of low vapor pressure a decrease of the split ratio was necessary. This necessitated that the filament had to be turned off during the elution of the linear carbonates used as solvents to protect the MS system from an overload. In case of the supplier 1 18![[thin space (1/6-em)]](https://www.rsc.org/images/entities/char_2009.gif) 650-type cells, new compounds were accessible using the SPME-GC-MS setup. These compounds have a very high affinity towards acrylate fibers and belong to the alkane group; n-dodecane was identified. Some other detected alkanes were also present in an isododecane mixture. The identification of these compounds is the topic of ongoing research. A baseline separation of the alkanes might be achieved by a two-dimensional GC experiments or a column with higher capacity. Experiments with automated SPME on GC-HR-MS systems and chemical ionization have to be performed in order to precisely identify the compounds. Furthermore, the SPME setup enables a direct analysis of the electrolyte from the different solid cell components. Thereby, possible differences between the aging processes on anodes and cathodes may be accessible. Overall, a method was developed that benefits from a basic, time saving sample preparation with the ability to screen all components of interest.
650-type cells, new compounds were accessible using the SPME-GC-MS setup. These compounds have a very high affinity towards acrylate fibers and belong to the alkane group; n-dodecane was identified. Some other detected alkanes were also present in an isododecane mixture. The identification of these compounds is the topic of ongoing research. A baseline separation of the alkanes might be achieved by a two-dimensional GC experiments or a column with higher capacity. Experiments with automated SPME on GC-HR-MS systems and chemical ionization have to be performed in order to precisely identify the compounds. Furthermore, the SPME setup enables a direct analysis of the electrolyte from the different solid cell components. Thereby, possible differences between the aging processes on anodes and cathodes may be accessible. Overall, a method was developed that benefits from a basic, time saving sample preparation with the ability to screen all components of interest.
Conflicts of interest
There are no conflicts to declare.Acknowledgements
The authors would like to thank the Federal Ministry of Education and Research for funding the project Elektrolytlabor 4e (03X4632).References
- M. Dresselhaus and I. Thomas, Nature, 2001, 414, 332–337 CrossRef CAS PubMed.
- F. Schipper and D. Aurbach, Russ. J. Electrochem., 2016, 52, 1095–1121 CrossRef CAS.
- R. Banos, F. Manzano-Agugliaro, F. Montoya, C. Gil, A. Alcayde and J. Gómez, Renewable Sustainable Energy Rev., 2011, 15, 1753–1766 CrossRef.
- J.-Y. Luo, W.-J. Cui, P. He and Y.-Y. Xia, Nat. Chem., 2010, 2, 760–765 CrossRef CAS PubMed.
- M. Winter and J. O. Besenhard, Chem. Unserer Zeit, 1999, 33, 252 CrossRef CAS.
- K. Xu, Chem. Rev., 2004, 104, 4303–4418 CrossRef CAS PubMed.
- M. Ue and S. Mori, J. Electrochem. Soc., 1995, 142, 2577–2581 CrossRef CAS.
- B. Ravdel, K. Abraham, R. Gitzendanner, J. DiCarlo, B. Lucht and C. Campion, J. Power Sources, 2003, 119, 805–810 CrossRef.
- C. L. Campion, W. Li and B. L. Lucht, J. Electrochem. Soc., 2005, 152, A2327–A2334 CrossRef CAS.
- J. O. Besenhard and M. Winter, Pure Appl. Chem., 1998, 70, 603–608 CrossRef CAS.
- E. Peled, J. Electrochem. Soc., 1979, 126, 2047–2051 CrossRef CAS.
- M. Winter, Z. Phys. Chem., 2009, 223, 1395–1406 CrossRef CAS.
- M. Thomas, P. Bruce and J. Goodenough, J. Electrochem. Soc., 1985, 132, 1521–1528 CrossRef CAS.
- Y.-M. Liu, B. G. Nicolau, J. L. Esbenshade and A. A. Gewirth, Anal. Chem., 2016, 88, 7171–7177 CrossRef CAS PubMed.
- K. Xu, Chem. Rev., 2014, 114, 11503–11618 CrossRef CAS PubMed.
- C. Schultz, S. Vedder, M. Winter and S. Nowak, Anal. Chem., 2016, 88, 11160–11168 CrossRef CAS PubMed.
- P. Verma, P. Maire and P. Novák, Electrochim. Acta, 2010, 55, 6332–6341 CrossRef CAS.
- T. Kawamura, A. Kimura, M. Egashira, S. Okada and J.-I. Yamaki, J. Power Sources, 2002, 104, 260–264 CrossRef CAS.
- S. Wilken, M. Treskow, J. Scheers, P. Johansson and P. Jacobsson, RSC Adv., 2013, 3, 16359–16364 RSC.
- S. Wiemers-Meyer, M. Winter and S. Nowak, Phys. Chem. Chem. Phys., 2016, 18, 26595–26601 RSC.
- L. Terborg, S. Nowak, S. Passerini, M. Winter, U. Karst, P. R. Haddad and P. N. Nesterenko, Anal. Chim. Acta, 2012, 714, 121–126 CrossRef CAS PubMed.
- V. Kraft, M. Gruetzke, W. Weber, M. Winter and S. Nowak, J. Chromatogr. A, 2014, 1354, 92–100 CrossRef CAS PubMed.
- W. Weber, R. Wagner, B. Streipert, V. Kraft, M. Winter and S. Nowak, J. Power Sources, 2016, 306, 193–199 CrossRef CAS.
- D. Abraham, J. Liu, C. H. Chen, Y. Hyung, M. Stoll, N. Elsen, S. MacLaren, R. Twesten, R. Haasch and E. Sammann, J. Power Sources, 2003, 119, 511–516 CrossRef.
- C. Schultz, V. Kraft, M. Pyschik, S. Weber, F. Schappacher, M. Winter and S. Nowak, J. Electrochem. Soc., 2015, 162, A629–A634 CrossRef CAS.
- M. Grützke, X. Mönnighoff, F. Horsthemke, V. Kraft, M. Winter and S. Nowak, RSC Adv., 2015, 5, 43209–43217 RSC.
- W. Weber, V. Kraft, M. Grützke, R. Wagner, M. Winter and S. Nowak, J. Chromatogr. A, 2015, 1394, 128–136 CrossRef CAS PubMed.
- G. Gachot, P. Ribière, D. Mathiron, S. Grugeon, M. Armand, J.-B. Leriche, S. Pilard and S. Laruelle, Anal. Chem., 2011, 83, 478–485 CrossRef CAS PubMed.
- G. Gachot, S. Grugeon, I. Jimenez-Gordon, G. G. Eshetu, S. Boyanov, A. Lecocq, G. Marlair, S. Pilard and S. Laruelle, Anal. Methods, 2014, 6, 6120–6124 RSC.
- D. Aurbach, B. Markovsky, A. Rodkin, M. Cojocaru, E. Levi and H.-J. Kim, Electrochim. Acta, 2002, 47, 1899–1911 CrossRef CAS.
- X. Mönnighoff, A. Friesen, B. Konersmann, F. Horsthemke, M. Grützke, M. Winter and S. Nowak, J. Power Sources, 2017, 352, 56–63 CrossRef.
- M. Grützke, V. Kraft, W. Weber, C. Wendt, A. Friesen, S. Klamor, M. Winter and S. Nowak, J. Supercrit. Fluids, 2014, 94, 216–222 CrossRef.
- B. C. Saunders and G. J. Stacey, J. Chem. Soc., 1948, 695–699 RSC.
- H. L. Tripathi and W. L. Dewey, J. Toxicol. Environ. Health, Part A, 1989, 26, 437–446 CAS.
- S. Nowak and M. Winter, J. Electrochem. Soc., 2015, 162, A2500–A2508 CrossRef CAS.
- F. M. Raushel, Nature, 2011, 469, 310–311 CrossRef CAS PubMed.
- L. G. Costa, Clin. Chim. Acta, 2006, 366, 1–13 CrossRef CAS PubMed.
- S. Nowak and M. Winter, Molecules, 2017, 22, 403 CrossRef PubMed.
- Y. Liu, D. Mu, Y. Dai, Q. Ma, R. Zheng and C. Dai, Int. J. Electrochem. Sci., 2016, 11, 7594–7604 CrossRef CAS.
- R. P. Belardi and J. B. Pawliszyn, Water Pollut. Res. J. Can., 1989, 24, 179–191 CAS.
- C. L. Arthur and J. Pawliszyn, Anal. Chem., 1990, 62, 2145–2148 CrossRef CAS.
- Z. Zhang and J. Pawliszyn, Anal. Chem., 1993, 65, 1843–1852 CrossRef CAS.
- M. Chai, C. L. Arthur, J. Pawliszyn, R. P. Belardi and K. F. Pratt, Analyst, 1993, 118, 1501–1505 RSC.
- C. L. Arthur, L. M. Killam, K. D. Buchholz, J. Pawliszyn and J. R. Berg, Anal. Chem., 1992, 64, 1960–1966 CrossRef CAS.
- X. P. Lee, T. Kumazawa, K. Sato and O. Suzuki, Chromatographia, 1996, 42, 135–140 CAS.
- S. Magdic and J. B. Pawliszyn, J. Chromatogr. A, 1996, 723, 111–122 CrossRef CAS PubMed.
- B. D. Page and G. Lacroix, J. Chromatogr. A, 1993, 648, 199–211 CrossRef CAS PubMed.
- H. Kataoka, H. L. Lord and J. Pawliszyn, J. Chromatogr. A, 2000, 880, 35–62 CrossRef CAS PubMed.
- S. Isetun, U. Nilsson, A. Colmsjoe and R. Johansson, Anal. Bioanal. Chem., 2004, 378, 1847–1853 CrossRef CAS PubMed.
- S. Isetun and U. Nilsson, Analyst, 2005, 130, 94–98 RSC.
- J. Vetter, P. Novák, M. Wagner, C. Veit, K.-C. Möller, J. Besenhard, M. Winter, M. Wohlfahrt-Mehrens, C. Vogler and A. Hammouche, J. Power Sources, 2005, 147, 269–281 CrossRef CAS.
- A. Friesen, F. Horsthemke, X. Mönnighoff, G. Brunklaus, R. Krafft, M. Börner, T. Risthaus, M. Winter and F. M. Schappacher, J. Power Sources, 2016, 334, 1–11 CrossRef CAS.
- Y.-S. Kim, T.-H. Kim, H. Lee and H.-K. Song, Energy Environ. Sci., 2011, 4, 4038–4045 CAS.
- R. Chen, F. Liu, Y. Chen, Y. Ye, Y. Huang, F. Wu and L. Li, J. Power Sources, 2016, 306, 70–77 CrossRef CAS.
- G.-Y. Kim and J. Dahn, J. Electrochem. Soc., 2015, 162, A437–A447 CrossRef CAS.
- L. Patiny and A. Borel, J. Chem. Inf. Model., 2013, 53(5), 1223–1228 CrossRef CAS PubMed.
- J. S. Elmore, M. A. Erbahadir and D. S. Mottram, J. Agric. Food Chem., 1997, 45, 2638–2641 CrossRef CAS.
| This journal is © The Royal Society of Chemistry 2017 |

