 Open Access Article
Creative Commons Attribution 3.0 Unported Licence
Synthesis, crystal structure, photophysical property and metal ion-binding behavior of a cyclometalated platinum(II) terpyridylacetylide with efficient π-conjugation degree†
Dongqin Bi,
Yuquan Feng,
Qian Zhao,
Hongwei Wang,
Yongsheng Zhu ,
Xiaoyu Bao,
Huitao Fan,
Lintao Yu,
Qichao Yang and
Dongfang Qiu
 *
*
College of Chemistry and Pharmacy Engineering, Nanyang Normal University, Nanyang, 473061, P. R. China. E-mail: qiudf2008@163.com; Fax: +86-377-63513595; Tel: +86-377-63513595
First published on 5th October 2017
Abstract
A cyclometalated Pt(II) acetylide derivative bearing a carbazole donor and a terpyridine (TPY) receptor has been successfully synthesized and characterized. X-ray crystallography shows its monoclinic crystal system with the P2(1)/c space group and the three-component co-planarity molecular structure. This efficient π-conjugation system displays an intense low-energy absorption band (ε = 1.51 × 10⁴ dm3 mol−1 cm−1) at λmax = 442 nm and a strong phosphorescence emission (Φ = 0.045) at λmax = 596 nm in an air-saturated CH2Cl2 solution at room temperature, resulting from the dπ(Pt) → π*(C^N^N) metal-to-ligand charge transfer (MLCT) mixing with the π(C![[triple bond, length as m-dash]](https://www.rsc.org/images/entities/char_e002.gif) C–Ar) → π*(C^N^N) ligand-to-ligand charge transfer (LLCT) transition. With the introduction of the TPY receptor, this complex possesses ca. 1.6-fold luminescence-enhancing response for Zn2+ and Cd2+ but dramatic luminescence quenching response toward other common transition metal cations. Consecutive titrations exhibit that the added metal ions bond to its free TPY receptor with 1
C–Ar) → π*(C^N^N) ligand-to-ligand charge transfer (LLCT) transition. With the introduction of the TPY receptor, this complex possesses ca. 1.6-fold luminescence-enhancing response for Zn2+ and Cd2+ but dramatic luminescence quenching response toward other common transition metal cations. Consecutive titrations exhibit that the added metal ions bond to its free TPY receptor with 1![[thin space (1/6-em)]](https://www.rsc.org/images/entities/char_2009.gif) :
:![[thin space (1/6-em)]](https://www.rsc.org/images/entities/char_2009.gif) 2 stoichiometry to form the heterotrinuclear (Pt–M–Pt) complex. The Fe2+-quenched and Zn2+-enhanced luminescence behaviors with the maximum PET efficiency of 92.4% and 62.7%, respectively, strongly suggest the presence of the intra-molecular energy transfer between the [M(TPY)2]2+ core and the terminal phosphorescent Pt(II) complex units.
2 stoichiometry to form the heterotrinuclear (Pt–M–Pt) complex. The Fe2+-quenched and Zn2+-enhanced luminescence behaviors with the maximum PET efficiency of 92.4% and 62.7%, respectively, strongly suggest the presence of the intra-molecular energy transfer between the [M(TPY)2]2+ core and the terminal phosphorescent Pt(II) complex units.
Introduction
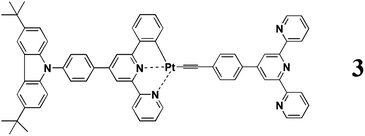
Luminescent chemosensors with high sensitivity and selectivity have been widely studied for their attractive potential in environmental and bio-medical applications.1,2 The “Chromophore–Spacer–Receptor” model has been generally designed, and the transition metal complexes with electronic transition in visible/near-IR region, high quantum efficiency and long lifetime have been extensively employed as fluorophores instead of the organic counterparts.3 Owing to their intriguing spectroscopic and luminescence properties, square-planar platinum(II) polypyridyl complexes imparted with metal-binding units, such as P- and N-donor crown ether pendants,4 S-benzo-15-crown-5,5 4-ethynylbenzo-15-crown-5,6 5,17-diethynyl-25,27-dimethoxycalix[4]crown-5,7 bipyridylacetylides,8 and terpyridylacetylides,9 have been reported in such investigations. Since the strong ligand field effect of the cyclometalated carbon raises the energy of the d–d states to reduce the non-radiation decay probability, cyclometalated platinum(II) complexes with tridentate phenyl-substituted pyridine [(N^C^N) motif]10–16 and bipyridine [(C^N^N) motif]17–22 as well as the related diphenyl-substituted pyridine [(C^N^C) motif]23,24 ligands are good emitters with high quantum yields at room temperature, which are expected to be used as better candidates in chemosensors.25,26 Cyclometalated [(C^N^N)Pt(II)] σ-alkynyl complex with a benzo-15-azacrown-5 receptor27 and a bis(2-picolyl)aniline (DPA) receptor28 have been applied in ion-binding studies. Our group reported a cyclometalated [(C^N^N)Pt(II)] terpyridylacetylide with a rich electron-donating bis-arylamine moiety, which exhibits the H+-triggered, Zn2+-enhanced and OH−-quenched phosphorescence properties and an unexpected Zn2+-selective luminescence chemosensor behavior in acid solution.29 However, owing to the lack of a clear molecular structure, the structure–property relationship is not well established for this class of multi-component compounds.Herein, we design a novel three-component molecular system (Chart 1, complex 3), in which the [(C^N^N)Pt(II)] acetylide core and the pendant TPY unit still serve as a planar fluorophore and a general receptor for transition metal ions, respectively, while the carbazole (CBZ) moiety serves as a rigid and higher energy-donating component. Its synthesis, crystal structure, photophysical properties, and transition metal ion-binding luminescence behaviors are mainly discussed with complex 2 (Scheme 1) as the reference compound.
Experimental
Materials and general procedures
The commercially available regents 3,6-di-tert-butylcarbazole, 18-crown-6, triethylamine (Et3N), phenylacetylene (C6H5C![[triple bond, length as m-dash]](https://www.rsc.org/images/entities/char_e002.gif) CH), anhydrous K2CO3, CuI, and K2PtCl4 were of analytical grade and used as received without further purification. Reactions were carried out under an argon atmosphere in an oven-dried glassware using standard Schlenk techniques. The solvents used for synthesis were also of analytical grade. Diisopropylamine was treated with 5 Å molecular sieves and distilled under an argon atmosphere from molten sodium. Dichloromethane was distilled before using it as a solvent for photophysical and electrochemical determinations of the sample. All metal salts, such as Zn(ClO4)2, Cd(ClO4)2, Fe(ClO4)2, NaClO4, KClO4, Ca(CH3COO)2, Mg(CH3COO)2, Mn(CH3COO)2, Co(CH3COO)2, Ni(CH3COO)2, Cu(CH3COO)2, and Pb(CH3COO)2, were of analytical reagent grade and used as supplied to prepare the titrant CH3OH solutions containing 3.5 × 10⁻³ mol dm−3 metal ions. Tetrabutylammonium perchlorate (tBu4NClO4), the supporting electrolyte for electrochemical studies, was prepared by the metathesis of tetrabutylammonium bromide and perchloric acid. The electrolyte was recrystallized from hot pentanol/ethyl acetate solution twice to give colorless crystals and dried in a vacuum oven. (Caution: perchlorate salts are potentially explosive and should be handled with care and in small amounts.)
CH), anhydrous K2CO3, CuI, and K2PtCl4 were of analytical grade and used as received without further purification. Reactions were carried out under an argon atmosphere in an oven-dried glassware using standard Schlenk techniques. The solvents used for synthesis were also of analytical grade. Diisopropylamine was treated with 5 Å molecular sieves and distilled under an argon atmosphere from molten sodium. Dichloromethane was distilled before using it as a solvent for photophysical and electrochemical determinations of the sample. All metal salts, such as Zn(ClO4)2, Cd(ClO4)2, Fe(ClO4)2, NaClO4, KClO4, Ca(CH3COO)2, Mg(CH3COO)2, Mn(CH3COO)2, Co(CH3COO)2, Ni(CH3COO)2, Cu(CH3COO)2, and Pb(CH3COO)2, were of analytical reagent grade and used as supplied to prepare the titrant CH3OH solutions containing 3.5 × 10⁻³ mol dm−3 metal ions. Tetrabutylammonium perchlorate (tBu4NClO4), the supporting electrolyte for electrochemical studies, was prepared by the metathesis of tetrabutylammonium bromide and perchloric acid. The electrolyte was recrystallized from hot pentanol/ethyl acetate solution twice to give colorless crystals and dried in a vacuum oven. (Caution: perchlorate salts are potentially explosive and should be handled with care and in small amounts.)
Syntheses of 4-(p-bromophenyl)-6-phenyl-2,2′-bipyridine and 4′-(4-ethynylphenyl)-2,2′:6′,2′′-terpyridine have been described previously.29
Synthesis of 4-{p-[9-(3,6-di-tert-butyl)carbazolyl]}-phenyl-6-phenyl-2,2′-bipyridine (HL)
A mixture of 3,6-di-tert-butylcarbazole (3.91 g, 14.0 mmol), 4-(p-bromophenyl)-6-phenyl-2,2′-bipyridine (3.87 g, 10.0 mmol), anhydrous K2CO3 (4.18 g, 30.0 mmol), CuI (0.12 g, 0.6 mmol), and 18-crown-6 (0.28 g, 1.1 mmol) was transferred into a flask, purged with argon, and then heated to 185 °C under stirring for 24 h. After the reaction mixture was cooled to ambient temperature, CH2Cl2 and H2O were added. The aqueous phase was discarded, and the organic phase was washed with distilled H2O and then dried over anhydrous Na2SO4. The evaporated residue was applied to a chromatography column (neutral Al2O3) and eluted with CH2Cl2–petroleum ether (2![[thin space (1/6-em)]](https://www.rsc.org/images/entities/char_2009.gif) :
:![[thin space (1/6-em)]](https://www.rsc.org/images/entities/char_2009.gif) 1). The pure product was obtained by recrystallization from its MeOH/CH2Cl2 solution as a white crystal in a yield of 78%. 1H NMR (400 MHz, CDCl3): δ 8.76–8.73 (m, 3H), 8.26 (d, J = 7.6 Hz, 2H), 8.16 (s, 2H), 8.09 (s, 1H), 8.05 (d, J = 8.0 Hz, 2H), 7.90 (t, J = 7.6 Hz, 1H), 7.73 (d, J = 8.4 Hz, 2H), 7.56 (t, J = 7.4 Hz, 2H), 7.51–7.43 (m, 5H), 7.38 (t, J = 6.0 Hz, 1H, Ar), 1.52 (s, 18H, –CH3). 13C{1H} NMR (100 MHz, CDCl3): δ 157.4, 156.3, 156.2, 149.4, 149.0, 143.2, 139.4, 139.0, 138.9, 137.1, 137.0, 129.2, 128.8, 128.7, 127.1, 127.0, 124.0, 123.8, 123.6, 121.7, 118.4, 117.5, 116.4, 109.2 (Ar), 34.8 (–C(CH3)3), 32.0 (–CH3); elemental analysis calcd (%) for C31H28N4: C, 81.55; H, 6.18; N, 12.27; found: C, 81.79; H, 6.20; N, 11.98.
1). The pure product was obtained by recrystallization from its MeOH/CH2Cl2 solution as a white crystal in a yield of 78%. 1H NMR (400 MHz, CDCl3): δ 8.76–8.73 (m, 3H), 8.26 (d, J = 7.6 Hz, 2H), 8.16 (s, 2H), 8.09 (s, 1H), 8.05 (d, J = 8.0 Hz, 2H), 7.90 (t, J = 7.6 Hz, 1H), 7.73 (d, J = 8.4 Hz, 2H), 7.56 (t, J = 7.4 Hz, 2H), 7.51–7.43 (m, 5H), 7.38 (t, J = 6.0 Hz, 1H, Ar), 1.52 (s, 18H, –CH3). 13C{1H} NMR (100 MHz, CDCl3): δ 157.4, 156.3, 156.2, 149.4, 149.0, 143.2, 139.4, 139.0, 138.9, 137.1, 137.0, 129.2, 128.8, 128.7, 127.1, 127.0, 124.0, 123.8, 123.6, 121.7, 118.4, 117.5, 116.4, 109.2 (Ar), 34.8 (–C(CH3)3), 32.0 (–CH3); elemental analysis calcd (%) for C31H28N4: C, 81.55; H, 6.18; N, 12.27; found: C, 81.79; H, 6.20; N, 11.98.
Synthesis of 1
A mixture of HL (0.29 g, 0.5 mmol), K2PtCl4 (0.21 g, 0.5 mmol) and glacial acetic acid (50 mL) was refluxed for 12 h under an argon atmosphere in the absence of light. The reaction mixture was then cooled to room temperature and filtered. The obtained solid was recrystallized from MeOH/CH2Cl2 solution to form the desired product as an orange crystal in a yield of 92%. 1H NMR (300 MHz, DMSO-d6): δ 8.92 (d, J = 4.8 Hz, 1H), 8.78 (d, J = 7.8 Hz, 1H), 8.63 (s, 1H), 8.41–8.33 (m, 6H), 7.92 (t, J = 6.6 Hz, 2H), 7.87 (d, J = 8.4 Hz, 2H), 7.54–7.42 (m, 5H), 7.13 (t, J = 8.4 Hz, 2H, Ar), 1.44 (s, 18H, –CH3). Elemental analysis calcd (%) for C42H38ClN3Pt: C, 61.87; H, 4.70; N, 5.15; found: C, 62.03; H, 4.83; N, 4.98.Synthesis of 2
A mixture of 1 (0.24 g, 0.3 mmol), C6H5C![[triple bond, length as m-dash]](https://www.rsc.org/images/entities/char_e002.gif) CH (0.10 g, 1.0 mmol), Et3N (5 mL) and CuI (5.0 mg, 0.03 mmol) in degassed CH2Cl2 (50 mL) was stirred for 24 h under an argon atmosphere at room temperature in the absence of light. The reaction mixture was then evaporated to dryness under reduced pressure. The crude product was purified by flash chromatography (neutral Al2O3, CH2Cl2 as eluent) and recrystallized from CH2Cl2/MeOH solution to form the desired product as a red crystal in a yield of 84%. 1H NMR (400 MHz, DMSO-d6): δ 9.09 (d, J = 4.4 Hz, 1H), 8.80 (d, J = 8.0 Hz, 1H), 8.71 (s, 1H), 8.46 (s, 1H), 8.42–8.38 (m, 3H), 8.35 (s, 2H), 7.92–7.87 (m, 4H), 7.78 (d, J = 7.6 Hz, 1H), 7.53 (d, J = 8.8 Hz, 2H), 7.45 (d, J = 8.4 Hz, 2H), 7.40 (d, J = 7.2 Hz, 2H), 7.30 (t, J = 7.8 Hz, 2H), 7.19–7.09 (m, 3H, Ar), 1.44 (s, 18H, –CH3). Elemental analysis calcd (%) for C50H43N3Pt: C, 68.17; H, 4.92; N, 4.77; found: C, 68.45; H, 5.10; N, 4.62.
CH (0.10 g, 1.0 mmol), Et3N (5 mL) and CuI (5.0 mg, 0.03 mmol) in degassed CH2Cl2 (50 mL) was stirred for 24 h under an argon atmosphere at room temperature in the absence of light. The reaction mixture was then evaporated to dryness under reduced pressure. The crude product was purified by flash chromatography (neutral Al2O3, CH2Cl2 as eluent) and recrystallized from CH2Cl2/MeOH solution to form the desired product as a red crystal in a yield of 84%. 1H NMR (400 MHz, DMSO-d6): δ 9.09 (d, J = 4.4 Hz, 1H), 8.80 (d, J = 8.0 Hz, 1H), 8.71 (s, 1H), 8.46 (s, 1H), 8.42–8.38 (m, 3H), 8.35 (s, 2H), 7.92–7.87 (m, 4H), 7.78 (d, J = 7.6 Hz, 1H), 7.53 (d, J = 8.8 Hz, 2H), 7.45 (d, J = 8.4 Hz, 2H), 7.40 (d, J = 7.2 Hz, 2H), 7.30 (t, J = 7.8 Hz, 2H), 7.19–7.09 (m, 3H, Ar), 1.44 (s, 18H, –CH3). Elemental analysis calcd (%) for C50H43N3Pt: C, 68.17; H, 4.92; N, 4.77; found: C, 68.45; H, 5.10; N, 4.62.
Synthesis of 3
To a stirred solution of 1 (0.14 g, 0.17 mmol) and 4′-(4-ethynylphenyl)-2,2′:6′,2′′-terpyridine (0.07 g, 0.18 mmol) in degassed CH2Cl2 (20 mL), CuI (5.4 mg, 0.03 mmol) and Et3N (4 mL) were successively added. The mixture was stirred for 24 h under an argon atmosphere at room temperature in the absence of light and then evaporated to dryness under reduced pressure. The crude product was purified by flash chromatography (neutral Al2O3, CH2Cl2 as eluent) and recrystallized from CH2Cl2/MeOH solution to form the desired product as a red crystal in a yield of 89%. 1H NMR (400 MHz, DMSO-d6): δ 9.10 (d, J = 4.8 Hz, 1H), 8.80 (d, J = 4.4 Hz, 3H), 8.75 (s, 2H), 8.70 (d, J = 8.0 Hz, 3H), 8.46–8.38 (m, 4H), 8.35 (s, 2H), 8.06 (t, J = 8.4 Hz, 2H), 7.93–7.85 (m, 6H), 7.82 (d, J = 7.6 Hz, 1H), 7.60–7.52 (m, 6H), 7.45 (d, J = 8.8 Hz, 2H), 7.19 (t, J = 6.8 Hz, 1H), 7.13 (t, J = 7.4 Hz, 1H, Ar), 1.43 (s, 18H, –CH3). Elemental analysis calcd (%) for C65H52N6Pt: C, 70.19; H, 4.71; N, 7.56; found: C, 70.44; H, 4.86; N, 7.38. Matrix-assisted laser desorption/ionization time-of-flight mass spectrometry (MALDI-TOF MS): m/z = 1112.4 ([M], C65H52N6Pt requires 1112.39).General procedure of consecutive titrations
The titrand solutions of 3 (100 mL) were freshly prepared in CH2Cl2 before the consecutive titration experiment. Absorption and emission spectra were recorded simultaneously after each addition (10 μL) of the corresponding titrant solution. Each titration step was stopped after no more changes were observed in the absorption and emission properties. The selectivity of 3 toward different metal cations was monitored by the parallel PL experiment under the same instrument condition, in which 0.5 equiv. of the metal ions was added in each titrand solution containing 1.5 × 10⁻⁵ mol dm−3 3.Physical measurements and instrumentation
1H and 13C{1H} NMR spectra were recorded on Bruker AV 300 and 400 spectrometers and referenced with respect to TMS internal standard. Elemental analyses were carried out using a Bio-Rad Co's elemental analytical instrument. MALDI-TOF MS analyses were performed on a Bruker Autoflex III with a negative reflector mode. UV-vis absorption spectra were obtained using the Perkin-Elmer Lambda 650s ultraviolet-visible spectrophotometer. Steady-state PL spectra were performed on the Perkin-Elmer LS50B spectrometer. Emission lifetimes and PL quantum yields were determined on the FLS-980 fluorescence spectrometer (Edinburgh Instruments Ltd.) with a microflash lamp as the excitation source. CV spectra were conducted on the CHI660A electrochemical workstation in CH2Cl2 solutions with a three-electrode electrochemical cell using Pt electrode, SCE and Pt wire as the working, reference and counter electrodes, respectively. nBu4NClO4 (0.1 mol L−1) was used as the supporting electrolyte and the scan rate was 50 mV s−1.X-ray crystallography
Diffraction data were collected on the Bruker SMART APEX II CCD diffractometer equipped with graphite-monochromated Mo-Kα radiation (λ = 0.71073 Å) at 296(2) K using the Φ–ω scan mode. The intensity data were corrected by Lp factors and empirical absorption. The structure was solved by direct methods and subsequent successive difference Fourier maps, and refined by full-matrix least-squares techniques on F2. All of the non-hydrogen atoms were refined anisotropically. The organic hydrogen atoms were generated geometrically. All calculations were carried out with SHELXTL-97 program.30Determination of the association constant (Ka)
The binding constants of 3 toward Fe2+ and Zn2+ from the absorption titration data were calculated using the linear Benesi–Hildebrand equation.31–33 Moreover, the binding constants of 3 toward Fe2+ and Zn2+ were evaluated from their fluorescence titration data using the Stern–Volmer expression34,35 and the linear Benesi–Hildebrand equation, respectively.Determination of the limit of detection (LOD)
The limits of detection of 3 for Fe2+ and Zn2+ ions were calculated using the following equation:32| LOD = 3σ/S |
Results and discussion
Synthesis and characterization
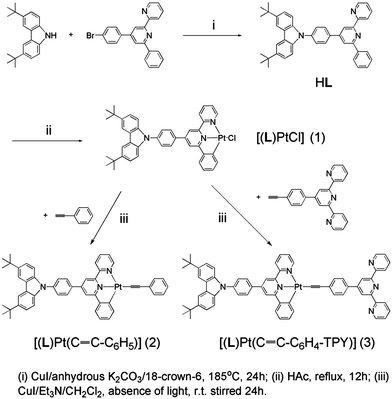
The synthesis of ligand HL and complexes 1–3 explored in this work is shown in Scheme 1. Furthermore, 4-(p-bromophenyl)-6-phenyl-2,2′-bipyridine was obtained using Kröhnke's method, and 4-{p-[9-(3,6-di-tert-butyl)carbazolyl]}-phenyl-6-phenyl-2,2′-bipyridine (HL) was synthesized by the high-temperature Ullmann condensation between 3,6-di-tert-butylcarbazole and 4-(p-bromophenyl)-6-phenyl-2,2′-bipyridine, followed by chromatographic purification. The cyclometalated Pt(II) chloride 1 was synthesized by refluxing HL and K2PtCl4 in glacial acetic acid for 12 h. Finally, reaction of 1 with phenylacetylene and 4′-(4-ethynylphenyl)-2,2′:6′,2′′-terpyridine by Sonogashira's method and then purification by flash chromatography and recrystallization resulted in complexes 2 and 3 as red crystals in good yields, respectively. Both of them have good solubility in CH2Cl2 and were characterized by 1H NMR, elemental analysis, and/or MALDI-TOF MS. In addition, their structures were revealed by X-ray crystallography.Crystal structures
The single crystals of complexes 2 and 3 (CCDC: 991876 and 991877) were grown by slowly evaporating the solvent from their concentrated CH2Cl2/MeOH solutions, and the crystal data and crystal structure parameters are listed in Table S1.† Their perspective views are shown in Fig. 1 and 2. The coordination geometry of the Pt atom is a distorted square planar configuration with the C(1)–Pt(1)–N(2) and N(1)–Pt(1)–C(35) angles of 160.4(18) and 175.8(18)° for 2 and 160.5(2) and 178.1(2)° for 3. The bond distances of Pt(1)–C(1), Pt(1)–N(1) and Pt(1)–N(2) are 2.016(5), 1.991(4) and 2.111(4) Å for 2 and 1.993(6), 1.981(5) and 2.096(5) Å for 3, respectively, which are comparable to those of previously reported analogs.36–39 The C(1)–C(6)–C(7)–N(1) and N(1)–C(11)–C(12)–N(2) torsion angles of 1.91 and 1.60° for 2 and 4.34 and 7.23° for 3 suggest that the configuration of (C^N^N) ligand is nearly planar. The dihedral angles between the phenyl ring at 4-position of the (C^N^N) ligand and the plane of the [(C^N^N)Pt] moiety are 32.00° for 2 and 34.11° for 3. In complex 3, as expected, three pyridine rings of TPY domain exhibit the transoid configuration about interannular C–C bonds, and the interplanar angles between two terminal pyridine rings and central pyridine ring are 13.79 and 18.05°, respectively. The terminal TPY and CBZ planes are basically coplanar to the central [(C^N^N)Pt] unit, as evidenced by the dihedral angles of 10.27° and 9.88° between them, respectively, indicating its efficient π-conjugation molecule structure.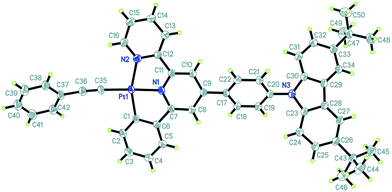 | ||
| Fig. 1 Perspective view of the single crystal structure of 2 with 30% thermal ellipsoids (hydrogen atoms have been omitted for clarity). | ||
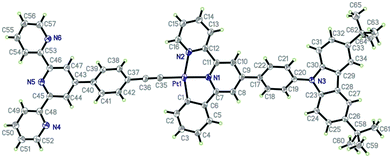 | ||
| Fig. 2 Perspective view of the single crystal structure of 3 with 30% thermal ellipsoids (hydrogen atoms have been omitted for clarity). | ||
Instead of forming a continuous chain linked by the Pt–Pt interaction as in [(C^N^N)PtCl],37,38 the crystal lattice of 2 is packed by one type of alternating arranged dimeric units along the c axis (Fig. 3), in which two molecules are stacked in parallel with a Pt–Pt distance of 9.149 Å. However, complex 3 shows another type of continuously stacked dimers in a head-to-tail fashion along the a axis (Fig. 4). The Pt–Pt distance of 4.725 Å also suggests no metal–metal interaction, but the vertical distance of 3.489 Å between the neighboring [(C^N^N)Pt] planes indicates that they are likely to be held together by the weak π–π interaction.
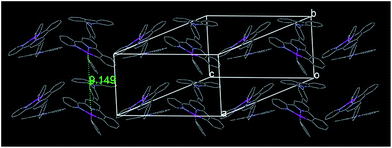 | ||
| Fig. 3 Crystal packing diagram of 2 (hydrogen atoms and tert-butyl groups have been omitted for clarity). | ||
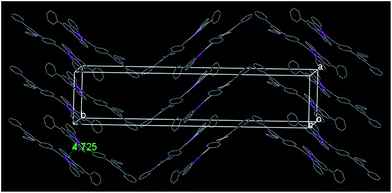 | ||
| Fig. 4 Crystal packing diagram of 3 (hydrogen atoms and 3,6-di-tert-butylcarbazole units have been omitted for clarity). | ||
Photophysical properties
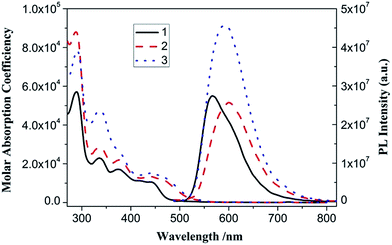
The UV-vis absorption spectra of complex 1–3 in CH2Cl2 solution exhibit intense bands at 250–400 nm and less intense bands at 400–550 nm (Table 1 and Fig. 5). With reference to previous spectroscopic work on phenylbipyridyl platinum(II) complexes,39 the high-energy intense absorption bands are clearly assigned to the singlet π → π* intraligand (IL) transitions of phenylbipyridine (C^N^N) and alkynyl (C![[triple bond, length as m-dash]](https://www.rsc.org/images/entities/char_e002.gif) C–Ar) ligands, while the low-energy bands are attributed to the well-known spin-allowed singlet dπ(Pt) → π*(C^N^N) metal-to-ligand charge transfer (MLCT) mixing with the π(Cl or C
C–Ar) ligands, while the low-energy bands are attributed to the well-known spin-allowed singlet dπ(Pt) → π*(C^N^N) metal-to-ligand charge transfer (MLCT) mixing with the π(Cl or C![[triple bond, length as m-dash]](https://www.rsc.org/images/entities/char_e002.gif) C–Ar) → π*(C^N^N) ligand-to-ligand charge transfer (LLCT) transitions. The low-energy absorption bands obey Beer's law in the range of 10−6 to 10−4 mol dm−3, suggesting no dimerization or oligomerization of these complexes within this concentration range.
C–Ar) → π*(C^N^N) ligand-to-ligand charge transfer (LLCT) transitions. The low-energy absorption bands obey Beer's law in the range of 10−6 to 10−4 mol dm−3, suggesting no dimerization or oligomerization of these complexes within this concentration range.
| Compound | λmax,abs (nm) (ε × 104 dm3 mol−1 cm−1) | λmax,emb (nm) | Φemb,c | τemb,c (μs) | knrd (×105) (s−1) | kre (×103) (s−1) |
|---|---|---|---|---|---|---|
| a Measured in an air-saturated CH2Cl2 solution at room temperature.b Excited wavelength is 450 nm.c PL quantum yields and lifetime.d knr = (1 − Φ)/τ.e kr = Φ/τ.f Measured after addition of 0.5 equiv. metal ion into an air-saturated 3 CH2Cl2 solution at room temperature. | ||||||
| 1 | 432 (1.06), 414 (sh, 1.12), 376 (1.71), 336 (2.29), 290 (5.71) | 566, 598 (sh) | 0.019 | 5.10 | 1.92 | 3.73 |
| 2 | 438 (1.34), 376 (2.20), 338 (2.84), 288 (8.80) | 600 | 0.026 | 5.24 | 1.86 | 4.96 |
| 3 | 442 (1.51), 370 (sh, 2.79), 338(4.73), 292 (7.82) | 596 | 0.045 | 5.89 | 1.62 | 7.64 |
3 + Fe2+ (2![[thin space (1/6-em)]](https://www.rsc.org/images/entities/char_2009.gif) : :![[thin space (1/6-em)]](https://www.rsc.org/images/entities/char_2009.gif) 1) f 1) f |
580 (1.98), 440 (2.58), 366 (sh, 2.97), 326 (5.06), 290 (8.03) | 568 | 0.0065 | 5.32 | 1.87 | 1.22 |
3 + Zn2+ (2![[thin space (1/6-em)]](https://www.rsc.org/images/entities/char_2009.gif) : :![[thin space (1/6-em)]](https://www.rsc.org/images/entities/char_2009.gif) 1)f 1)f |
448 (3.20), 382 (sh, 2.53), 332 (4.16), 290 (8.42) | 582 | 0.050 | 5.42 | 1.75 | 9.23 |
With an excitation at 450 nm, which is into their MLCT absorption bands, 1, 2 and 3 in CH2Cl2 solution emit reddish-orange luminescence (Table 1 and Fig. 5). For each of them, the time-resolved PL intensity decay is complex and is most adequately modeled using a sum of two single exponential functions (Fig. S1†). The average lifetimes [τ = (α1τ12 + α2τ22)/(α1τ1 + α2τ2)], radiation (kr) and non-radiation (knr) rate constants are calculated as listed in Table 1. The comparably long emission lifetimes (τ in μs scale), large Stoke's shifts, and kr and knr values suggest that their emissions originate from the spin-forbidden triplet excited states. Complex 2 has longer emission wavelength and lifetime as well as larger quantum yield than 1, resulting from incorporation of the strong-field acetylide ligand to extend its π-conjugated system and destabilize the non-radiative ligand–field transitions.39,40 With further introduction of the electron-withdrawing TPY unit, complex 3 shows a slightly blue-shifted (Δλmax,em = 4 nm) and apparently enhanced emission compared with 2, reflecting its lower HOMO level and stronger molecular rigidity. Despite the presence of the dynamical quenching effect of dissolved oxygen, complex 3 still possesses strong emission with comparative quantum yield in air-saturated CH2Cl2 solution at room temperature, which facilitates the consecutive titration and metal ion sensing studies mentioned later in this study.
In addition, selective optical-stimulation experiment was conducted to study the interaction between components of complex 3. When excited at 338 nm, which is into the CBZ absorption band in the UV region, the 3MLCT emission clearly increased compared with that of 3 excited at 450 nm (Fig. S2†). The enhanced luminescence efficiency ([(I2/I1) − 1] × 100(%)) is calculated to be ca. 175%, in which I2 and I1 stand for the integrated area from 480 to 750 nm in the emission spectra of 3 excited at 338 and 450 nm, respectively.
The electrochemical behaviors of HL and 1–3 in CH2Cl2 solution at room temperature were also investigated by cyclic voltammetry (CV), and the data are listed in Table 2. The cyclic voltammogram of HL shows a quasi-reversible redox wave (ΔE = 133 mV, ip,a/ip,c = 1.0) at E1/2 = +0.75 V. As the oxidation potential of the (ph-C^N^N) unit is beyond the potential window of the solvent, this wave is assigned to the mono radical cation formation of the CBZ group. For each of complexes 1–3, the cyclic voltammogram exhibits one reversible reduction couple at similar negative potentials, which presumably corresponds to the metal-perturbed one-electron reduction of the (C^N^N) ligand. In addition, the irreversible Pt(II)-based oxidation wave is shown as a shoulder peak at lower anodic potential than that of the CBZ moiety.41 The HOMO and LUMO levels of 1–3 were also estimated from their electrochemical data,42 which reveal that the HOMOs are basically Pt(II) acetylide based and the LUMOs predominantly correspond to the π* orbitals of cyclometalated ligands.29,40,43–45 When the electron-withdrawing TPY group is attached to the phenylacetylide ligand of 2 at para-position, complex 3 possesses a clearly anodic-shifted Pt(II) oxidation peak (ΔEp,a = 0.10 V) and a slightly positive-shifted reduction potential of the (C^N^N) ligand (ΔE1/2 = 0.03 V), suggesting that introduction of TPY mainly stabilizes its HOMO energy level (ΔEg = 0.1 eV). These results are consistent with the above-mentioned spectroscopic studies and theoretical calculations on the frontier molecular orbitals of phosphorescent cyclometalated Pt(II) acetylide.
| Compound | Oxidationb | Reduction E1/2 (V) | HOMOc (eV) | LUMOc (eV) | Egc (eV) | |
|---|---|---|---|---|---|---|
| Ligand-based, E1/2 (V) | Metal-based, Ep,a (V) | |||||
| a Determined in CH2Cl2 at room temperature with 0.1 mol dm−3 nBu4NClO4 as a supporting electrolyte, scanning rate: 50 mV s−1.b Values are reported versus Fc+/Fc (E1/2 = +0.46 V vs. saturated calomel electrode (SCE)).c The highest occupied molecular orbital (HOMO) and the lowest unoccupied molecular orbital (LUMO) levels are calculated from the onset values of their first anodic and cathodic waves according to the equation E = −(Eonset + 4.34) eV, respectively, while the energy gaps (Eg) are the differences in their HOMO and LUMO levels. | ||||||
| HL | +0.75 | — | — | −5.0 | −2.4 | 2.6 |
| 1 | +0.76 | +0.40 (sh) | −1.76 | −4.7 | −2.7 | 2.0 |
| 2 | +0.77 | +0.50 (sh) | −1.77 | −4.7 | −2.7 | 2.0 |
| 3 | +0.78 | +0.60 (sh) | −1.74 | −4.8 | −2.7 | 2.1 |
Titration of 3 with Fe2+
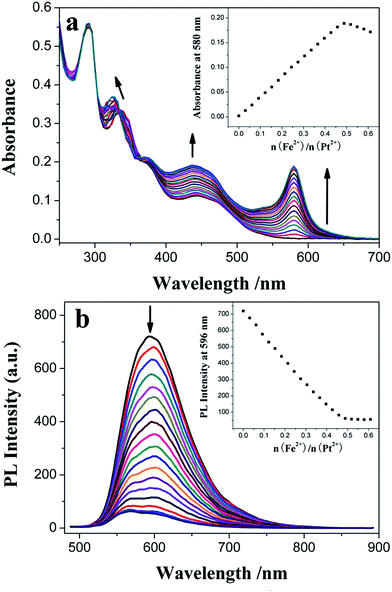
As shown in Fig. 6a, besides the presence of the dπ(Pt) → π*(C^N^N) 1MLCT absorption band (λmax = 442 nm) of 3, a new spin-allowed singlet dπ(Fe) → π*(TPY) metal-to-ligand charge transfer (1MLCT) transition46,47 appeared at λmax = 580 nm upon addition of Fe2+ (Table 1 and Fig. S3†). Both of them are gradually increased, and they finally reach their maxima when titrated with 0.5 molar amount of Fe2+ (Fig. 6a, inset). These results suggest that the added iron ions bond to the free TPY receptor of 3 with 1![[thin space (1/6-em)]](https://www.rsc.org/images/entities/char_2009.gif) :
:![[thin space (1/6-em)]](https://www.rsc.org/images/entities/char_2009.gif) 2 stoichiometry to form the heterotrinuclear complex (Pt–Fe–Pt) containing the [Fe(TPY)2]2+ core. A perfect linear relationship (R = 0.99983) is established from the absorption titration data for the plot, and absorbance was measured at 580 nm as a function of [Fe2+] (from 0 to 4.50 × 10⁻⁶ mol dm−3) (Fig. S4†). The colorimetric LOD is 8.21 × 10⁻⁸ mol dm−3, which is comparable to that of the ruthenium(II) complex-based chemosensor48 and much lower than that of benzimidazole-based chemosensor.49 By plotting the measured [1/(A − A0)] at 580 nm as a function of 1/[Fe2+] based on the well-known Benesi–Hildebrand expression (Fig. S5†), a good linear relationship (R = 0.99958) is obtained, and the association constant of 3 with Fe2+, Ka = 5.06 × 10⁴ mol−1 dm3, is calculated from the slope and intercept of this linear plot. Owing to its lower energy excited state of the as-formed [Fe(TPY)2]2+ core in the Pt–Fe–Pt heterotrinuclear complex,9 the photoinduced energy/electron transfer (PET) process from the peripheral cyclometalated Pt(II) complex units to the central Fe–TPY complex quenches the MLCT emission of 3 with a much smaller quantum yield of 0.0065 (Fig. 6b). A good linear relationship (R = −0.99861) between the PL intensity and [Fe2+] (from 0 to 4.50 × 10⁻⁶ mol dm−3) is also obtained from the quenching titration data (Fig. S6†), and the LOD is 2.38 × 10⁻⁷ mol dm−3, which is an order of magnitude lower than that of the benzoimidazoquinazoline-based fluorescent chemosensor.50 In addition, the apparent association constant of 3 with Fe2+, Ka = 3.14 × 10⁵ mol−1 dm3 (R = 0.9934), is determined from the Stern–Volmer plot (Fig. S7†). The inflection point of the curve measured the PL intensity at 596 nm as a function of the molar ratio of added Fe2+ and the central Pt2+ ion of 3 is also ca. 0.5 (Fig. 6b, inset), further confirming the 1
2 stoichiometry to form the heterotrinuclear complex (Pt–Fe–Pt) containing the [Fe(TPY)2]2+ core. A perfect linear relationship (R = 0.99983) is established from the absorption titration data for the plot, and absorbance was measured at 580 nm as a function of [Fe2+] (from 0 to 4.50 × 10⁻⁶ mol dm−3) (Fig. S4†). The colorimetric LOD is 8.21 × 10⁻⁸ mol dm−3, which is comparable to that of the ruthenium(II) complex-based chemosensor48 and much lower than that of benzimidazole-based chemosensor.49 By plotting the measured [1/(A − A0)] at 580 nm as a function of 1/[Fe2+] based on the well-known Benesi–Hildebrand expression (Fig. S5†), a good linear relationship (R = 0.99958) is obtained, and the association constant of 3 with Fe2+, Ka = 5.06 × 10⁴ mol−1 dm3, is calculated from the slope and intercept of this linear plot. Owing to its lower energy excited state of the as-formed [Fe(TPY)2]2+ core in the Pt–Fe–Pt heterotrinuclear complex,9 the photoinduced energy/electron transfer (PET) process from the peripheral cyclometalated Pt(II) complex units to the central Fe–TPY complex quenches the MLCT emission of 3 with a much smaller quantum yield of 0.0065 (Fig. 6b). A good linear relationship (R = −0.99861) between the PL intensity and [Fe2+] (from 0 to 4.50 × 10⁻⁶ mol dm−3) is also obtained from the quenching titration data (Fig. S6†), and the LOD is 2.38 × 10⁻⁷ mol dm−3, which is an order of magnitude lower than that of the benzoimidazoquinazoline-based fluorescent chemosensor.50 In addition, the apparent association constant of 3 with Fe2+, Ka = 3.14 × 10⁵ mol−1 dm3 (R = 0.9934), is determined from the Stern–Volmer plot (Fig. S7†). The inflection point of the curve measured the PL intensity at 596 nm as a function of the molar ratio of added Fe2+ and the central Pt2+ ion of 3 is also ca. 0.5 (Fig. 6b, inset), further confirming the 1![[thin space (1/6-em)]](https://www.rsc.org/images/entities/char_2009.gif) :
:![[thin space (1/6-em)]](https://www.rsc.org/images/entities/char_2009.gif) 2 stoichiometry composition of the Pt–Fe–Pt heterotrinuclear complex. Though the quenching effect is observed during the titration process, the MLCT emission of 3 is not fully quenched upon excessive addition of Fe2+ and the maximum PET efficiency ([(I0 − Imin)/I0] × 100(%)) is estimated to be 92.4% (Table 1 and Fig. S8†).
2 stoichiometry composition of the Pt–Fe–Pt heterotrinuclear complex. Though the quenching effect is observed during the titration process, the MLCT emission of 3 is not fully quenched upon excessive addition of Fe2+ and the maximum PET efficiency ([(I0 − Imin)/I0] × 100(%)) is estimated to be 92.4% (Table 1 and Fig. S8†).
Titration of 3 with Zn2+
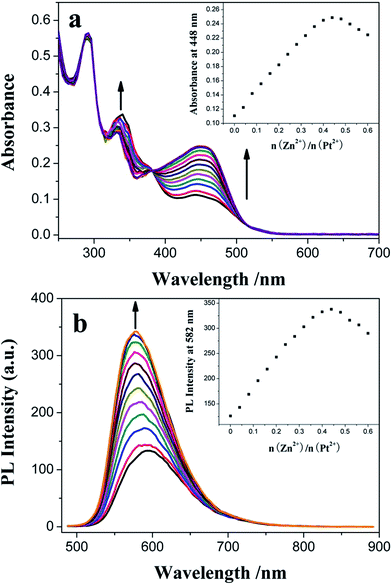
A similar titration experiment was conducted in CH2Cl2 solution containing 1.50 × 10⁻⁵ mol dm−3 3 using Zn2+ instead of Fe2+, but different absorption and emission changes were observed: (1) the dπ(Pt) → π*(C^N^N) 1MLCT absorption band of 3 is gradually increased with red-shift (Δλmax,abs = 6 nm) of its wavelength maximum (Fig. 7a). In the range of 0–4.00 × 10⁻⁶ mol dm−3, its intensity is linearly dependent on [Zn2+] (R = 0.99833) (Fig. S9†) and the colorimetric LOD is 2.42 × 10⁻⁷ mol dm−3. The association constant of 3 with Zn2+ is calculated to be Ka = 5.16 × 10⁴ mol−1 dm3 (R = 0.99967) from its Benesi–Hildebrand plot (Fig. S10†). (2) And the MLCT emission band of 3 is also gradually increased, but with a clear blue-shift (Δλmax,em = 14 nm) of its wavelength maximum (Fig. 7b). The linear relationship (R = 0.99632, from 0 to 4.00 × 10⁻⁶ mol dm−3), the LOD value of 3.61 × 10⁻⁷ mol dm−3 and the association constant of 3 with Zn2+ (Ka = 4.50 × 10⁴ mol−1 dm3, R = 0.99789) are also obtained from its PL titration data (Fig. S11 and S12†). The LOD is lower than or comparable to those of organic51–54 and transition metal complex fluorophores.29,55,56 When the molar ratio of Zn2+/Pt2+ is near to 0.5 (Fig. 7, inset), the MLCT absorption band at λmax = 448 nm and the corresponding emission band at λmax = 582 nm reach their maxima, indicating the formation of the Pt–Zn–Pt heterotrinuclear complex with 1![[thin space (1/6-em)]](https://www.rsc.org/images/entities/char_2009.gif) :
:![[thin space (1/6-em)]](https://www.rsc.org/images/entities/char_2009.gif) 2 stoichiometry composition. The MLCT absorption sensitivity and emission enhancement effects29 (Table 1, Fig. S3 and S8†) strongly suggest that the PET process from the central high energy [Zn(TPY)2]2+ core to cyclometalated Pt(II) complex units is present in this multi-component complex with a maximum efficiency ([(Imax − I0)/I0] × 100(%)) of 62.7%. Moreover, introduction of Zn2+, a strong Lewis acid, further stabilizes the Pt(II) acetylide-based HOMO level relative to the “free” TPY complex 3, resulting in the blue-shift of its emission band, which is accordant with its spectroscopic and electrochemical studies.
2 stoichiometry composition. The MLCT absorption sensitivity and emission enhancement effects29 (Table 1, Fig. S3 and S8†) strongly suggest that the PET process from the central high energy [Zn(TPY)2]2+ core to cyclometalated Pt(II) complex units is present in this multi-component complex with a maximum efficiency ([(Imax − I0)/I0] × 100(%)) of 62.7%. Moreover, introduction of Zn2+, a strong Lewis acid, further stabilizes the Pt(II) acetylide-based HOMO level relative to the “free” TPY complex 3, resulting in the blue-shift of its emission band, which is accordant with its spectroscopic and electrochemical studies.
Selectivity
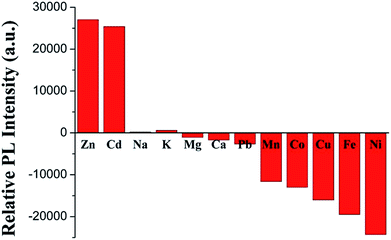
The binding behaviors of 3 toward different metal cations (0.5 equiv. of 3) were monitored by PL spectroscopy under the same condition. As expected, in Fig. 8, alkali (Na+ and K+), alkali-earth (Mg2+ and Ca2+) and Pb2+ ions elicit no significant luminescence quenching or enhancing response. Similar to Fe2+, the other common transition metal ions, such as Mn2+, Co2+, Cu2+, and Ni2+, also exhibit dramatic luminescence quenching effects. With the same filled d10 electronic configuration, Cd2+ displays a similar luminescence enhancement factor to Zn2+, which is accordant with those of other TPY- and its analog-based chemosensors.28,40,57Conclusions
In this study, we synthesized a novel cyclometalated Pt(II) acetylide (3) derivative bearing a CBZ donor and a TPY receptor, whose molecular structure is clearly demonstrated by X-ray crystallography. This efficient π-conjugation system displays an intense 1MLCT absorption band (ε = 1.51 × 10⁴ dm3 mol−1 cm−1) at λmax = 442 nm and a strong 3MLCT phosphorescence emission (Φ = 0.045) at λmax = 596 nm in air-saturated CH2Cl2 solution at room temperature. Owing to the presence of the free TPY receptor, complex 3 possesses the expected luminescence responses toward common transition metal cations, e.g. the Fe2+-quenched and Zn2+-enhanced luminescence behaviors. The 3–Fe2+ and 3–Zn2+ binding constants are correspondingly calculated from their absorption (Ka = 5.06 × 10⁴ mol−1 dm3 for 3–Fe2+ and 5.16 × 10⁴ mol−1 dm3 for 3–Zn2+) and emission (3.14 × 10⁵ mol−1 dm3 for 3–Fe2+ and 4.50 × 10⁴ mol−1 dm3 for 3–Zn2+) titration data. The formation of the heterotrinuclear (Pt–M–Pt) complex with 1![[thin space (1/6-em)]](https://www.rsc.org/images/entities/char_2009.gif) :
:![[thin space (1/6-em)]](https://www.rsc.org/images/entities/char_2009.gif) 2 stoichiometry is proven by the consecutive titrations, and the intra-molecular energy transfers between the [M(TPY)2]2+ core and the terminal emission Pt(II) complex units are also quantitatively verified with the maximum PET efficiencies of 92.4% for 3–Fe2+ system and 62.7% for 3–Zn2+ system.
2 stoichiometry is proven by the consecutive titrations, and the intra-molecular energy transfers between the [M(TPY)2]2+ core and the terminal emission Pt(II) complex units are also quantitatively verified with the maximum PET efficiencies of 92.4% for 3–Fe2+ system and 62.7% for 3–Zn2+ system.
Conflicts of interest
There are no conflicts to declare.Acknowledgements
This work was financially supported by the National Natural Science Foundation of China (No: 21571109), the Natural Science Foundation of Henan Province (No: 102300410221), the Natural Science Foundation of Nanyang Normal University (No: ZX2010012) and the Project supported by the Young Core Instructor from the Education Commission of Henan Province.Notes and references
- J. N. Demas and B. A. DeGraff, Coord. Chem. Rev., 2001, 211, 317–351 CrossRef CAS.
- M. H. Keefe, K. D. Benkstein and J. T. Hupp, Coord. Chem. Rev., 2000, 205, 201–228 CrossRef CAS.
- M. Formica, V. Fusi, L. Giorgi and M. Micheloni, Coord. Chem. Rev., 2012, 256, 170–192 CrossRef CAS.
- V. W. Yam, R. P. Tang, K. M. Wong, X. Lu, K. Cheung and N. Zhu, Chem.–Eur. J., 2002, 8, 4066–4076 CrossRef CAS.
- V. W. Yam, R. P. Tang, K. M. Wong, C. Ko and K. Cheung, Inorg. Chem., 2001, 40, 571–574 CrossRef CAS PubMed.
- P. K. M. Siu, S. Lai, W. Lu, N. Zhu and C. Che, Eur. J. Inorg. Chem., 2003, 2003, 2749–2752 CrossRef.
- H. Lo, S. Yip, K. M. Wong, N. Zhu and V. W. Yam, Organometallics, 2006, 25, 3537–3540 CrossRef CAS.
- M. L. Muro, S. Diring, X. Wang, R. Ziessel and F. N. Castellano, Inorg. Chem., 2009, 48, 11533–11542 CrossRef CAS PubMed.
- M. L. Muro, S. Diring, X. Wang, R. Ziessel and F. N. Castellano, Inorg. Chem., 2008, 47, 6796–6803 CrossRef CAS PubMed.
- V. V. Sivchik, E. V. Grachova, A. S. Melnikov, S. N. Smirnov, A. Y. Ivanov, P. Hirva, S. P. Tunik and I. O. Koshevoy, Inorg. Chem., 2016, 55, 3351–3363 CrossRef CAS PubMed.
- M. H. Y. Chan, H. L. Wong and V. W. W. Yam, Inorg. Chem., 2016, 55, 5570–5577 CrossRef CAS PubMed.
- Y. Ai, Y. Li, H. Ma, C. Y. Su and V. W. W. Yam, Inorg. Chem., 2016, 55, 11920–11929 CrossRef CAS PubMed.
- C. J. Lin, Y. H. Liu, S. M. Peng, T. Shinmyozu and J. S. Yang, Inorg. Chem., 2017, 56, 4978–4989 CrossRef CAS PubMed.
- G. Liu, F. Liang, Y. Zhao, H. Hu, J. Fan and L. S. Liao, J. Mater. Chem. C, 2017, 5, 1944–1951 RSC.
- X. Li, J. Hu, Y. Wu, R. Li, D. Xiao, W. Zeng, D. Zhang, Y. Xiang and W. Jin, Dyes Pigm., 2017, 141, 188–194 CrossRef CAS.
- Y. T. Liu, Y. R. Li, X. Wang and F. Q. Bai, Dyes Pigm., 2017, 142, 55–61 CrossRef CAS.
- W. Zhang, Y. Luo, Y. Xu, L. Tian, M. Li, R. He and W. Shen, Dalton Trans., 2015, 44, 18130–18137 RSC.
- S. Stoccoro, L. Maidich, T. Ruiu, M. A. Cinellu, G. J. Clarkson and A. Zucca, Dalton Trans., 2015, 44, 18001–18011 RSC.
- X. P. Zhang, F. Q. Liu, J. C. Lai, C. H. Li, A. M. Lia and X. Z. You, New J. Chem., 2016, 40, 2628–2636 RSC.
- J. Li, X. He, Y. Zou, D. Chen, L. Yang, J. Rao, H. Chen, M. C. W. Chan, L. Li, Z. Guo, L. W. Zhang and C. Chen, Metallomics, 2017, 9, 726–733 RSC.
- J. Sanning, L. Stegemann, P. R. Ewen, C. Schwermann, C. G. Daniliuc, D. Zhang, N. Lin, L. Duan, D. Wegner, N. L. Doltsinis and C. A. Strassert, J. Mater. Chem. C, 2016, 4, 2560–2565 RSC.
- W. Yang and J. Zhao, Eur. J. Inorg. Chem., 2016, 2016, 5283–5299 CrossRef CAS.
- W. Lu, M. C. W. Chan, K. K. Cheung and C. M. Che, Organometallics, 2001, 20, 2477–2486 CrossRef CAS.
- S. C. F. Kui, S. S. Y. Chui, C. M. Che and N. Zhu, J. Am. Chem. Soc., 2006, 128, 8297–8309 CrossRef CAS PubMed.
- Z. L. Gong and Y. W. Zhong, Inorg. Chem., 2016, 55, 10143–10151 CrossRef CAS PubMed.
- K. Li, G. S. M. Tong, Q. Wan, G. Cheng, W. Y. Tong, W. H. Ang, W. L. Kwong and C. M. Che, Chem. Sci., 2016, 7, 1653–1673 RSC.
- Q. Yang, L. Wu, H. Zhang, B. Chen, Z. Wu, L. Zhang and C. Tung, Inorg. Chem., 2004, 43, 5195–5197 CrossRef CAS PubMed.
- P. H. Lanoë, J. L. Fillaut, V. Guerchais, H. Le Bozec and J. A. G. Williams, Eur. J. Inorg. Chem., 2011, 2011, 1255–1259 CrossRef.
- D. Qiu, M. Li, Q. Zhao, H. Wang and C. Yang, Inorg. Chem., 2015, 54, 7774–7782 CrossRef CAS PubMed.
- G. M. Sheldrick, SHELX-97, Program for Crystal Structure Analysis, University of Göttingen, Göttingen, Germany, 1997 Search PubMed.
- S. Anbu, R. Ravishankaran, M. F. C. Guedes da Silva, A. A. Karande and A. J. L. Pombeiro, Inorg. Chem., 2014, 53, 6655–6664 CrossRef CAS PubMed.
- X. B. Yang, B. X. Yang, J. F. Ge, Y. J. Xu, Q. F. Xu, J. Liang and J. M. Lu, Org. Lett., 2011, 13, 2710–2713 CrossRef CAS PubMed.
- M. Zhu, M. Yuan, X. Liu, J. Xu, J. Lv, C. Huang, H. Liu, Y. Li, S. Wang and D. Zhu, Org. Lett., 2008, 10, 1481–1484 CrossRef CAS PubMed.
- C. Qin, X. Wu, B. Gao, H. Tong and L. Wang, Macromolecules, 2009, 42, 5427–5429 CrossRef CAS.
- P. Mahato, S. Saha and A. Das, J. Phys. Chem. C, 2012, 116, 17448–17457 CAS.
- S. W. Lai, M. C. W. Chan, K. K. Cheung and C. M. Che, Organometallics, 1999, 18, 3327–3336 CrossRef CAS.
- S. W. Lai, H. W. Lam, W. Lu, K. K. Cheung and C. M. Che, Organometallics, 2002, 21, 226–234 CrossRef CAS.
- A. Hofmann, L. Dahlenburg and R. van Eldik, Inorg. Chem., 2003, 42, 6528–6538 CrossRef CAS PubMed.
- W. Lu, B. X. Mi, M. C. W. Chan, Z. Hui, C. M. Che, N. Zhu and S. T. Lee, J. Am. Chem. Soc., 2004, 126, 4958–4971 CrossRef CAS PubMed.
- C. Latouche, P. H. Lanoë, J. A. G. Williams, V. Guerchais, A. Boucekkine and J. L. Fillaut, New J. Chem., 2011, 35, 2196–2202 RSC.
- D. Qiu, X. Bao, Y. Feng, K. Liu, H. Wang, H. Shi, Y. Guo, Q. Huang, J. Zeng, J. Zhou and Z. Xing, Electrochim. Acta, 2012, 60, 339–346 CrossRef CAS.
- G. Zhou, N. Pschirer, J. C. Schöneboom, F. Eickemeyer, M. Baumgarten and K. Müllen, Chem. Mater., 2008, 20, 1808–1815 CrossRef CAS.
- P. Shao, Y. Li, A. Azenkeng, M. R. Hoffmann and W. Sun, Inorg. Chem., 2009, 48, 2407–2419 CrossRef CAS PubMed.
- X. Wang, S. Goeb, Z. Ji and F. N. Castellano, J. Phys. Chem. B, 2010, 114, 14440–14449 CrossRef CAS PubMed.
- G. J. Zhou, X. Z. Wang, W. Y. Wong, X. M. Yu, H. S. Kwok and Z. Lin, J. Organomet. Chem., 2007, 692, 3461–3473 CrossRef CAS.
- D. Qiu, Y. Cheng and L. Wang, Dalton Trans., 2009, 2009, 3247–3261 RSC.
- X. Bao, Q. Zhao, H. Wang, K. Liu and D. Qiu, Inorg. Chem. Commun., 2013, 38, 88–91 CrossRef CAS.
- Z. Zheng, Z. Duan, Y. Ma and K. Wang, Inorg. Chem., 2013, 52, 2306–2316 CrossRef CAS PubMed.
- Y. S. Kim, J. J. Lee, S. Y. Lee, T. G. Jo and C. Kim, RSC Adv., 2016, 6, 61505–61515 RSC.
- S. Sen, S. Sarkar, B. Chattopadhyay, A. Moirangthem, A. Basu, K. Dhara and P. Chattopadhyay, Analyst, 2012, 137, 3335–3342 RSC.
- R. Azadbakht, M. Koolivand and J. Khanabadi, Anal. Methods, 2017, 9, 4688–4694 RSC.
- S. A. Ingale and F. Seela, J. Org. Chem., 2012, 77, 9352–9356 CrossRef CAS PubMed.
- X. Yang, B. Yang, J. Ge, Y. Xu, Q. Xu, J. Liang and J. Lu, Org. Lett., 2011, 13, 2710–2713 CrossRef CAS PubMed.
- Y. Zhou, Z. Li, S. Zang, Y. Zhu, H. Zhang, H. Hou and T. C. W. Mak, Org. Lett., 2012, 14, 1214–1217 CrossRef CAS PubMed.
- D. Ma, H. He, H. Zhong, S. Lin, D. S. Chan, L. Wang, S. M. Lee, C. Leung and C. Wong, ACS Appl. Mater. Interfaces, 2014, 6, 14008–14015 CAS.
- L. Zhang, L. Xing, B. Chen, Q. Yang, Q. Tong, L. Wu and C. Tung, Dalton Trans., 2013, 42, 4244–4247 RSC.
- W. Goodall and J. A. G. Williams, Chem. Commun., 2001, 2001, 2514–2515 RSC.
Footnote |
| † Electronic supplementary information (ESI) available: Crystal data, luminescence intensity decay, UV-vis absorption and PL spectra, and the Stern–Volmer and Benesi–Hildebrand plots. CCDC 991876 and 991877. For ESI and crystallographic data in CIF or other electronic format see DOI: 10.1039/c7ra09423j |
| This journal is © The Royal Society of Chemistry 2017 |

