 Open Access Article
Creative Commons Attribution 3.0 Unported Licence
An in situ recovery method to prepare carbon-coated Zn–Al–hydrotalcite as the anode material for nickel–zinc secondary batteries
Xiao Zengab,
Zhanhong Yang *a,
Fengliang Liu*a,
Jun Longa,
Zhaobin Fenga and
Maokui Fanb
aCollege of Chemistry and Chemical Engineering, Central South University, Changsha 410083, PR China. E-mail: zhanhongyang611@163.com; lflcsu@csu.edu.cn
bPublic Security Fire Forces College, Kunming 650208, China
First published on 15th September 2017
Abstract
Carbon-coated Zn–Al–hydrotalcite (Zn–Al–LDH) is firstly synthesized by an in situ recovery method and applied as a novel anode material for Ni/Zn secondary batteries. X-ray diffraction (XRD), scanning electron microscopy (SEM), transmission electron microscopy (TEM) and X-ray photoelectron spectroscopy (XPS) measurements are carried out to investigate the structure and morphology of the as-prepared carbon-coated Zn–Al–LDH and the pristine Zn–Al–LDH. Meanwhile, the structure of each step synthetic product during an in situ recovery process are investigated through XRD measurements. The electrochemical performance of as-prepared carbon-coated Zn–Al–LDH and pristine Zn–Al–LDH are investigated through cyclic voltammetry (CV), electrochemical impedance spectroscopy (EIS), and galvanostatic charge–discharge (GCD) measurements. Compared with pristine Zn–Al–LDH, the carbon-coated Zn–Al–LDH shows better reversibility, lower charge-transfer resistance and more stable cycling performance.
Introduction
How to conquer the problems surrounding limited oil reserves and the threat of global warming has become a worldwide topic. A kind of excellent sustainable energy and powerful energy storage system has been urgently looked for to build a low-carbon society.1,2 The secondary battery is considered as a promising candidate to overcome the above problems in that it can serve as a sustainable energy and effective energy storage device. Considering the Ni–Zn alkaline secondary battery has many advantages such as excellent specific energy, high specific power, stable discharge platform, non-toxicity, high security, inexpensive and good low-temperature performance, it is widely used as a green power source in the increasing portable electronics and electric vehicles.3–5 Nonetheless, the extensive use of the Ni–Zn battery has been limited by its poor cycle capability which is mainly caused by the disadvantage of the zinc electrode, like the formation of zinc dendrites,6,7 shape change,8 surface passivation, self-discharge and zinc self-corrosion.9,10 Recently, great endeavors have been devoted to resolve these problems.Layered double hydroxide (LDH) is a class of lamellar compound which is comprised of positively charged metal hydroxide layers and negatively charged hydrated exchangeable anions in the interlayer.11 The chemical formula of LDH is expressed as [Ma(II)1−xMb(III)x(OH)2]x+(An−)x/n·mH2O, where M(II) and M(III) represent divalent and trivalent metal ions respectively, and An− is an interlayer anion.12 Because of the special layer structure, LDH has recently attracted intense research interest as the new modified electrodes.13,14 In our previous report, Zn–Al–hydrotalcite has been successfully synthesized, characterized and used as anodic material for Ni–Zn battery through our team.15 In the structure of Zn–Al–LDH, some Zn(II) ions, in the hostlayer, are replaced by Al(III) ions. It is favourable for the formation of crystal nucleus from zinc active material during deposition process and avoiding excessive growth of zinc dendrites.16 So, compared with the traditional zinc electrode material, the cycle capability of Zn–Al–LDH is superior.15 However, Zn–Al–LDH is a bad kind of conductive material17 which severely limits the electron transfer in the zinc electrode and suppresses the electrode reaction. Therefore, it needs to be decorated to improve its electrochemical performances. For decades, all kinds of inorganic additive, like Bi2O3,18 Ca(OH)2,19 TiO2,20 In2O3 and PbO21 have been used to enhance the electrochemical properties of the zinc electrode. Nevertheless, these additives are generally added into the zinc electrode through a traditional way of physical mixing, which is hard to efficiently use the additives and significantly perfect the electrochemical performance. For enhancing the use of the proportion of the additives and improving the electronic conduction of zinc electrode material, researchers paid more and more attention to surface modification. In our previous work, the structural characteristics and electrochemical performance of the novel anodic material, such as In(OH)3-coated Zn–Al–LDH,22,23 Ag-coated Zn–Al–LDH,24 have been studied in detail. The results indicate that these surface modifications indeed enhance the electrochemical performance of Zn–Al–LDH. But, the high-cost metallic compounds additive don't also beseem to the wholesale market of Ni–Zn cell. Consequently, another surface modification method is necessary to be found to improve the electrochemical performance of Zn–Al–LDH.
The conductive carbon possesses some advantages such as superior conductivity, chemical stability and low cost, so it is usually used to modify the electrode materials.25 Carbon-coating ZnO has also been successfully synthesized and used as anode material to enhance the electrochemical performance of Ni–Zn cell.26–28 However, because of the poor heat stability of Zn–Al–LDH,7,29,30 the role of carbon-coating on the electrochemical performance of Zn–Al–LDH is rarely investigated. In this article, carbon-coated Zn–Al–LDH will be synthesized through an in situ recovery method and its electrochemical performance will be also researched in detail.
Results and discussion
The structural analysis of materials
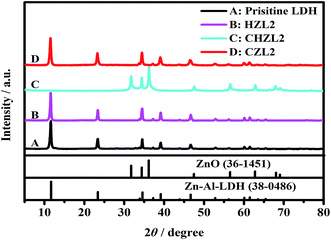
For investigating the change of Zn–Al–LDH during carbon-coating process, the XRD patterns for each step synthetic product of CZL2 are shown in Fig. 1. Here, the hydrothermal product of pristine LDH and 1.25 g glucose is labeled as HZL2, the calcined product is labeled as CHZL2 and the recovered product is labeled as CZL2. As seen from Fig. 1, the characteristic peaks of the pristine Zn–Al–LDH appear at 2θ = 11.64°, 23.39°, 34.56°, 39.15°, 60.12°, which correspond to (003), (006), (012), (015), (110) planes in the XRD standard of Zn–Al–LDH (JCPDS no. 38-0486), indicating that there is a rhombohedral structure (LDH). And, peaks of impurities weren't discriminated, demonstrating that the purity of the pristine LDH is very high. From Fig. 1, it can be found that the XRD pattern of HZL2 is similar to that of the pristine Zn–Al–LDH, which displays that the rhombohedral structure of Zn–Al–LDH has not been destroyed, illustrating the Zn–Al–LDH cannot react with glucose in the hydrothermal process. However, a obvious change is noticed from the XRD pattern of CHZL2 whose characteristic peaks move to 2θ = 31.77°, 34.42°, 36.25°, which are consistent with the reflections of (100), (002) and (101) in the XRD standard of ZnO (JCPDS file no. 36-1451), indicating that dehydration and decomposition of the LDH take place when the hydrothermal product is calcined at 500 °C.31 The formulation can be expressed as:| [Zn6Al2(OH)16](CO3)·mH2O → 6ZnO + Al2O3 + CO2 + 8H2O + mH2O | (1) |
However, the diffraction peak of aluminium oxide can not been observed in the XRD patterns of CHZL2. A previous study has reported that the diffraction peak of aluminium species cann't be observed when the LDH precursor transform into LDO.32 In time of the calcination process, the Al3+ is existing as an amorphous phase doped into ZnO nuclei which has been transformed from the Zn–Al–LDH precursor. With the temperature increasing, the ZnO phase formed a sheet-like structure through a preferred orientation growth along the (101) direction and two-dimensional expansion.7 Thus, the diffraction peak of aluminium oxide don't appear in the XRD patterns of CHZL2. Meanwhile, (003), (006), (012) reflections of the hydrotalcite phase are clearly detected in the XRD pattern of recovered product CZL2 again, indicating that the structure of hydrotalcite has been reconstructed after being dispersed in aqueous salt solution.
In terms of LDH, the average distance between cation–cation in the brucite-like layer can be expressed by the lattice parameter ‘a’ which is calculated through the formula: a = 2 × d(110), the lattice parameter ‘c’ corresponds to the thickness of the films, and can be calculated as follows: c/3 = 1/2 (d(003) + [2 × d(006)]).33 Table 1 shows the ‘d’ values of the (003), (006) and (110) for the pristine LDH and CZL2. By calculation, the lattice parameter ‘a’ of pristine LDH and CZL2 is 0.30764 and 0.30766 nm, respectively, and the lattice parameter ‘c’ is 2.28682 and 2.29395 nm, respectively. The similar lattice parameters imply that CO32− is successfully intercalated into the layer again, which is ascribed to the special memory effect of Zn–Al–LDH.34,35 When the calcined LDH is dispersed in a salt solution containing CO32−, it can adsorb CO32− from the salt solution due to its special memory effect. In this process, the elementary reactions are as follows:36
| CO3(aq)2− + H2O(l) ⇄ CO3(CZL)2− + H2O(CZL) | (2) |
| CO3(aq)2− + H2O(l) + O(CHZL)2− → CO3(CZL)2− + 2OH(CZL)− | (3) |
| Sample | d(003) (nm) | d(006) (nm) | d(110) (nm) |
|---|---|---|---|
| Pristine LDH | 7.6357 | 3.8049 | 1.5382 |
| CZL2 | 7.6512 | 3.8209 | 1.5383 |
So that the re-transformation of the calcined product to layered double hydroxide may be represented as:36
| 6ZnO + Al2O3 + CO32− + 9H2O + mH2O → [Zn6Al2(OH)16](CO3)·mH2O + 2OH− | (4) |
The reconstructed processes of LDH can be showed in Fig. 2.
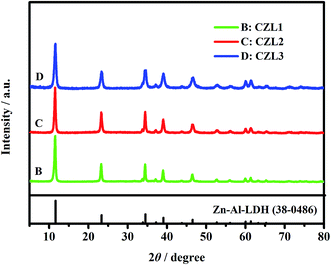
As seen from Fig. 3, the XRD patterns of these carbon-coated Zn–Al–LDH with different carbon content show the similar XRD patterns, presenting quite sharp, narrow and symmetrical diffraction peaks, which indicate that these carbon-coated Zn–Al–LDH all have a well-crystal. But, the carbon peak cannot be found in XRD patterns of carbon-coated Zn–AL–LDH. This phenomenon can be explained that the carbon coated upon the surface of Zn–Al–LDH is amorphous while the calcinations temperature doesn't reach 1000 °C and the content of carbon is low for the carbon-coated LDH.37
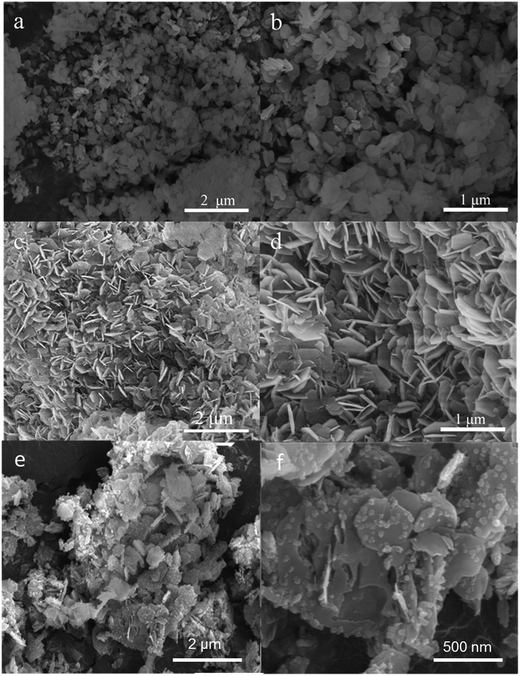
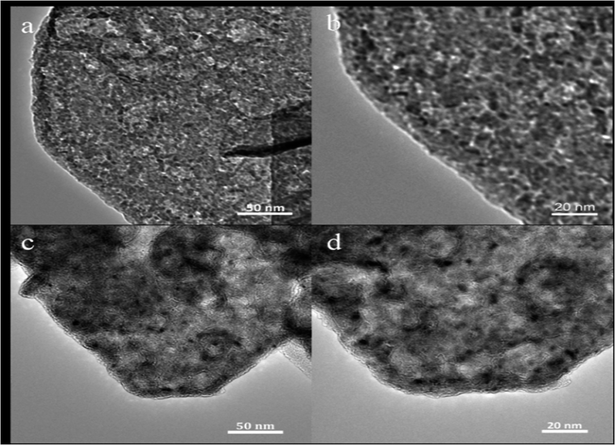
The SEM and TEM tests had been performed, indicating that these carbon-coated LDH were successfully synthesized. Fig. 4 shows the typical SEM images of the pristine Zn–Al–LDH, CZL2 and the intermediate product CHZL2. From Fig. 4(a and b), it can be observed that the pristine LDH particle mainly presents a rhombohedral structure and their size is about 200–400 nm. After in situ recovery, Fig. 4(c and d) shows that the structure of CZL2 still remains the rhombohedral structure. As seen in Fig. 4(e and f), the CHZL2 also keeps the rhombohedral structure and a lot of carbon particles with dozens of nanometers are distributed on the surface of CHZL2. The XRD results make clear that an in situ recovery method didn't destroy the structure of Zn–Al–LDH. To thoroughly clarify the existing carbon layer, TEM experiments were carried out. Fig. 5 shows the typical TEM images of the pristine Zn–Al–LDH and CZL2. Compared with Fig. 5(a–d) shows that there is indeed a carbon layer on the surface of CZL2, which is in agreement with the high magnification SEM image of the CHZL2 in Fig. 4f, indicating that carbon is successfully coated on the surface of Zn–Al–LDH and the carbon layer has no change before and after the in situ recovery.
In order to derive compositional information of the as-prepared sample CZL2, XPS was conducted (Fig. 6). In the studied spectrum (Fig. 6a), the peaks which belong to the binding energy of Zn2p, O1s, C1s and Al2p can be observed. The values for our sample are close to those reported for the Zn–Al–hydrotalcite compound: 74.0 eV for Al2p and 532.0 eV for O1s.38 It is obviously shown that the molar ratio of C to Zn is 3![[thin space (1/6-em)]](https://www.rsc.org/images/entities/char_2009.gif) :
:![[thin space (1/6-em)]](https://www.rsc.org/images/entities/char_2009.gif) 1 through the quantification of the XPS peaks, indicating that a great quantity of carbon atoms were formed around particles.39 In addition, the high-resolution XPS spectrum of C1s (Fig. 6b) can be deconvoluted into three peaks. The peak at 284.7 eV belongs to the C–C bonds in the disordered carbon frameworks,40 while the smaller ones at 287.1 and 289.5 eV suggest the existence of CO32−,38 indicating that CO32− is successfully intercalated into the layer of Zn–Al–LDH which is in agreement with XRD pattern.
1 through the quantification of the XPS peaks, indicating that a great quantity of carbon atoms were formed around particles.39 In addition, the high-resolution XPS spectrum of C1s (Fig. 6b) can be deconvoluted into three peaks. The peak at 284.7 eV belongs to the C–C bonds in the disordered carbon frameworks,40 while the smaller ones at 287.1 and 289.5 eV suggest the existence of CO32−,38 indicating that CO32− is successfully intercalated into the layer of Zn–Al–LDH which is in agreement with XRD pattern.
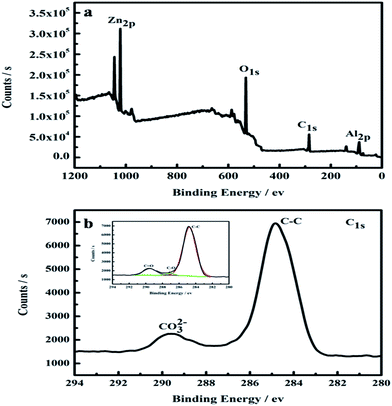 | ||
| Fig. 6 XPS spectra for the CZL2: (a) the survey spectrum, (b) C 1s. The inset in (b) shows the C 1s peak fitting of CZL2. | ||
The cyclic voltammograms of different zinc electrodes
For investigating the influence of carbon coating on the electrochemical performances of Zn–Al–LDH, CV measurements were studied. Fig. 7 shows the cyclic voltammograms of the different zinc electrodes. As seen from Fig. 7, the electrochemical behaviors governed by a pair of faradaic redox reactions were described through all the recorded CV curves which were correspond to a pair of redox peaks. The reaction equations during the charge/discharge processes can be represented as following:| Zn(OH)42− + 2e → Zn + 4OH− | (5) |
| Zn + 4OH− → Zn(OH)42− + 2e | (6) |
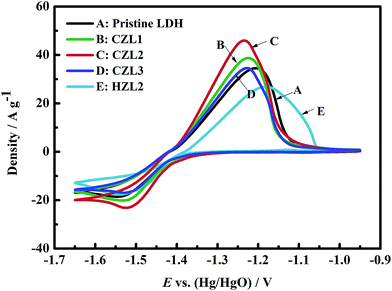 | ||
| Fig. 7 Cyclic voltammogram (CV) curves for the pristine Zn–Al–LDH electrode, the HZL2 electrode and the different carbon-coated Zn–Al–LDH electrodes at the fifth cycle. | ||
In the Fig. 7, the anodic peaks of CZL1, CZL2, CZL3, pristine LDH and HZL2 can be observed at −1.224, −1.236, −1.228, −1.207 and −1.179 V, respectively, and the corresponding cathodic peaks for CZL1, CZL2, CZL3, pristine LDH and HZL2 appear at −1.525, −1.517, −1.523, −1.545 and −1.543 V, respectively.
Normally, the reversibility of the electrode reaction is dependent upon the potential interval between the anodic and cathodic peak, and the smaller the potential interval is, the better the reversibility will be. By the calculation, the potential intervals for CZL1, CZL2, CZL3, pristine LDH and HZL2 are 0.301, 0.281, 0.295, 0.338 and 0.364 V, respectively. Compared with pristine LDH, HZL2 shows a larger potential interval which implies the worse reversibility of the HZL2 electrode. The reason is that the hydrothermal carbon on the surface of LDH have a poor conductivity which increases the ohmic polarization of Zn–Al–LDH and then leads to its worse reversibility. The smaller potential interval of CZL1, CZL2 and CZL3 indicate that the carbon-coated LDH electrodes possess a better reversibility than that of the pristine LDH and HZL2, owing to the enhanced electron conductivity of carbon after being calcined. Amorphous carbon on the surface of LDH provides a structure in which both threefold (sp2) and fourfold (sp3) exist through comparable proportions. A tetrahedrally-bonded carbon atom has four σ bonds with its neighbours, while a triply-bonded one has three σ bonds and one π orbital. The energy gap of the π–π* transition is much lower than that of the σ–σ* transition.41 Thus, the electronic properties of amorphous carbon will be controlled by the lower-gap π bonds.41 With the enhancement of calcined temperature,42 the sp2-content of amorphous carbon has been increased, improving the electron conductivity of calcined amorphous carbon. The amorphous carbon with superior electron conductivity can improve the electron conductivity of Zn–Al–LDH and decrease the ohmic polarization of Zn–Al–LDH. Therefore, the reversibility of the carbon-coated LDH electrodes is superior. Meanwhile, it can be also seen from Fig. 7 that the potential interval of CZL2 is smaller than that of CZL1 and CZL3. The different potential interval among the electrode CZL1, CZL2 and CZL3 is ascribed to the different amount of carbon. The low amount of carbon for CZL1 is not enough to improve the conductivity of active material, while the high amount of carbon for CZL3 limits the transfer of OH−, which is poor for the electrochemical reaction. Thus, compared with CZL1 and CZL3, the potential interval of CZL2 is smaller and the electrochemical reversibility is preferable.
The results of electrochemical impedance spectroscopy
To verify the result of carbon-coating on improving the charge-transfer performance of Zn–Al–LDH, the experiments of electrochemical impedance spectroscopy were carried out. Fig. 8 presents the impedance diagrams and the related fitting equivalent circuit of the different zinc electrodes. As seen in Fig. 8, Nyquist plots consist of a semicircular loop and a single straight line, which are in the high frequency and low frequency range, respectively. The depressed semicircular loop implies that the impedance spectra at high frequency can be simulated by the constant phase element (CPE) in parallel with the charge-transfer resistance (Rct). The CPE of zinc electrode isn't the pure capacitance due to its rough surface, leading to the dispersion effect which makes the double-layer of zinc electrode deviates from the pure capacitance. The straight line exhibited in the low frequency range can be interpreted as the resistance for the diffusion of zincate in the zinc electrodes. According to the ref. 24 and 43, the equivalent circuit displayed in the inset of the Nyquist diagram in Fig. 8 is used to represent the impedance spectra. In the equivalent circuit, where CPE, Rct, Zw and Re represent the constant phase element, charge-transfer resistance, Warburg impedance and the ohmic resistance which include the resistance of the electrode material, electrolyte, current collector, etc.44 Table 2 shows the data for the EIS curves for the pristine LDH and different carbon-coated LDH. As seen from Table 2, the pristine LDH reveals a larger value of Rct (17.27 Ω), while the carbon-coated LDH exhibits a smaller value of Rct (CZL1 = 12.42 Ω, CZL2 = 4.71 Ω, CZL3 = 6.95 Ω), indicating that the existing carbon layer upon the surface of LDH has an obviously influence on decreasing the Rct, which plays a crucial role in the whole electrode reaction process.23 According to the eqn (7), Rct is inversely proportional to current density.| 1/Rct = (∂IF/∂E)ss | (7) |
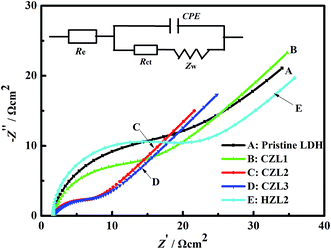 | ||
| Fig. 8 The electrochemical impedance spectroscopes for the pristine Zn–Al–LDH electrode, the HZL2 electrode and the different carbon-coated Zn–Al–LDH electrodes at the fifth cycle. | ||
| Element | Pristine LDH | CZL1 | CZL2 | CZL3 | HZL2 |
|---|---|---|---|---|---|
| Rct (Ω) | 17.27 | 12.42 | 4.71 | 6.95 | 18.56 |
The smaller Rct means that the current density is larger and the electrochemical reaction is easier. Thus, the as-prepared active materials can provide high electronic conductivity and faster electron transportation due to the smaller Rct that result from the carbon coating upon the surface of carbon-coated LDH. The above result indicates that the carbon coating indeed enhanced the electrochemical properties of the anode for Ni–Zn batteries. Meanwhile, Table 2 shows that the charge transfer resistance of HZL2 is the biggest among these zinc electrodes, which indicates that the electrode reaction of HZL2 is the most difficult. The reason is that the degree of graphitization for hydrothermal carbon on the surface of HZL2 is low, which leads to the inferior conductivity for HZL2.
The analysis of galvanostatic charge–discharge and cycle performance
Fig. 9 displays the typical curves of charge (a) and the discharge (b) for these as-prepared zinc electrodes at the 20th cycle. As shown in Fig. 9, the carbon-coated LDH electrodes show a lower charge voltage platform and a higher discharge voltage platform than that of the pristine LDH electrode. It demonstrates that the charge conversion efficiency of carbon-coated LDH is higher than that of the pristine LDH due to that the carbon on the surface of LDH improves the conductivity of LDH. In other words, the ohmic polarization of zinc electrode can be weakened by the small internal resistance of carbon-coated LDH. Meanwhile, Fig. 9 presents that the HZL2 electrode owns the highest charge voltage platform and the lowest discharge voltage platform among the different zinc electrodes, indicating that the polarization of HZL2 is the biggest. This phenomenon can be explained that the hydrothermal carbon coated on the surface of LDH have a poor conductivity which can increase internal resistance of LDH and then aggravates its ohmic polarization.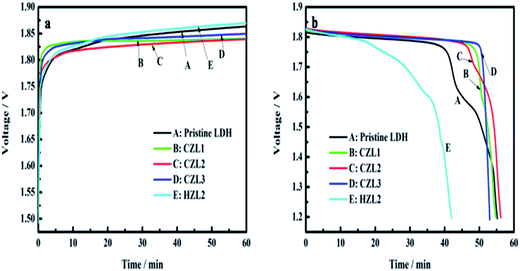 | ||
| Fig. 9 (a) Charge curves and (b) discharge curves of pristine LDH, CZL1, CZL2 and CZL3 at 20th cycle. | ||
Electrochemical cyclic performance of the pristine LDH electrode, the HZL2 electrode and the different carbon-coated LDH electrodes at current rate of 1C are shown in Fig. 10. Here, the theoretical specific capacity for pristine LDH is 380 mA h g−1. However, because carbon is not the active material, the adopted theoretical specific capacity for CZL1, CZL2, CLZ3 and HZL2 are 375, 365, 360 and 365 mA h g−1, respectively. For the pristine LDH electrode, the specific discharge capacity achieves the maximum 350 mA h g−1 at the 10th cycle and the retention rate is 92%. Despite the specific discharge capacity is high at initial several cycle, it fade rapidly soon afterwards. As seen from Fig. 10, the specific discharge capacity of pristine LDH electrode begins to fade at the 220th cycle and decreases to 140 mA h g−1 at the 440th cycle, whose retention rate is 37%. As for the carbon-coated LDH, Fig. 10 shows that CZL1, CZL2, CLZ3 and HZL2 deliver the average specific discharge capacity of 344, 350, 332 and 312 mA h g−1 at the initial 500 cycles, respectively, and the corresponding retention rate is 89%, 95%, 92% and 85%, respectively. However, in comparison with the continuous stability of CZL2 and CZL3, the specific discharge capacity of CZL1 begins to fade at the 500th cycle and decreases to 246 mA h g−1 with a retention rate of 65% at the 600th cycle.
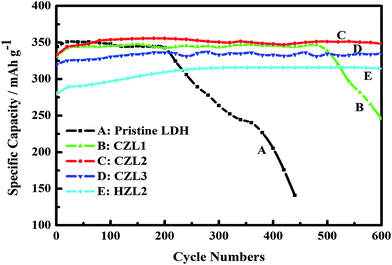 | ||
| Fig. 10 The variation of specific discharge capacity with the cycle numbers of the pristine Zn–Al–LDH electrode, the HZL2 electrode and the different carbon-coated Zn–Al–LDH electrode. | ||
The above results indicate that, although the initial specific discharge capacity of carbon-coated LDH is lower, the later specific discharge capacity is higher and the stability is also remarkably superior than that of the pristine LDH. The reason is that the special array shown in Fig. 4(c and d) is helpful to form a more even distribution of current and decrease the polarization. In addition, the existing carbon layer over the surface of LDH not only can enhance the electron conductivity of active material but also can reduce the direct contact between active material and electrolyte. The improved conductivity is in favor of enhancing the charge conversion efficiency. And, the decreased direct contact can slow down the dissolving capacity of active material. These above causes lead to the high utilization of the active material for the carbon-coated Zn–Al–LDH electrodes. Thus, the carbon-coated Zn–Al–LDH shows a better cycle stability. In comparison with the CZL2 and CZL3, the inferior cycle stability for CZL1 can be attributed to the low carbon content, which is bad for improving the conductivity and decreasing the direct contact, sufficiently. Meanwhile, Fig. 10 presents that HZL2 shows a lower discharge specific capacity than that of CZL2. It can be explained that the conductivity of carbon over the surface of LDH is improved by a calcined method. The superior discharge capacity of carbon-coated LDH indicates that carbon-coating can improve the cycle stability and utilization of Zn–Al–LDH.
Experimental
The preparation of carbon-coated Zn–Al–LDH
The pristine Zn–Al–LDH was obtained through a hydrothermal method. In the typical experimental operation, a salt solution (35 mL) of Al(NO3)3·9H2O (0.0025 mol) and Zn (NO3)2·6H2O (0.0075 mol) was mixed with a alkaline solution (35 mL) of NaOH (0.02 mol) and Na2CO3 (0.005 mol) under vigorous stirring at 65 °C for 40 min. Then, the suspension was centrifuged at 4000 rpm for 2 min, and washed for a few times with water and ethanol. Afterwards, the slurry was diluted with deionized water and poured into an autoclave pressure vessel to react at 120 °C for 24 h. At last, the obtained precipitation was filtered, washed for several times with distilled water and ethanol, dried for 12 h under 60 °C and ground to fine powder. The carbon-coated Zn–Al–LDH precursor was prepared by the method of hydrothermal carbonization of glucose. Then, in order to improve the electrical conductivity and electrochemical stability, the precursor was further carbonized at 500 °C under N2 atmosphere. Subsequently, the calcined precursor was dispersed in an alkaline solution to get carbon-coated Zn–Al–LDH. The typical synthesis process is as follows: firstly, dissolving a certain amount of glucose and 0.5 g pristine Zn–Al–LDH in 50 mL water under constant ultrasound for 15 min to form a suspension, which was transferred into a Teflon-lined autoclave and reacted at 180 °C for 3 h. After filtrated, washed with deionized water for a few times, the obtained precipitate was put into a vacuum oven at 65 °C for 6 h and ground to powder for further research. Thereafter, the powder was further carbonized at 500 °C for 6 h under N2 atmosphere. At last, 0.2 g calcined precursor was dispersed in 400 mL pH = 10 buffer solution containing Na2CO3 and NaHCO3 under vigorous stirring for 72 h. The mass of glucose adding into the above solution was 0.75, 1.25 and 1.75 g and the corresponding samples were marked as CZL1, CZL2, and CZL3, respectively.Material characterization
The morphology and microstructure of the samples were studied using scanning electron microscope (SEM, FEI Nova NanoSEM 230) and high resolution transmission electron microscopy (HRTEM, JEOL 4000EX), while the XRD patterns were performed on a D500 (Siemens) diffractometer (36 kV, 30 mA) using Cu Kα radiation. The XPS patterns of carbon-coated Zn–Al–LDH was recorded by a ESCALAB250Xi.The preparation of zinc electrodes and tested cells
For preparing the zinc electrodes, the as-prepared carbon-coated Zn–Al–LDH samples, acetylene black and polytetrafluoroethylene (PTFE) were mixed thoroughly according to the mass ratio of 85![[thin space (1/6-em)]](https://www.rsc.org/images/entities/char_2009.gif) :
:![[thin space (1/6-em)]](https://www.rsc.org/images/entities/char_2009.gif) 10
10![[thin space (1/6-em)]](https://www.rsc.org/images/entities/char_2009.gif) :
:![[thin space (1/6-em)]](https://www.rsc.org/images/entities/char_2009.gif) 5. The resulting mixture above was pasted on a copper mesh substrate (10 mm × 10 mm in size) which served as current collector. Afterwards, the as-prepared zinc electrodes were pressed to thin sheet with a thickness of 0.3 mm and dried at 60 °C in the vacuum oven. Then, the zinc electrode with pristine Zn–Al–LDH was also prepared through the same way for comparison. The positive electrode was the commercial sintered Ni(OH)2 whose capacity was higher than that of zinc electrodes on account of making full use of zinc electrode. A solution of 6 M KOH, saturated with ZnO, was served as the electrolyte. The sintered Ni(OH)2 electrode and zinc electrode were assembled with the electrolyte to prepare the testing cell.
5. The resulting mixture above was pasted on a copper mesh substrate (10 mm × 10 mm in size) which served as current collector. Afterwards, the as-prepared zinc electrodes were pressed to thin sheet with a thickness of 0.3 mm and dried at 60 °C in the vacuum oven. Then, the zinc electrode with pristine Zn–Al–LDH was also prepared through the same way for comparison. The positive electrode was the commercial sintered Ni(OH)2 whose capacity was higher than that of zinc electrodes on account of making full use of zinc electrode. A solution of 6 M KOH, saturated with ZnO, was served as the electrolyte. The sintered Ni(OH)2 electrode and zinc electrode were assembled with the electrolyte to prepare the testing cell.
The measurements of electrochemical performances
All the as-prepared cells must be pre-activated before the electrochemical testing. The process of pre-activated was as follows: firstly, all the cells were charged at 0.1C for 10 h and discharged at 0.2C down to 1.2 V cutoff voltage for 2 times. Then, the cells were charged at 1C for 1 h and discharged at 1C down to 1.2 V cutoff voltage for 3 times. The tests of CV and EIS were performed at a three-electrode cell system including reference electrode worked by a Hg/HgO electrode, counter electrode worked by a Ni(OH)2 electrode, and working electrode worked by a zinc electrode. The CV testing was carried out on a battery-testing apparatus (RST-5000) at a scan rate of 10 mV s−1, in the voltage range of −0.95 to −1.65 V. The AC-Impedance testing was performed using an electrochemical workstation (PARSTAT-2273). The AC signal amplitude was 10 mV and the frequency range was between 0.01 Hz and 100 kHz. The GCD cycles were tested using a battery test system of Neware BTS-5 V/100 mA. The testing batteries were circularly charged at 1C for 1 h up to 2.5 V cutoff voltage and discharged at 1C down to a cutoff voltage of 1.2 V. In addition, all electrochemical tests above were performed at room temperature (25 ± 2 °C).Conclusions
Carbon-coated Zn–Al–LDH has been synthesized successfully by an in situ recovery method. Compared with pristine Zn–Al–LDH, the electrochemical testing results reveal that the carbon-coated Zn–Al–LDH, especially which obtained with 1.25 g glucose shows the highest discharge capacity and superior cycle performance. The improved performance benefited from the carbon layer existing over the surface of Zn–Al–LDH, which can enhance the conductivity of active material and slow down its corrosion. A new technique to modify Zn–Al–LDH which can be used as anode material of Ni–Zn cells has been proved by these results.Conflicts of interest
There are no conflicts to declare.Acknowledgements
This work was financially supported by the National Natural Science Foundation of China (no. 21371180), Doctoral Fund of Ministry of Education of China (20130162110018) and the Science and Technology Project of Changsha city (no. k1303015-11).Notes and references
- Y. Wang, P. He and H. Zhou, Energy Environ. Sci., 2011, 4, 805–817 CAS.
- J. Wang and X. Sun, Energy Environ. Sci., 2012, 5, 5163–5185 CAS.
- Z. Feng, Z. Yang, J. Huang, X. Xie and Z. Zhang, J. Electrochem. Soc., 2014, 161, A1981–A1986 CrossRef CAS.
- J. Huang, Z. Yang, B. Yang, R. Wang and T. Wang, J. Power Sources, 2014, 271, 143–151 CrossRef CAS.
- X. Xie, Z. Yang, Z. Feng, Z. Zhang and J. Huang, Electrochim. Acta, 2015, 154, 308–314 CrossRef CAS.
- I. Arise, S. Kawai, Y. Fukunaka and F. McLarnon, J. Electrochem. Soc., 2013, 160, D66–D74 CrossRef CAS.
- J. Huang, Z. Yang, R. Wang, Z. Zhang, Z. Feng and X. Xie, J. Mater. Chem. A., 2015, 3, 7429–7436 CAS.
- F. R. McLarnon and E. J. Cairns, J. Electrochem. Soc., 1991, 138, 645–656 CrossRef CAS.
- K. Bass, P. Mitchell, G. Wilcox and J. Smith, J. Power Sources, 1991, 35, 333–351 CrossRef CAS.
- J. Jindra, J. Power Sources, 2000, 88, 202–205 CrossRef CAS.
- H. F. W. Taylor, Mineral. Mag., 1973, 304, 377–389 Search PubMed.
- Z. Liu, R. Ma, M. Osada, N. Iyi, Y. Ebina, K. Takada and T. Sasaki, J. Am. Chem. Soc., 2006, 128, 4872–4880 CrossRef CAS PubMed.
- S. Aisawa, Y. Ohnuma, K. Hirose, S. Takahashi, H. Hirahara and E. Narita, Appl. Clay Sci., 2005, 28, 137–145 CrossRef CAS.
- J. Qiu and G. Villemure, J. Electroanal. Chem., 1997, 428, 165–172 CrossRef CAS.
- X. Fan, Z. Yang, R. Wen, B. Yang and W. Long, J. Power Sources, 2013, 224, 80–85 CrossRef CAS.
- P. Gu, R. Pascual, M. Shirkhanzadeh, S. Saimoto and J. Scott, Hydrometallurgy, 1995, 37, 267–281 CrossRef CAS.
- J. Long, Z. Yang, X. Zeng and J. Huang, RSC Adv., 2016, 6, 92896–92904 RSC.
- J. McBreen and E. Gannon, J. Power Sources, 1985, 15, 169–177 CrossRef CAS.
- Y. Yuan, J. Tu, H. Wu, Y. Li, D. Shi and X. Zhao, J. Power Sources, 2006, 159, 357–360 CrossRef CAS.
- R. Shivkumar, G. P. Kalaignan and T. Vasudevan, J. Power Sources, 1998, 75, 90–100 CrossRef CAS.
- J. McBreen and E. Gannon, Electrochim. Acta, 1981, 26, 1439–1446 CrossRef CAS.
- B. Yang, Z. Yang and R. Wang, J. Power Sources, 2014, 251, 14–19 CrossRef CAS.
- B. Yang, Z. Yang, R. Wang and Z. Feng, J. Mater. Chem. A., 2014, 2, 785–791 CAS.
- X. Fan, Z. Yang, W. Long, Z. Zhao and B. Yang, Electrochim. Acta, 2013, 92, 365–370 CrossRef CAS.
- H. Li and H. Zhou, Chem. Commun., 2012, 48, 1201–1217 RSC.
- Z. Feng, Z. Yang, J. Huang, X. Xie and Z. Zhang, J. Power Sources, 2015, 276, 162–169 CrossRef CAS.
- W. Long, Z. Yang, X. Fan, B. Yang, Z. Zhao and J. Jing, Electrochim. Acta, 2013, 105, 40–46 CrossRef CAS.
- J. Huang and Z. Yang, ECS Electrochem. Lett., 2014, 3, A116–A119 CrossRef CAS.
- P. B. Messersmith and S. I. Stupp, Chem. Mater., 2002, 7, 454–460 CrossRef.
- M. Turco, G. Bagnasco, U. Costantino, F. Marmottini, T. Montanari, G. Ramis and G. Busca, J. Catal., 2004, 228, 43–55 CAS.
- G. S. Thomas, A. Radha, P. V. Kamath and S. Kannan, J. Phys. Chem. B, 2006, 110, 12365–12371 CrossRef CAS PubMed.
- X. Zhao, F. Zhang, S. Xu, D. G. Evans and X. Duan, Chem. Mater., 2010, 22, 3933–3942 CrossRef CAS.
- M. Del Arco, P. Malet, R. Trujillano and V. Rives, Chem. Mater., 1999, 11, 624–633 CrossRef CAS.
- T. Hibino and A. Tsunashima, Chem. Mater., 1998, 10, 4055–4061 CrossRef CAS.
- L. Li, R. Ma, N. Iyi, Y. Ebina, K. Takada and T. Sasaki, Chem. Commun., 2006, 29, 3125–3127 RSC.
- A. Marchi and C. Apesteguıa, Appl. Clay Sci., 1998, 13, 35–48 CrossRef CAS.
- Q. Cao, H. Zhang, G. Wang, Q. Xia, Y. Wu and H. Wu, Electrochem. Commun., 2007, 9, 1228–1232 CrossRef CAS.
- Y. Gao, M. Nagai, Y. Masuda, F. Sato, W. Seo and K. Koumoto, Langmuir, 2006, 22, 3521–3527 CrossRef CAS PubMed.
- H. Cao, G. Huang, S. Xuan, Q. Wu, F. Gu and C. Li, J. Alloys Compd., 2008, 448, 272–276 CrossRef CAS.
- W. Luo, X. Hu, Y. Sun and Y. Huang, Phys. Chem. Chem. Phys., 2011, 13, 16735–16740 RSC.
- D. Dasgupta, F. Demichelis and A. Tagliaferro, Philos. Mag. B, 1991, 63, 1255–1266 CAS.
- T. Okpalugo, P. Maguire, A. Ogwu and J. McLaughlin, Diamond Relat. Mater., 2004, 13, 1549–1552 CrossRef CAS.
- Y. Yuan, J. Tu, H. Wu, C. Zhang, S. Wang and X. Zhao, J. Power Sources, 2007, 165, 905–910 CrossRef CAS.
- J. Long, Z. Yang, J. Huang and X. Zeng, J. Power Sources, 2017, 359, 111–118 CrossRef CAS.
| This journal is © The Royal Society of Chemistry 2017 |

