 Open Access Article
Creative Commons Attribution 3.0 Unported Licence
Mitigation of acid corrosion on carbon steel by novel pyrazolone derivatives
M. A. Deyab *a,
A. S. Foudab,
M. M. Osmana and
S. Abdel-Fattaha
aEgyptian Petroleum Research Institute (EPRI), PO Box 11727, Nasr City, Cairo, Egypt. E-mail: hamadadeiab@yahoo.com; Fax: +20 222747433; Tel: +20 1006137150
bDepartment of Chemistry, Faculty of Science, El-Mansoura University, El-Mansoura, Egypt
First published on 22nd September 2017
Abstract
For the corrosion of carbon steel in 1.0 M HCl solution, the new pyrazolone derivatives (PY1 and PY2) have been identified as active corrosion inhibitors. Clear evidence of the inhibitory effect of pyrazolone derivatives is given by potentiodynamic polarization, electrochemical impedance spectroscopy (EIS) and electrochemical frequency modulation (EFM) measurements. The synthesized compounds were characterized by spectroscopic and 1H-NMR techniques. The purity of compounds was confirmed by TLC. Our findings show that pyrazolone compounds inhibited the corrosion of carbon steel in the acid medium. Inhibition efficiency increases with the increase in concentration of compounds. The inhibition efficiency of PY2 was higher than that of PY1. These inhibitors obey the Temkin adsorption isotherm. It was found that the pyrazolone derivatives act by physisorption on carbon steel.
1. Introduction
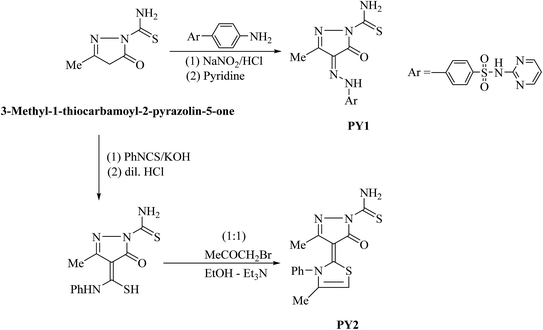
Acid solutions are commonly used for the removal of undesirable scale and rust in the metal working, cleaning of boilers and heat exchangers. Hydrochloric acid is most widely used for all these purposes. However, the strong corrosivity of hydrochloric acid needs to be controlled by appropriate corrosion inhibitors.1–4 Most of the efficient acid inhibitors are organic compounds which generate a thin film that controls and prevents access of corrosive agents to the metal surface. These organic inhibitors containing nitrogen, sulphur and/or oxygen atoms.5–7 The inhibition efficiency also increases with the increase in the number of aromatic ring.8,9 Many studies revealed that pyrazole and thiazole derivatives are effective corrosion inhibitors up to 80 °C attributed to their molecular structure.10–13 The planarity and pairs of free electrons in heteroatoms are important characteristics that determine the adsorption of these molecules on the metal surface. Furthermore, some studies showed that the inhibition of corrosion by organic dyes is mainly attributed to the formation of complex compounds between the metal-ions and the nitrogen of azo binding at the electrode surface.14 These encouraging results have incited us to synthesise two new pyrazolone compounds which were obtained through diazo-coupling reaction or the base prompted addition of 3-methyl-1-thiocarbamoyl-2-pyrazolin-5-one to equimolar amount of phenyl isothiocyanate followed by heterocyclization with α-halogenated reagent to afford the corresponding thiazolyl pyrazolone derivative. These pyrazolone compounds were tested as corrosion inhibitors for carbon steel in acidic media.2. Experimental
2.1. Materials and chemicals
The working electrode made of carbon steel sheets (supplied from Alexandria National Iron and Steel Company) with the following chemical composition (wt%): C (0.200), Si (0.003), Mn (0.35), P (0.02) and Fe (Rest). The electrode was of dimension 1 cm × 1 cm and was welded from one side to a copper wire used for the electrical connection. The sample was embedded in a glass tube of just larger diameter than the sample. Epoxy resin (supplied from Ciba Co.) was used to stick the sample to the glass tube. The surface of carbon steel electrode was mechanically abraded using different grades of sand papers, which ended with the 1200 grade, prior to use.The tests were performed in 1.0 M HCl solution (supplied from Sigma-Aldrich) with the addition of various concentrations of pyrazolone compounds.
All the test solutions were prepared from analytical grade chemical reagents using distilled water and used without further purification. For each run, a freshly prepared solution was used.
The temperature of solutions was thermostatically controlled at desired value.
2.2. Synthesis and reactions
The inhibitors were synthesized (as shown in Scheme 1) and characterized by proton nuclear magnetic resonance (1H-NMR) using a Bruker WP 300 spectrometer at 300 MHz using TMS as an internal standard and DMSO-d6 as solvent, Infrared (IR) spectroscopy on a Thermo Scientific Nicolet iS 50 FT-IR spectrometer. The mass spectra were performed using a Shimadzu Qp-2010 mass spectrometer at 70 eV. Elemental analyses were carried out at the Microanalytical Unit, Cairo University, Giza, Egypt; the results were in satisfactory agreement with the calculated values.![[small nu, Greek, macron]](https://www.rsc.org/images/entities/i_char_e0ce.gif) /cm−1): 3424, 3355, 3255, 3107 (NH2 and 2 NH), 1651 (C
/cm−1): 3424, 3355, 3255, 3107 (NH2 and 2 NH), 1651 (C![[double bond, length as m-dash]](https://www.rsc.org/images/entities/char_e001.gif) O, pyrazole ring), 1582 (C
O, pyrazole ring), 1582 (C![[double bond, length as m-dash]](https://www.rsc.org/images/entities/char_e001.gif) N); 1H NMR (DMSO-d6): δ/ppm = 2.148 (s, 3H, CH3),7.03 (t, 1H, Ar–H), 7.64 (d, 2H, Ar–H), 7.97 (d, 2H, Ar–H), 8.49 (d, 2H, Ar–H), 9.61 (s, 2H, NH2), 11.63 (s, 2H, NH and = NNH). Anal. calcd for C15H14N8O3S2 (418.09): C, 43.06; H, 3.37; N, 26.78; found: C, 45.37; H, 4.48; N, 28.05.
N); 1H NMR (DMSO-d6): δ/ppm = 2.148 (s, 3H, CH3),7.03 (t, 1H, Ar–H), 7.64 (d, 2H, Ar–H), 7.97 (d, 2H, Ar–H), 8.49 (d, 2H, Ar–H), 9.61 (s, 2H, NH2), 11.63 (s, 2H, NH and = NNH). Anal. calcd for C15H14N8O3S2 (418.09): C, 43.06; H, 3.37; N, 26.78; found: C, 45.37; H, 4.48; N, 28.05.![[small nu, Greek, macron]](https://www.rsc.org/images/entities/i_char_e0ce.gif) /cm−1): 3122, 3167 (NH2), 1641 (C
/cm−1): 3122, 3167 (NH2), 1641 (C![[double bond, length as m-dash]](https://www.rsc.org/images/entities/char_e001.gif) O), 1589 (C
O), 1589 (C![[double bond, length as m-dash]](https://www.rsc.org/images/entities/char_e001.gif) N); 1H NMR (DMSO-d6): δ/ppm = 2.09 (s, 3H, CH3), 2.50 (s, 3H, CH3), 5.21 (s, 1H, thiazole H-5), 7.02–7.35 (m, 5H, Ar–H), 9.45 (s, 2H, NH2); anal. calcd for C15H14N4OS2 (330.06): C, 54.52; H, 4.27; N, 16.96. Found: C, 54.71; H, 4.20; N, 17.07.
N); 1H NMR (DMSO-d6): δ/ppm = 2.09 (s, 3H, CH3), 2.50 (s, 3H, CH3), 5.21 (s, 1H, thiazole H-5), 7.02–7.35 (m, 5H, Ar–H), 9.45 (s, 2H, NH2); anal. calcd for C15H14N4OS2 (330.06): C, 54.52; H, 4.27; N, 16.96. Found: C, 54.71; H, 4.20; N, 17.07.2.3. Electrochemical measurements
Electrochemical experiments were carried out in the conventional three-electrode cell with a platinum counter electrode (CE) and a saturated calomel electrode (SCE) coupled to a fine Luggin capillary as the reference electrode. All electrochemical measurements were carried out using Gamry PCI4G750 Potentiostat/Galvanostat/ZRA analyzer.The potential of potentiodynamic polarization curves were started from a potential of −250 mV to +250 mV versus OCP with a sweep rate of 0.166 mV s−1.
Electrochemical impedance spectroscopy (EIS) was carried out at Ecorr after immersion in the solution without bubbling. After the determination of steady-state current at a given potential, sine wave voltage (5.0 mV) peak to peak, at frequencies between 100 kHz and 0.1 Hz, were superimposed on the rest potential. The experimental impedance was analyzed and interpreted on the basis of the equivalent circuit. Gamry applications include EIS300 software for EIS measurements and Echem Analyst 5.5 software for results plotting, graphing, data fitting, and calculating.
Electrochemical frequency modulation (EFM) is a new technique for corrosion rate measurement. In EFM, two AC voltage waveforms are summed and applied to a corrosion sample. In this study, EFM was measured by applying potential perturbation signal with amplitude of 10 mV with two sine waves of 2 and 5 Hz. The base frequency was 0.1 Hz, so the waveform repeats after 1 s. The higher frequency must be at least two times the lower one. The intermodulation spectra contain current responses assigned for harmonical and intermodulation current peaks. The larger peaks were used to calculate the corrosion current density (Icorr(EFM)), the Tafel slopes (βa and βc), and the causality factors CF2 & CF3. The causality factors are used to validate the data.16 EFM 140 software was used for plotting, graphing, and fitting data.
Each electrochemical experiment has been repeated three times and the mean values reported.
3. Results and discussion
3.1. Polarization measurements
Fig. 1 and 2 illustrate the cathodic and anodic potentiodynamic polarization curves of carbon steel in 1.0 M HCl at 298 K under the influence of adding increasing the amounts of the two inhibitors PY1 and PY2 (from 100 to 300 ppm). It clears from figures that both cathodic and anodic reaction were suppressed by PY1 and PY2, which suggests that the two inhibitors reduces anodic dissolution and retards the hydrogen evolution reaction.17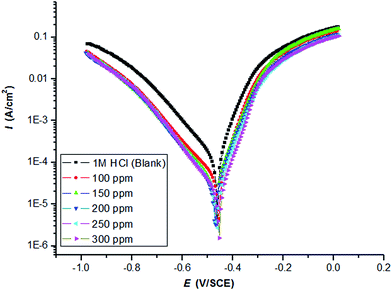 | ||
| Fig. 1 Potentiodynamic polarization curves of carbon steel in 1.0 M HCl in the absence and presence of PY1 at 298 K with a sweep rate of 0.166 mV s−1. | ||
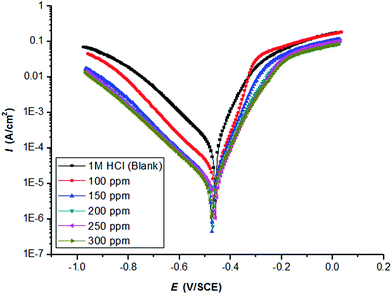 | ||
| Fig. 2 Potentiodynamic polarization curves of carbon steel in 1.0 M HCl in the absence and presence of PY2 at 298 K with a sweep rate of 0.166 mV s−1. | ||
The electrochemical parameters such as Tafel slopes (anodic βa and cathodic βc), corrosion potential (Ecorr) and corrosion current density (Icorr) are presented in Table 1.
| Inhibitor | Cinh ppm | Icorr μA cm−2 | Ecorr mV per SCE | βa mV per dec | βc mV per dec | ηp (%) |
|---|---|---|---|---|---|---|
| PY1 | 0 | 104.43 ± 4.5 | −460.71 ± 3.2 | 61.20 | 138.90 | — |
| 100 | 34.16 ± 2.3 | −455.06 ± 4.3 | 55.10 | 146.00 | 67.28 | |
| 150 | 32.67 ± 2.4 | −468.75 ± 4.5 | 67.00 | 143.90 | 68.72 | |
| 200 | 23.96 ± 1.9 | −468.52 ± 2.2 | 64.60 | 131.90 | 77.05 | |
| 250 | 21.83 ± 2.1 | −464.10 ± 2.9 | 64.90 | 128.90 | 79.10 | |
| 300 | 16.28 ± 1.2 | −454.82 ± 3.4 | 61.40 | 123.60 | 84.41 | |
| PY2 | 0 | 104.43 ± 4.5 | −460.71 ± 3.2 | 61.20 | 138.90 | — |
| 100 | 20.00 ± 2.1 | −457.88 ± 4.2 | 52.70 | 134.40 | 80.85 | |
| 150 | 11.09 ± 1.3 | −470.18 ± 5.1 | 58.40 | 145.50 | 89.38 | |
| 200 | 10.65 ± 1.1 | −470.37 ± 2.6 | 64.10 | 150.30 | 89.81 | |
| 250 | 9.34 ± 0.9 | −462.71 ± 3.8 | 62.70 | 153.40 | 91.05 | |
| 300 | 9.18 ± 0.9 | −471.55 ± 3.8 | 66.40 | 148.50 | 91.21 |
The inhibition efficiency (ηp%) of two inhibitors PY1 and PY2 is calculated according to the following equation:18
| ηp% = [(Icorr(blank) − Icorr)/Icorr(blank)] × 100 | (1) |
Clearly, Icorr remarkably decreased, while ηp% increased with the PY1 and PY2 concentration and the maximum ηp% values were 84.41% and 91.21% at 300 ppm PY1 and PY2, respectively.
There was no definite trend in the shift of Ecorr in the presence of PY1 and PY2; therefore, PY1 and PY2 could be mixed-type inhibitors, with the inhibitory action caused by a geometric blocking effect.19,20 However, there is no significant change in Tafel slopes (anodic βa and cathodic βc), after PY1 and PY2 addition, which indicates that the studied inhibitors do not change the cathodic and anodic reactions mechanism. This means that the two inhibitors act as adsorptive inhibitors.21–23
It is evident that the inhibition efficiency of the two inhibitors increases with increasing their concentrations as a result of increasing their surface coverage θ (θ = ηp%/100)24 on the electrode surface. The inhibition efficiency of PY2 in all cases was higher than that of PY1.
Pyrazolone compounds (PY1 and PY2) are bearing three heteroatoms (N, O and S) in their constructions. These heteroatoms are the major adsorption centers.25–27 The adsorption of pyrazolone compounds is generally over the metal surface forming an adsorption layer that functions as a barrier protecting the metal from aggressive acidic medium.28–31 Besides of heteroatoms, aromatic ring systems available in the structures of pyrazolone compounds can also increase adsorptions and consequently enhance inhibition efficiencies of these compounds.32
However, the aromatic group retards the adsorption process of PY1 compound on metal surface, comparing to PY2 compound. This retardation process came into account from the steric hindrance of the aromatic group within structure of PY1 compound; therefore its adsorption process be less spontaneous than compound PY2.33
3.2. Open circuit potential
Fig. 3 shows that OCP time plots for carbon steel in 1.0 M HCl containing various concentrations of PY1 and PY2 at OCP and 298 K.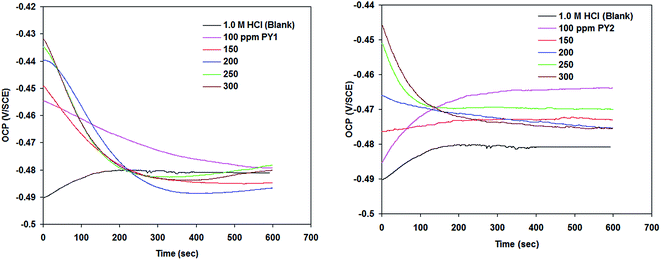 | ||
| Fig. 3 Open circuit potential (OCP) for carbon steel in 1.0 M HCl in the absence and presence of PY1 and PY2 at 298 K. | ||
It was found that overall the presence of PY1 and PY2 shifted the OCP towards negative potentials. The drop in OCP during the first 200 seconds is frequently ascribed to dissolution of a native oxide previously formed on the carbon steel surface as a result of contact with the atmosphere. A shift to the negative region is also an indication of an active surface.
3.3. EIS measurements
Further work was carried out to clarify the influence of the two inhibitors PY1 and PY2 on the corrosion behavior of carbon steel in 1.0 M HCl by EIS measurement.The main advantages of EIS are to follow the corrosion behavior of the metal with constant time. Before starting measurement each electrode was immersed in test solution for 30 min.
Fig. 4 and 5 illustrate the impedance spectra (Nyquist/Bode) for carbon steel in 1.0 M HCl containing various concentrations of PY1 and PY2, respectively at OCP and 298 K.
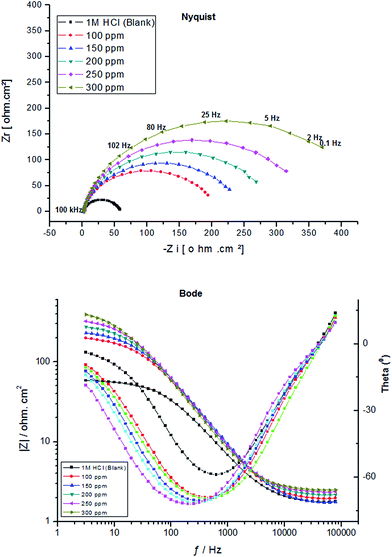 | ||
| Fig. 4 EIS spectra (Nyquist/Bode) for carbon steel electrode after immersion 30 min in 1.0 M HCl containing various concentrations of PY1 at 298 K. | ||
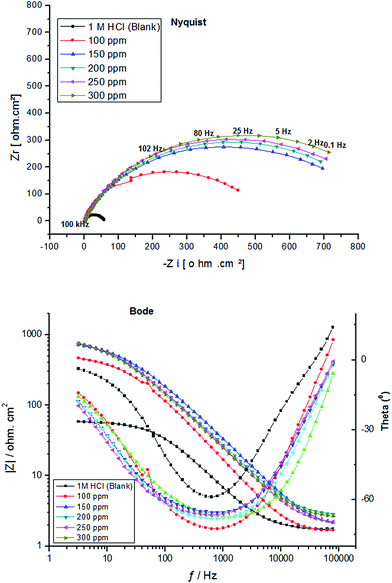 | ||
| Fig. 5 EIS spectra (Nyquist/Bode) for carbon steel electrode after immersion 30 min in 1.0 M HCl containing various concentrations of PY2 at 298 K. | ||
It is evident that in all cases, the Nyquist plots exhibit only one depressed semicircle indicating that the corrosion process of carbon steel in uninhibited and inhibited solutions is under charge transfer control.34 It is worth observing that the presence of each inhibitor increases the diameter of the semicircles indicating that it acts as a corrosion inhibitor.35
The low values of the associated chi-square (χ2) indicate that the circuit was able to fit the experimental data accurately (Fig. 6) (Table 2). The experimental EIS data were satisfactory fitted to the suitable equivalent circuit shown in Fig. 7, using Echem Analyst 5.5 software.
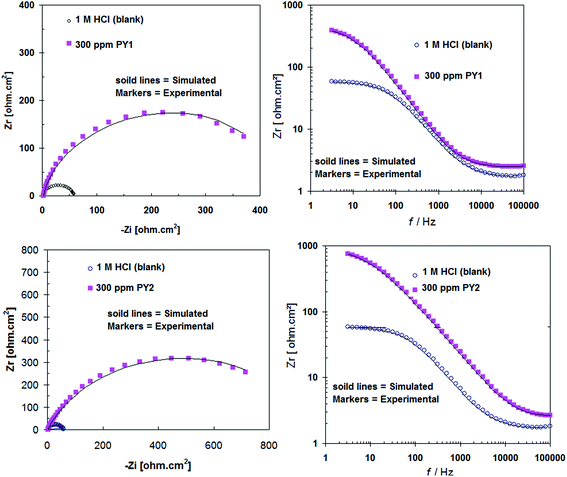 | ||
| Fig. 6 A representative of example simulation of Nyquist and Bode plots recorded for carbon steel in 1.0 M HCl without and with 300 ppm of inhibitors. | ||
| Inhibitor | Cinh ppm | Rs Ω cm2 | Rct Ω cm2 | Q μF cm−2 | n | χ2 | ηR (%) |
|---|---|---|---|---|---|---|---|
| PY1 | 0 | 1.75 ± 0.29 | 55.80 ± 1.7 | 77.06 ± 2.5 | 0.88 | 0.0006 | — |
| 100 | 1.93 ± 0.22 | 192.10 ± 2.4 | 47.99 ± 2.2 | 0.90 | 0.0009 | 70.95 | |
| 150 | 1.72 ± 0.31 | 230.00 ± 3.2 | 48.56 ± 2.4 | 0.89 | 0.0008 | 75.74 | |
| 200 | 2.15 ± 0.25 | 276.20 ± 3.7 | 47.02 ± 3.1 | 0.90 | 0.0007 | 79.80 | |
| 250 | 2.34 ± 0.28 | 329.00 ± 3.8 | 45.13 ± 2.9 | 0.90 | 0.0005 | 83.04 | |
| 300 | 2.48 ± 0.34 | 409.50 ± 2.9 | 51.07 ± 1.9 | 0.90 | 0.0004 | 86.37 | |
| PY2 | 0 | 1.75 ± 0.29 | 55.80 ± 1.7 | 77.06 ± 2.5 | 0.88 | 0.0006 | — |
| 100 | 1.62 ± 0.18 | 452.50 ± 4.2 | 26.22 ± 2.3 | 0.89 | 0.0003 | 87.67 | |
| 150 | 1.89 ± 0.19 | 743.80 ± 4.5 | 24.88 ± 2.8 | 0.82 | 0.0004 | 92.50 | |
| 200 | 2.61 ± 0.25 | 783.50 ± 5.1 | 33.02 ± 1.5 | 0.81 | 0.0008 | 92.88 | |
| 250 | 2.07 ± 0.28 | 792.60 ± 4.7 | 29.29 ± 1.2 | 0.83 | 0.0007 | 92.96 | |
| 300 | 2.49 ± 0.31 | 834.20 ± 3.9 | 34.26 ± 1.5 | 0.82 | 0.0003 | 93.31 |
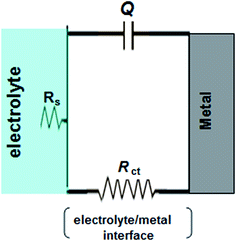 | ||
| Fig. 7 The equivalent circuit used to simulate the impedance data, recorded for carbon steel electrode in 1.0 M HCl in the absence and presence of inhibitors at 298 K. | ||
Some impedance parameters such as solution resistance (Rs), charge transfer resistance (Rct) and constant phase element (CPE) represented as Q, were derived from Nyquist plots and presented in Table 2. It is clear that the values of Rct increase with increasing the inhibitors concentration. The capacitive semicircle is related to the dielectric properties and thickness of the adsorbed film. In all cases the values of 1/Q represent the film thickness and hence its stability. Therefore, the decrease in the values of Q in the presence of PY1 and PY2 could be due to the replacement of water molecules by the inhibitors molecules at the electrode surface.36–38
The value of “n” seems to be associated with the non-uniform distribution of current as a result of roughness and possible oxide surface defects. When n = 1, CPE is an ideal capacitor.39 A true capacitive behavior is rarely obtained. The n values between 0.9 and 1 (Table 2) represent the deviation from the ideal capacitor. It is clear from Table 2 that there is no significant change in the values of n in the absence and presence of inhibitory molecules.
The inhibition efficiency (ηR%) of the tested inhibitors was calculated from the following equation.40
| ηR% = [(Rct − Rct(blank))/Rct] × 100 | (2) |
The calculated ηR% values are given in Table 2. Inspection of the data reveals that the value of ηR% of each inhibitor increases with increasing its concentration. In all cases, PY2 involves higher efficiency than PY1. All these data indicate that the inhibitors efficiencies obtained from EIS measurements agree well with those obtained from potentiodynamic polarization measurements.
3.4. EFM measurements
Fig. 8 shows the intermodulation spectra recorded, using EFM measurements, for carbon steel in 1.0 M HCl in the absence and presence of 100 ppm of PY1 and PY2 at 298 K (as an example). Similar figures were obtained at the other studied inhibitors concentrations. Electrochemical kinetic parameters obtained by EFM technique, and the inhibition efficiency values (ηEFM%) for carbon steel in 1.0 M HCl in the absence and presence of two inhibitors PY1 and PY2 were listed in Table 3.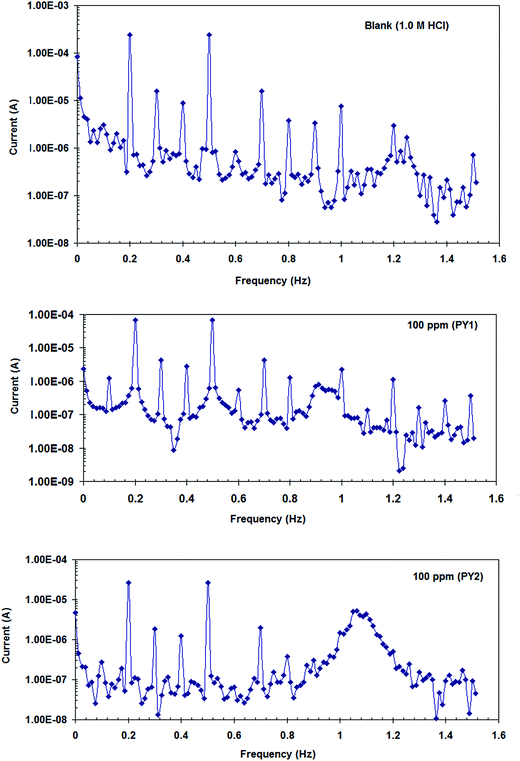 | ||
| Fig. 8 Intermodulation spectra recorded, using EFM measurements with two sine waves of 2 and 5 Hz, for carbon steel in 1.0 M HCl in the absence and presence of 100 ppm of PY1 and PY2 at 298 K. | ||
| Inhibitor | Cinh ppm | Icorr(EFM) μA | βa mV per dec | βc mV per dec | CF2 | CF3 | ηEFM (%) |
|---|---|---|---|---|---|---|---|
| PY1 | 0 | 382.4 ± 3.7 | 86.34 | 132.10 | 1.88 | 3.22 | — |
| 100 | 97.72 ± 3.2 | 80.08 | 116.00 | 1.67 | 3.38 | 74.4 | |
| 150 | 81.84 ± 2.4 | 77.58 | 112.70 | 1.74 | 2.91 | 78.6 | |
| 200 | 65.58 ± 2.2 | 77.92 | 103.50 | 1.88 | 3.11 | 82.9 | |
| 250 | 53.05 ± 2.8 | 75.11 | 102.90 | 1.81 | 3.47 | 86.1 | |
| 300 | 41.40 ± 2.9 | 76.06 | 98.17 | 1.75 | 3.49 | 89.2 | |
| PY2 | 0 | 382.4 ± 3.7 | 86.340 | 132.1 | 1.88 | 3.22 | — |
| 100 | 42.58 ± 1.9 | 85.550 | 137.8 | 1.39 | 3.61 | 88.9 | |
| 150 | 29.95 ± 1.9 | 101.800 | 145.2 | 1.82 | 2.91 | 92.2 | |
| 200 | 25.06 ± 1.2 | 88.150 | 118.4 | 1.75 | 2.91 | 93.4 | |
| 250 | 24.79 ± 1.7 | 93.630 | 125.0 | 1.89 | 2.13 | 93.5 | |
| 300 | 21.84 ± 1.1 | 96.460 | 117.2 | 1.90 | 2.73 | 94.3 |
It realizes from Table 3 that Icorr(EFM) decreased in the presence of PY1 and PY2 indicating that the two inhibitors inhibit acid corrosion of carbon steel through adsorption. The results obtained show that the causality factors (CF2 and CF3) are close to 2 and 3, indicating that the measured data are of good quality.16
Inhibition efficiency (ηEFM%) depicted in Table 3 calculated from the following equation:
| ηEFM% = [(Icorr(EFM)(blank) − Icorr(EFM))/Icorr(EFM)(blank)] × 100 | (3) |
ηEFM% values obtained from the EFM technique are in agreement with those recorded with potentiodynamic polarization and electrochemical impedance spectroscopy (EIS) measurements.
3.5. Adsorption isotherm and thermodynamic parameters
The kind of adsorption of PY1 and PY2 on the carbon steel surface can be detected using appropriate adsorption isotherms. The best correlation between experimental data and isotherm functions was given using Temkin isotherm (eqn (4)).41| exp(−2aθ) = KadsCinh | (4) |
Fig. 9 represents Temkin isotherm for the studied inhibitors at 298 K. Some isotherm parameters such as “a”, Kads and linear regression coefficients (R2) are presented in Table 4.
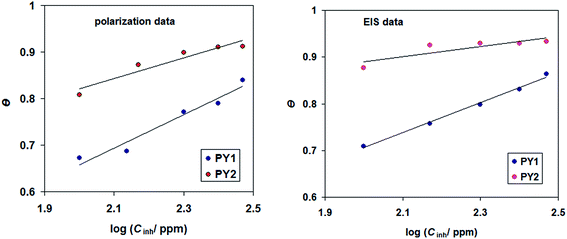 | ||
| Fig. 9 Temkin adsorption isotherms for the studied inhibitors (PY1 and PY2) in 1.0 M HCl at 298 K, obtained from polarization and EIS data. | ||
It is important to note that the linear regression coefficients R2 are approximately to one, indicating that the adsorption of studied ionic liquids obeys Temkin isotherm.42 The values of Kads are relatively low, hinting that the interaction between adsorbing ionic liquids molecules and carbon steel surface is physical adsorption.43 Positive values of “a” indicated that the lateral forces of attraction between adsorbate ionic liquids occurs in the adsorption layer.44
The values of standard free energy of adsorption ( ) are related to Kads by the following equation.45
 | (5) |
The calculated  are listed in Table 4. In the present study, the values of
  were slightly more negative than −20 kJ mol−1, likely indicating that the adsorption mechanism of PY1 and PY2 on carbon steel in 1.0 M HCl solution was mainly physical adsorption.46,47
4. Conclusions
(1) Two new pyrazolone derivatives (PY1 and PY2) were synthesized and tested for their inhibitory properties on carbon steel corrosion in 1.0 M HCl solution.(2) The synthesized pyrazolone derivatives compounds exhibited promising inhibitions at 300 ppm concentration in acidic medium.
(3) Tafel polarization measurements show that all pyrazolone derivatives are mixed-type inhibitors.
(4) They inhibit corrosion through adsorption process and were found to follow Temkin isotherm.
(5) In the presence of pyrazolone derivatives, the double layer capacitance decreased, which confirmed adsorption of the inhibitor molecules on the steel surface.
(6) Excellent agreement between the inhibition efficiencies calculated using the three electrochemical studies is obtained.
Conflicts of interest
There are no conflicts to declare.References
- F. Bentiss, M. Bouanis, B. Mernari, M. Traisnel, H. Vezin and M. Lagrenée, Appl. Surf. Sci., 2007, 253, 3696–3704 CrossRef CAS.
- P. Bommersbach, C. Alemany-Dumont, J. P. Millet and B. Normand, Electrochim. Acta, 2005, 51, 1076–1084 CrossRef CAS.
- M. A. Quraishi and J. Rawat, Mater. Chem. Phys., 2002, 77, 43–47 CrossRef.
- M. A. Deyab, J. Ind. Eng. Chem., 2015, 22, 384–389 CrossRef CAS.
- A. M. Al-Sabagh, H. M. Abd-El-Bary, R. A. El-Ghazawy, M. R. Mishrif and B. M. Hussein, Egypt. J. Pet., 2011, 20, 33–45 CrossRef CAS.
- M. A. Deyab, RSC Adv., 2015, 5, 41365–41371 RSC.
- M. K. Sharma, P. Arora, S. Kumar, S. P. Mathur and R. Ratnani, Corros. Eng., Sci. Technol., 2008, 43, 213–218 CrossRef CAS.
- S. L. Granese, B. M. Rosales, C. Oviedo and J. O. Zerbino, Corros. Sci., 1992, 33, 1439–1453 CrossRef CAS.
- M. Abdallah, A. M. El Defrawy, I. A. Zaafarany, M. Sobhi, A. H. M. Elwahy and M. R. Shaaban, Int. J. Electrochem. Sci., 2014, 9, 2186–2207 Search PubMed.
- M. L. Zheludkevich, K. A. Yasakau, S. K. Poznyak and M. G. S. Ferreira, Corros. Sci., 2005, 47, 3368–3383 CrossRef CAS.
- G. Vastag, E. Szocs, A. Shaban, I. Bertoti, K. Popov-Pergal and E. Kalman, Solid State Ionics, 2001, 141, 87–91 CrossRef.
- K. Tebbji, I. Bouabdellah, A. Aouniti, B. Hammouti, H. Oudda, M. Benkaddour and A. Ramdani, Mater. Lett., 2007, 61, 799–804 CrossRef CAS.
- A. Chetouani, M. Daoudi, B. Hammouti, T. Ben Hadda and M. Benkaddour, Corros. Sci., 2006, 48, 2987–2997 CrossRef CAS.
- E. E. Ebenso, H. Alemu, S. A. Umoren and I. B. Obot, Int. J. Electrochem. Sci., 2008, 3, 1325–1339 CAS.
- H. E. Gaffer, S. Abdel-Fattah, H. A. Etman and E. Abdel-Latif, Synthesis and Antioxidant Activity of Some New Thiazolyl–Pyrazolone Derivatives, J. Heterocycl. Chem., 2017, 54, 331–340 CrossRef CAS.
- M. A. Amin, S. S. Abd El Rehim, M. M. El-Naggar and H. T. M. Abdel-Fatah, J. Mater. Sci., 2009, 44, 6258–6272 CrossRef CAS.
- M. A. Deyab, J. Power Sources, 2015, 292, 66–71 CrossRef CAS.
- M. A. Deyab, J. Power Sources, 2015, 280, 190–194 CrossRef CAS.
- K. R. Ansari, M. A. Quracishi and A. Singh, Corros. Sci., 2019, 95, 62–70 CrossRef.
- M. A. Deyab, R. Essehli and B. El Bali, RSC Adv., 2015, 5, 48868–48874 RSC.
- M. A. Amin, J. Appl. Electrochem., 2006, 36, 215–226 CrossRef CAS.
- M. A. Deyab, J. Taiwan Inst. Chem. Eng., 2016, 58, 536–541 CrossRef CAS.
- M. A. Deyab, B. El Bali, R. Essehli, R. Ouarsal, M. Lachkar and H. Fuess, J. Mol. Liq., 2016, 216, 636–640 CrossRef CAS.
- M. A. Deyab, R. Essehli and B. El Bali, RSC Adv., 2015, 5, 64326–64334 RSC.
- H. Ma, T. Song, H. Sun and X. Li, Thin Solid Films, 2008, 516, 1020–1024 CrossRef CAS.
- H. Ju, Z. P. Kai and Y. Li, Corros. Sci., 2008, 50, 865–871 CrossRef CAS.
- M. A. Deyab, J. Taiwan Inst. Chem. Eng., 2016, 60, 369–375 CrossRef CAS.
- R. Yıldız, Corros. Sci., 2015, 90, 544–553 CrossRef.
- C. Zhang, H. Duan and J. Zhao, Corros. Sci., 2016, 112, 160–169 CrossRef CAS.
- A. Pourghasemi Hanza, R. Naderi, E. Kowsari and M. Sayebani, Corros. Sci., 2016, 107, 96–106 CrossRef CAS.
- M. A. M. Deyab, J. Surfactants Deterg., 2015, 18, 405–411 CrossRef CAS.
- Y. Aouine, M. Sfaira, M. Ebn Touhami, A. Alami, B. Hammouti, M. Elbakri, A. El Hallaoui and R. Touir, Int. J. Electrochem. Sci., 2012, 7, 5400–5419 CAS.
- D. Wahyuningrum, S. Achmad, Y. M. Syah, B. Buchari, B. Bundjali and B. Ariwahjoedi, Int. J. Electrochem. Sci., 2008, 3, 154–166 CAS.
- M. A. Deyab, K. Eddahaoui, R. Essehli, T. Rhadfi, S. Benmokhtar and G. Mele, Desalination, 2016, 383, 38–45 CrossRef CAS.
- S. S. Abd El-Rehim, M. A. M. Deyab, H. H. Hassan and A. A. A. Ibrahim, Z. Phys. Chem., 2016, 230, 1641–1653 CAS.
- M. A. Quraishi and J. Rawat, Mater. Chem. Phys., 2001, 70, 95–102 CrossRef CAS.
- M. Lagrenee, B. Mernari, B. Bouanis, M. Traisnel and F. Bentiss, Corros. Sci., 2002, 44, 573–588 CrossRef CAS.
- M. A. Deyab, J. Power Sources, 2016, 325, 98–103 CrossRef CAS.
- H. Tian, W. Li, K. Cao and B. Hou, Corros. Sci., 2013, 73, 281–291 CrossRef CAS.
- M. A. Deyab, K. Eddahaoui, R. Essehli, S. Benmokhtar, T. Rhadfi, A. De Riccardis and G. Mele, J. Mol. Liq., 2016, 216, 699–703 CrossRef CAS.
- M. A. Deyab, Desalination, 2016, 384, 60–67 CrossRef CAS.
- S. E. Subramani and N. Thinakaran, Process Saf. Environ. Prot., 2017, 106, 1–10 CrossRef.
- N. O. Obi-Egbedi and I. B. Obot, Corros. Sci., 2011, 53, 263–275 CrossRef CAS.
- M. A. Quraishi and F. A. Ansari, J. Appl. Electrochem., 2003, 33, 233–238 CrossRef CAS.
- M. A. Deyab, R. Ouarsal, M. Lachkar, B. El Bali and R. Essehli, J. Mol. Liq., 2016, 219, 994–999 CrossRef CAS.
- S. A. Umoren, I. B. Obot and E. E. Ebenso, Eur. J. Chem., 2008, 5, 355–364 CAS.
- M. A. Deyab, RSC Adv., 2016, 6, 32514–32518 RSC.
| This journal is © The Royal Society of Chemistry 2017 |

