 Open Access Article
Creative Commons Attribution 3.0 Unported Licence
A corn-inspired structure design for an iron oxide fiber/reduced graphene oxide composite as a high-performance anode material for Li-ion batteries†
Jianxin Caia,
Pengfei Zhaoa,
Zhipeng Lia,
Wei Lia,
Jing Zhongc,
Ji Yub and
Zhenyu Yang *b
*b
aSchool of Resources Environmental and Chemical Engineering, Nanchang University, No.999, Xuefu Road, Nanchang, Jiangxi, China. E-mail: zyyang@ncu.edu.cn; Tel: +86-791-83969514
bSchool of Chemistry, Nanchang University, No.999, Xuefu Road, Nanchang, Jiangxi, China
cSchool of Civil Engineering, Harbin Institute of Technology, Heilongjiang 150090, P. R. China
First published on 19th September 2017
Abstract
In this paper, we successfully synthesized iron oxide (Fe2O3) fiber/reduced graphene oxide (rGO) composites with a “corn” structure by an electrospinning technique assisted by annealing treatment and a far infrared reduction process. The special structure consists of Fe2O3 fibers as the “corncob” completely protected by multilayer rGO as the “sepal”. Natural void space between the Fe2O3 fibers and rGO allows for the expansion of Fe2O3 upon lithiation; the good surface area and unblocked channels in the Fe2O3 fiber facilitates fast diffusion of Li+. An electrode with such structure shows excellent capacity (1085.2 mA h g−1 at 0.1 A g−1), and cycle life (407.8 mA h g−1 at 5 A g−1 for 1500 cycles with good coulombic efficiency). This is the longest cycle life for Fe2O3-based anode materials with excellent rate capability (e.g., >400 mA h g−1 at 5 A h g−1). In addition to Fe2O3, this “corn” structure can also be applied to other high capacity anode materials for next generation Li-ion batteries to improve cycle life and coulombic efficiency.
1. Introduction
Recently, lithium-ion batteries (LIBs) have attracted much attention due to the rapid development of portable electronic devices, electric vehicles (EVs), and hybrid electric vehicles (HEVs).1–3 At present, most commonly used anode materials for commercial LIBs are based on graphite. However, graphite suffers from an inherently low theoretical charge storage capacity (372 mA h g−1) and often operates at significantly low rates (typically, <1C) that in turn limits the achievable power densities.4,5 Therefore, the design and synthesis of new anode materials is necessary to offer the promise of high performance lithium-ion batteries with high efficiency, great energy density and long-lasting duration to meet various energy storage demands. For the purpose, nanostructure transition metal oxides have received great interest in lithium-ion batteries, and scientists have made great efforts to explore alternative anode materials with high capacity from them, such as SnO2, FeOx, CoOx, MnOx, CoFe2O4, and Co3V2O8.6–13 Among these anode materials investigated for LIBs, Fe2O3 have been widely studied as anode materials due to their high theoretical capacity value (1070 mA h g−1), low cost, natural abundance, nontoxicity and the highest electrical conductivity (∼2 × 10⁻⁴ S m−1) than other metal oxides.14–16However, it remains great challenges in the application of Fe2O3 to commercial LIBs, especially the obstacles of poor cycling stability and inferior rate capability. The large volume expansion and severe collapse occurs in the host matrix of Fe2O3 during the cycling processes give rise to pulverization, which results in the breakdown of electrical connection of these anode materials from current collectors and rapid capacity fading upon cycling. To overcome these drawbacks, several strategies have been employed such as Fe2O3 nanotubes, nanorods/rGO, nanoropes/rGO, hollow nanobarrels, hollow nanoparticles/rGO, hollow spheres, and hollow-structured tubular nanostructures.17–28 Chaudhari et al.26 reported a hollow-structured α-Fe2O3 nanofibers electrode with a reversible capacity of 1293 mA h g−1 at a current density of 60 mA g−1. Fe2O3 hollow nanoparticles/N-doped graphene aerogels were prepared by Liu et al.,27 and the grapheme/Fe2O3 aerogels exhibit high rate capability and excellent cyclic stability (729 mA h g−1 at 0.1 A g−1 for 300 cycles). Zhu et al.28 reported the graphene oxide/Fe2O3 composite exhibiting 1027 mA h g−1 at a current density of 100 mA h g−1 after 50 cycles. These results suggested that incorporating nanoscale iron oxide into rGO has a great beneficial impact on the electrochemical performance of Li-ion batteries.
More recently, some core–shell nanostructure materials, which was originally used in semiconductors, have been imported to the field of Li-ion batteries. Some efforts was made to investigate Li-ion battery materials with core–shell nanostructure,29–33 such as Si, alloys, and transition metal oxides with carbon shells, and graphene was also introduced as a shell material. For example, Yang et al. have been fabricated graphene-wrapped metal oxides particles by electrostatic self-assembling. This unique core–shell structure have suppressed the aggregation of oxide nanoparticles, accommodated the volume change during the discharge–charge processes, and keep the high electrical conductivity of the electrode. The obtained graphene-wrapped Co3O4 hybrids delivered very high reversible capacity of about 1100 mA h g−1 in the initial 10 cycles and 1000 mA h g−1 after 130 cycles at 74 mA g−1. However, further exploration and rational fabrication of iron oxide composite electrode materials with high-rate performance and long cycle life will have a significant impact on its practical utilization in Li-ion batteries.
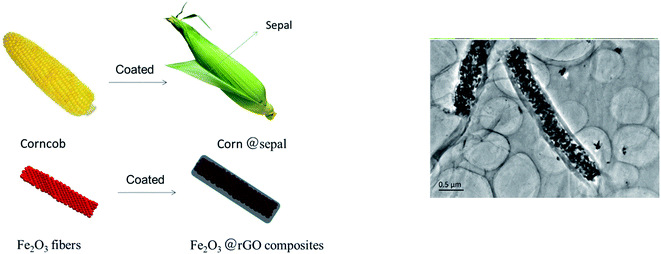
Herein, we fabricated a novel core–shell structure Fe2O3 fiber/rGO anode materials by electrostatic self-assembling and the negatively charged graphene layers was wrapped on the positively charged Fe2O3 nanofiber. As shown in Fig. 1, the core–shell structure of Fe2O3 fiber/rGO composite is very similar with that of corn; Fe2O3 nanofiber can be regarded as the “corncob”, and the wrapping multilayer reduced graphene oxide as the “sepal”. This unique composites with corn-like structure has several advantages for LIB anodes. First, the rGO layers are a stable framework, and the void space between the Fe2O3 fiber and the rGO layers allows for the Fe2O3 to expand upon lithiation. Second, the rGO layers prevent the electrolyte from reaching the Fe2O3 surface inside the rGO layers completely, and lithiation of the Fe2O3 occurs by Li diffusion through the rGO into the Fe2O3 fiber. Third, the rGO layers are both electronically and ionically conducting, which allows for good kinetics in Fe2O3 fiber/rGO anode. Due to the cohesiveness and good conductivity of rGO, Fe2O3/rGO anode is applied for LIBs without binder and conductive agent as dopant. As a result, the synergistic effect between rGO and Fe2O3 fiber could reduce the initial capacity loss as well as improve the high rate capability (1085.2 mA h g−1 at 0.1 A g−1) and cyclability (407.8 mA h g−1 at 5 A g−1 for 1500 cycles). This is the longest cycle life for the Fe2O3-based anode materials with excellent rate capability (e.g., >400 mA h g−1 at 5 A h g−1).
2. Experimental section
2.1 Preparation of Fe2O3 fibers
Fe2O3 fibers were synthesized by electrospinning technique assisted with anneal treatment. In a typical experiment, 2.4 g poly(vinyl pyrrolidone) (PVP, Mw = 1![[thin space (1/6-em)]](https://www.rsc.org/images/entities/char_2009.gif) 300
300![[thin space (1/6-em)]](https://www.rsc.org/images/entities/char_2009.gif) 000, Sigma) was dissolved in 15 ml N,N-dimethylformamide (DMF, AR, Sigma) and 15 ml ethanol solution, magnetic stirring for 3 h. Then, 2.4, 4.8, or 7.2 g ferric chloride (AR, Aladdin, China) was added the solution and then vigorous stirring for 2 h, and FeCl3 concentrations to the whole solution are 6, 12 and 18 wt%, respectively. The as-prepared samples were designated as PVP/FeCl3 (I), PVP/FeCl3 (II) and PVP/FeCl3 (III), respectively. Next, the precursor solution was loaded into a plastic syringe that was equipped with a stainless steel needle of 0.8 mm in diameter and electrospun at a DC voltage of 15 kV and a flow rate of 0.6 ml h−1. The electrospun fibers were collected on aluminum foil and the distance between the needle and collector was 15 cm. The as-electrospun PVP/FeCl3 composite fibers were placed in a vacuum oven for 12 h at room temperature in order to remove the solvent residuals, and calcined for 3 h in air at 600 °C (the heating rate, 1 °C min−1) in a tube furnace, respectively. Finally the Fe2O3 fibers obtained were designated as Fe2O3 (I), Fe2O3 (II) and Fe2O3 (III), respectively.
000, Sigma) was dissolved in 15 ml N,N-dimethylformamide (DMF, AR, Sigma) and 15 ml ethanol solution, magnetic stirring for 3 h. Then, 2.4, 4.8, or 7.2 g ferric chloride (AR, Aladdin, China) was added the solution and then vigorous stirring for 2 h, and FeCl3 concentrations to the whole solution are 6, 12 and 18 wt%, respectively. The as-prepared samples were designated as PVP/FeCl3 (I), PVP/FeCl3 (II) and PVP/FeCl3 (III), respectively. Next, the precursor solution was loaded into a plastic syringe that was equipped with a stainless steel needle of 0.8 mm in diameter and electrospun at a DC voltage of 15 kV and a flow rate of 0.6 ml h−1. The electrospun fibers were collected on aluminum foil and the distance between the needle and collector was 15 cm. The as-electrospun PVP/FeCl3 composite fibers were placed in a vacuum oven for 12 h at room temperature in order to remove the solvent residuals, and calcined for 3 h in air at 600 °C (the heating rate, 1 °C min−1) in a tube furnace, respectively. Finally the Fe2O3 fibers obtained were designated as Fe2O3 (I), Fe2O3 (II) and Fe2O3 (III), respectively.
2.2 Preparation of Fe2O3/rGO composites
Graphene oxide was synthesized from natural graphite by a modified Hummers method described in detail previously.34 To prepare Fe2O3/rGO composites, a homogeneous suspension of graphene oxide (GO) and Fe2O3 fibers was carefully prepared. A total of 20 ml of alcoholic GO (1 mg ml−1) was sonicated for 30 min to form a stable solution. Subsequently, 0.01 g Fe2O3 fibers was mixed with alcoholic GO and sonicated for another 30 min to form a homogeneous dispersion. Standing for 24 h, the Fe2O3/GO composites was collected by centrifugalization. The collecting solid was dried for 24 h by vacuum at 60 °C. Finally, the Fe2O3/GO composites was put in home-use convection oven and irradiated by far infrared light for 5 min, in which the mixture color changed from bright red to dark red. Then Fe2O3 (I)/rGO, Fe2O3 (II)/rGO and Fe2O3 (III)/rGO Fe2O3/rGO composites were obtained.2.3 Characterization
The morphology and diameter of samples were characterized using scanning electron microscope (SEM, FEI Quanta200F) and transmission electron microscope (TEM, FEI Tecnai G2 F20, 200 kV). The crystalline structural characterization of the all samples was carried out by X-ray diffraction (XRD) using a diffractometer (Bruker D8 Focus X-ray diffractometer), and the diffraction patterns were recorded at room temperature in the 2θ range between 5° and 80°. The chemical structure of fibers was conducted with a Fourier transform infrared (FT-IR) reflection spectroscopy (NICOLET 380, Wisconsin, USA). Weight loss behavior was tested by thermogravimetric (TG) analysis (TGA/DSC 3+, Mettler Toledo, Zurich, Switzerland) (air, 10 °C min−1).2.4 Electrochemical performance evaluation
The electrochemical performance of the Fe2O3 fibers and Fe2O3/rGO composites were analyzed by constructing a 2025-type coin cell. The active material and a certain amount of EtOH were mixed to prepare slurry, and the resulting slurry was attached onto copper foils. The anodes were dried in a vacuum furnace at 65 °C for 24 h. The mass loading of active materials per electrode is about 0.4 mg cm−2, in which the mass of Fe2O3/rGO composites for the working electrodes was obtained by a Sartorius scale (0.01 mg) and the area of copper sheets were about 2 cm2. The cells were assembled in a high purity argon atmosphere inside a glove box (Mbraun lab Master130, Germany). Lithium ribbon (0.3 mm thick) was used as the counter electrode and Celgard® 2325 was used as the separator and the electrolyte was a solution of 1 M LiPF6 dissolved in a mixture of ethylene carbonate (EC)![[thin space (1/6-em)]](https://www.rsc.org/images/entities/char_2009.gif) :
:![[thin space (1/6-em)]](https://www.rsc.org/images/entities/char_2009.gif) dimethyl carbonate (DMC) (1
dimethyl carbonate (DMC) (1![[thin space (1/6-em)]](https://www.rsc.org/images/entities/char_2009.gif) :
:![[thin space (1/6-em)]](https://www.rsc.org/images/entities/char_2009.gif) 1 vol%). Cyclic voltammetry (CV) measurements and electrochemical impedance spectroscopy (EIS) were performed using electrochemical workstation (PARSTAT 2273, Prinston, USA) at 0.1 mV s−1 scan rate between 0.0 and 3.0 V. Charge and discharge were conducted using an a multi-channel battery test system (NEWARE, Shenzhen, China) at several different current densities between cutoff potentials of 0.02 and 3.00 V. The capacities were calculated on the basis of the weight of Fe2O3 fibers or Fe2O3/rGO composites.
1 vol%). Cyclic voltammetry (CV) measurements and electrochemical impedance spectroscopy (EIS) were performed using electrochemical workstation (PARSTAT 2273, Prinston, USA) at 0.1 mV s−1 scan rate between 0.0 and 3.0 V. Charge and discharge were conducted using an a multi-channel battery test system (NEWARE, Shenzhen, China) at several different current densities between cutoff potentials of 0.02 and 3.00 V. The capacities were calculated on the basis of the weight of Fe2O3 fibers or Fe2O3/rGO composites.
3. Results and discussion
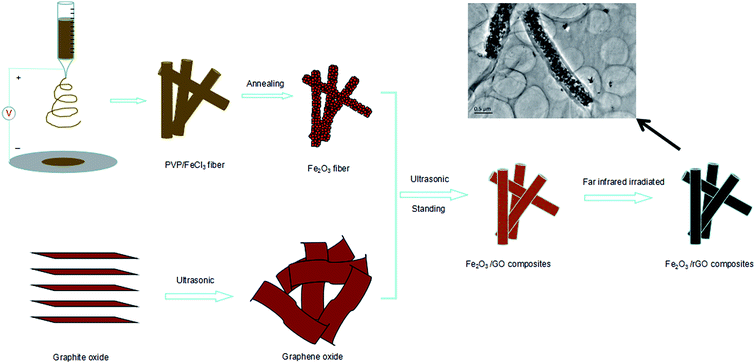
The fabrication process of the flexible Fe2O3 fiber/rGO composite is illustrated in Fig. 2 and S1 (ESI†). Typically, a homogeneous viscous solutions with FeCl3 dissolved in poly(vinyl pyrrolidone) was electrospun into fibers, following with annealing process at 600 °C in air. Then, the Fe2O3 fibers were sonicated with alcoholic GO solution and formed a homogeneous dispersion; during the process, the negatively charged graphene oxide was uniformly wrapped on positively charged Fe2O3 nanofiber. In the next step, the Fe2O3/GO composites were collected by centrifugalization. Finally, the Fe2O3/GO composites was reduced to Fe2O3/rGO by the thermal decomposition of graphene oxide (GO) in air at a relatively low temperature of ∼200 °C in under 5 minutes through far infrared (FIR) irradiation via a home-used convection oven.To understand the influence of FeCl3 concentration on the PVP/FeCl3 fibers, three different weights PVP to FeCl3 in DMF solution (FeCl3 contents of 6, 12 and 18 wt%, respectively) were applied by electrospinning processes. The as-prepared fibers were designated as PVP/FeCl3 (I), PVP/FeCl3 (II) and PVP/FeCl3 (III), respectively. Fig. 3 shows the SEM images of PVP/FeCl3 fibers with different FeCl3 contents. All electronspinning PVP/FeCl3 fibers are straight and exhibit an interconnected pore structure and homogeneously distributed diameters. The fiber diameter increases from ∼400 nm to ∼1500 nm with the increasing of the contents of FeCl3 increased from 6 to 18 wt%. However, PVP/FeCl3 (III) shows junction between single fiber and the larger size. This phenomenon can be explained that the fibers have a lower viscosity at higher concentration of FeCl3 which results in the junctions morphology.35
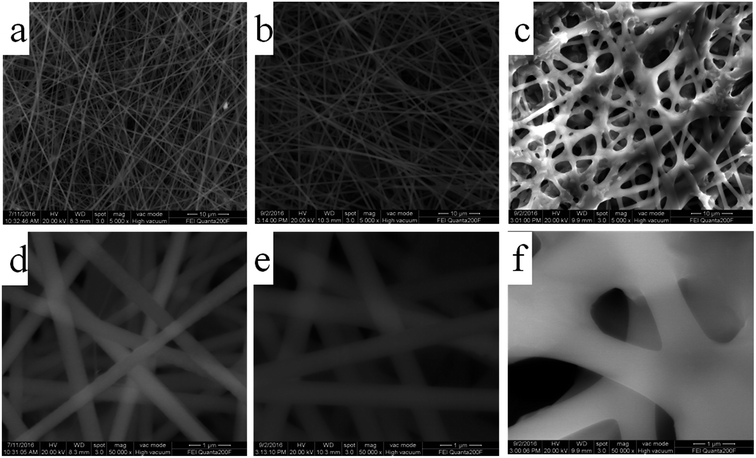 | ||
| Fig. 3 SEM images of (a and d) PVP/FeCl3 (I), (b and e) PVP/FeCl3 (II) and (c and f) PVP/FeCl3 (III). | ||
To obtain the α-Fe2O3 fibers with good crystallinity, the FTIR spectra and X-ray diffraction spectra have been analyzed by calcining under different temperatures. Fig. 4a shows the FTIR spectra of the PVP/FeCl3 fibers and calcined in air at 200–800 °C for 3 h. There are two peaks appearing at 463 and 551 cm−1 which are assigned to the Fe–O vibration of the Fe2O3 fibers from 400 to 800 °C. Due to the decomposition of PVP, the peaks at about 1621 cm−1 and 3369 cm−1, corresponding to –N–C(![[double bond, length as m-dash]](https://www.rsc.org/images/entities/char_e001.gif) O)–, –O–H, respectively, disappear upon calcination at 600 °C, which indicates the formation of pure Fe2O3. Fig. 4b shows the X-ray diffraction patterns of the PVP/FeCl3 fibers calcined in air at 200–800 °C for 3 h. The observed diffraction peaks at 2θ (°) = 24.14, 33.16, 35.62, 40.86, 49.46, 54.07, 57.61, 62.43, 63.99, 71.96 and 75.45 correspond to the planes of (012), (104), (110), (113), (024), (116), (018), (214), (300), (1010) and (220), respectively, which all match with the rhombohedral phase of α-Fe2O3 (JCPDS 33-0664).26,27 The sharp diffraction peaks clearly indicate the good crystallinity of the α-Fe2O3 phase. The diffraction peaks of the Fe2O3 fibers were observed above 400 °C in sintering processes, and enhanced upon calcinations at 600 °C, which was in accordance with the FTIR results.
O)–, –O–H, respectively, disappear upon calcination at 600 °C, which indicates the formation of pure Fe2O3. Fig. 4b shows the X-ray diffraction patterns of the PVP/FeCl3 fibers calcined in air at 200–800 °C for 3 h. The observed diffraction peaks at 2θ (°) = 24.14, 33.16, 35.62, 40.86, 49.46, 54.07, 57.61, 62.43, 63.99, 71.96 and 75.45 correspond to the planes of (012), (104), (110), (113), (024), (116), (018), (214), (300), (1010) and (220), respectively, which all match with the rhombohedral phase of α-Fe2O3 (JCPDS 33-0664).26,27 The sharp diffraction peaks clearly indicate the good crystallinity of the α-Fe2O3 phase. The diffraction peaks of the Fe2O3 fibers were observed above 400 °C in sintering processes, and enhanced upon calcinations at 600 °C, which was in accordance with the FTIR results.
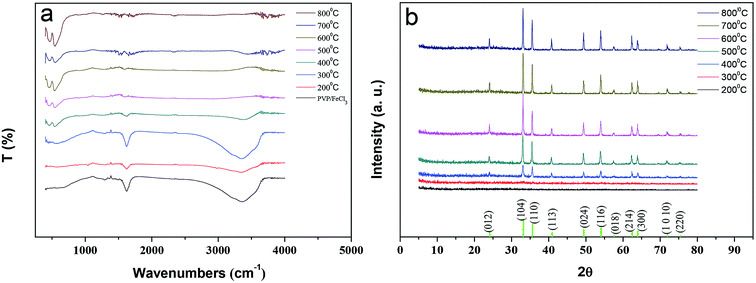 | ||
| Fig. 4 (a) FTIR spectra of PVP/FeCl3 (II) fibers and calcined in air at 200–800 °C; (b) X-ray diffraction patterns of the PVP/FeCl3 (II) fibers calcined in air at 200–800 °C for 3 h. | ||
Fig. 5 show the SEM and TEM images of Fe2O3 (I), Fe2O3 (II) and Fe2O3 (III) after heat treatment at 600 °C. As can be seen from the figures, the average diameter of these fibers greatly shrank because of the weight loss resulting from the removal of PVP after heat treatment. The average diameters of Fe2O3 (I), Fe2O3 (II) and Fe2O3 (III) fibers were found to be approximately 200, 400, 800 nm, respectively. It is obvious in Fig. 5 that corncob-like fibers were formed through the above approach and their surface became rough and porous due to some decomposition of the organic components.
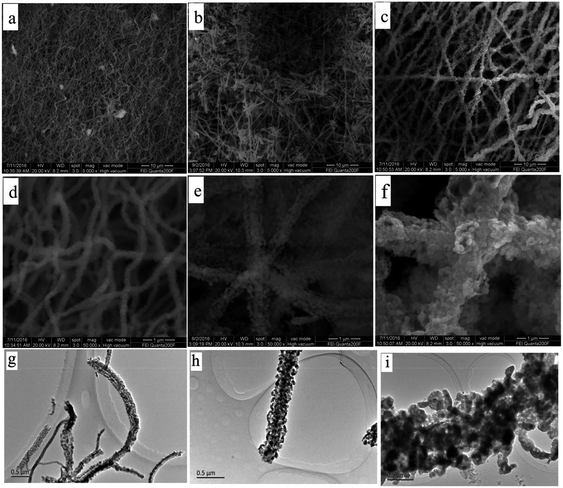 | ||
| Fig. 5 SEM and TEM images of (a, d and g) Fe2O3 (I), (b, e and h) Fe2O3 (II) and (c, f and i) Fe2O3 (III). | ||
Based on these Fe2O3 fibers obtained, the Fe2O3/rGO composites have been prepared after a far infrared (FIR) irradiation process. To prove the reduction effect of GO in the composite, the Raman spectrum of the Fe2O3/rGO samples before and after reduction was shown in Fig. S2.† It is found that two broad peaks locate at 1345 and 1589 cm−1, which correspond to the A1g vibration mode of the disordered carbon (D-bond) and the E2g vibration mode of the ordered graphitic carbon (G-bond), respectively. The intensity ratio value of ID/IG for the samples increase from 0.92 to 0.97, which shows the graphene oxide has been reduced to rGO by far infrared irradiation reduction process. The higher ID/IG value indicates more defects and edges in the reduced graphene structure which may results in more porous structure. Interestingly, the D peaks of in the nanocomposites show the slightly red-shift, revealing the stronger interactions between Fe2O3 nanofiber and graphene after reduction process. This phenomenon usually derives from the dielectric confinement effect of transition metal oxide on graphene.36,37 Further, X-ray photoelectron spectroscopy (XPS) measurements also provide direct evidence of the reduction of GO under FIR irradiation and chemical state of Fe2O3 in composites, as shown in Fig. S3.† The survey scan spectrum displays the peaks of iron, oxygen and carbon, showing a high purity of as-prepared Fe2O3/rGO composites. The C 1s XPS spectra of Fe2O3/rGO composites indicates that, for Fe2O3/GO samples, four different peaks centered at 285.0, 286.8, and 288.1 eV were observed, corresponding to the presence of C–C/C![[double bond, length as m-dash]](https://www.rsc.org/images/entities/char_e001.gif) C in aromatic rings, C–O (epoxy and alkoxy), C
C in aromatic rings, C–O (epoxy and alkoxy), C![[double bond, length as m-dash]](https://www.rsc.org/images/entities/char_e001.gif) O groups, respectively. After FIR irradiation reduction treatment, the intensities of all the C 1s peaks of the carbons binding to oxygen, decrease obviously. It suggests that the GO have been reduced to rGO in a certain degree. And for the XPS spectra of the Fe 2p for Fe2O3/GO composites, binding energies of Fe 2p3/2 and Fe 2p1/2 are 711.4 eV and 724.9 eV respectively for Fe2O3/GO composites before and after reduction, in good agreement with crystalline Fe2O3. The satellite peak locating at 719.9 eV between the Fe 2p3/2 and 2p1/2 peaks was assigned to its purely trivalent nature, implying that the oxidation state of Fe element in the composites were of Fe3+ only.38 Furthermore, the weight content of reduced graphene oxide can be obtained by comparing with the thermal weight loss behaviors between pure Fe2O3 fibers and Fe2O3/rGO composites, as shown in Fig. S4.† For the sample of Fe2O3 fibers, it can be seen that the weight losses could be attributed to the evaporation of moisture and crystal water below 200 °C in the curves. With the temperature increasing, there is no weight loss for the sample of pure Fe2O3 fibers, which shows that Fe2O3 crystalline phase has good thermal stability. Instead, there are significant weight loss above 200 °C in the curve for the samples of Fe2O3 fibers/rGO composites: the weight loss between 200 to 300 °C corresponds to the further reduction process of reduced graphene oxide; the weight loss between 300 °C and 500 °C could be attributed to the complete combustion of graphene; and no further weight loss above 500 °C indicated the pure Fe2O3. Therefore, the weight percentage of Fe2O3 in the composite samples can be estimated by about 50%.
O groups, respectively. After FIR irradiation reduction treatment, the intensities of all the C 1s peaks of the carbons binding to oxygen, decrease obviously. It suggests that the GO have been reduced to rGO in a certain degree. And for the XPS spectra of the Fe 2p for Fe2O3/GO composites, binding energies of Fe 2p3/2 and Fe 2p1/2 are 711.4 eV and 724.9 eV respectively for Fe2O3/GO composites before and after reduction, in good agreement with crystalline Fe2O3. The satellite peak locating at 719.9 eV between the Fe 2p3/2 and 2p1/2 peaks was assigned to its purely trivalent nature, implying that the oxidation state of Fe element in the composites were of Fe3+ only.38 Furthermore, the weight content of reduced graphene oxide can be obtained by comparing with the thermal weight loss behaviors between pure Fe2O3 fibers and Fe2O3/rGO composites, as shown in Fig. S4.† For the sample of Fe2O3 fibers, it can be seen that the weight losses could be attributed to the evaporation of moisture and crystal water below 200 °C in the curves. With the temperature increasing, there is no weight loss for the sample of pure Fe2O3 fibers, which shows that Fe2O3 crystalline phase has good thermal stability. Instead, there are significant weight loss above 200 °C in the curve for the samples of Fe2O3 fibers/rGO composites: the weight loss between 200 to 300 °C corresponds to the further reduction process of reduced graphene oxide; the weight loss between 300 °C and 500 °C could be attributed to the complete combustion of graphene; and no further weight loss above 500 °C indicated the pure Fe2O3. Therefore, the weight percentage of Fe2O3 in the composite samples can be estimated by about 50%.
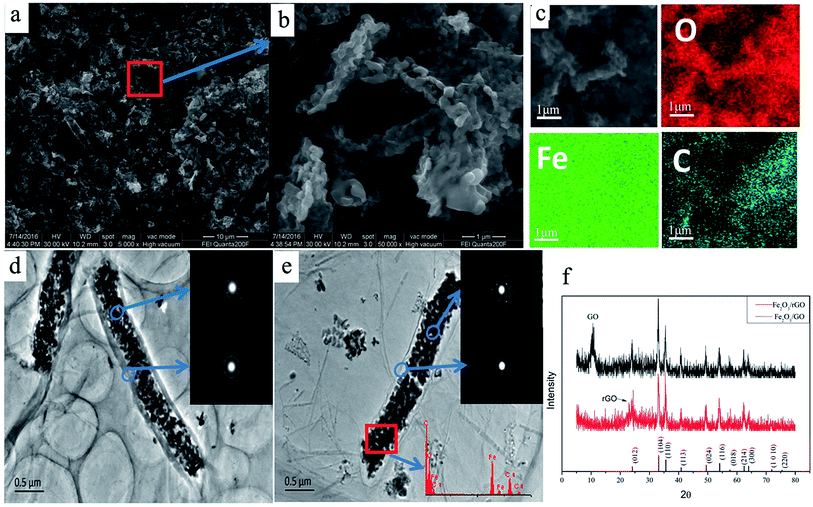
To further investigate the morphological structure of the as-prepared Fe2O3/rGO composites, the SEM and TEM images were shown in Fig. 6. A typical morphology of Fe2O3/rGO hybrid fibers and porous structure have been clearly observed in Fig. 6a and b. The elemental mapping (Fig. 6c) showed that the Fe2O3/rGO composites were uniformly distributed with carbon, oxygen, and iron. Fig. 6d demonstrates Fe2O3 fiber was uniformly coated by graphene oxide, which looks like a corn, even via a reduction of far infrared light irradiation (Fig. 6e). It is obvious that the surface of Fe2O3/rGO composites has a smooth film, which indicates Fe2O3 was coated in the rGO sheets. This phenomenon can be explained as follows: the oxygen-containing functional groups (hydroxyl, carbonyl and carboxyl groups) on the GO make it negatively-charged and they can act as anchor sites that interact strongly with the covered species;39 when treating the mix solution of negatively charged GO and positively charged Fe2O3 fibers with ultrasound, the positively-charged Fe2O3 fiber may be absorbed on the negatively-charged surface of GO, which may promote the coating of Fe2O3 fibers by GO. A regular diffraction spot ring is observed from the selected-area electron diffraction (SAED) pattern (Fig. 6d and e, inset). The SAED pattern of rGO (Fig. 6d) shows the ring pattern obviously, and Fig. 6e shows the typical hexagonally ordered lattice of carbon in graphene, which indicated the Fe2O3/GO was transformed into Fe2O3/rGO completely. In addition, the reduction effect is also confirmed by XRD patterns (Fig. 6f). As shown in Fig. 6f, the sharp X-ray diffraction peak of GO (at 2θ ≈ 10°) appears in Fe2O3/GO composites before far infrared irradiation, and after far infrared irradiation, the composites obtained appear the new diffraction peak of rGO (at 2θ ≈ 24°) and disappear the peak of GO (at 2θ ≈ 10°), indicating the Fe2O3/GO was transformed into Fe2O3/rGO completely. In the meantime, crystallined α-Fe2O3 and graphene layers are also confirmed by XRD patterns (Fig. 6f) and HRTEM (Fig. S5†). As estimated by the HRTEM images, the lattices with a lattice fringe spacing of 0.22 nm are indexed to the (113) plane of α-Fe2O3, and the thickness of rGO layer is about 3 nm.
Subsequently, the porous characteristics of the Fe2O3 fiber/rGO composite were investigated by the nitrogen isothermal adsorption–desorption measurement. As displayed in Fig. S6,† the pore size distribution of the Fe2O3 fiber/rGO composite is almost consistent with pure Fe2O3 nanofiber, which give the evidence that the inside channels in Fe2O3 fiber remained unblocked after graphene sheets wrapping. The BET specific surface area of Fe2O3 fiber/rGO composites was estimated as 150.9 m2 g−1 from the result of nitrogen adsorption data, and a more than 43% increase in specific surface area is found by comparing with pure Fe2O3 nanofiber. The major increase of the specific surface area can be attributed to the wrapped graphene nanosheets with relatively high specific surface area. It indicates that the graphene sheets working as a robust support can effectively suppress the self-aggregation of Fe2O3 nanofiber and thus further maintain the surface area of the Fe2O3 fiber/rGO material. At the same time, the synergistic effect of the unblocked channels and good surface area in the Fe2O3 fiber/rGO composite will facilitate fast diffusion of Li+ when large area of active sites was provided for the lithiation and delithiation reactions.
Therefore, the as-prepared “corn” structure materials of Fe2O3 fiber/rGO composites with Fe2O3 fiber as the “corncob” and multilayer reduced graphene oxide as the “sepal” will be expected to relieve the pulverization originated from the large volume change during the charge/discharge cycles, and further improve the electronic conductivity of Fe2O3 composites electrode, which contribute to high rate capability, and superior cyclability as Li-ion anode.
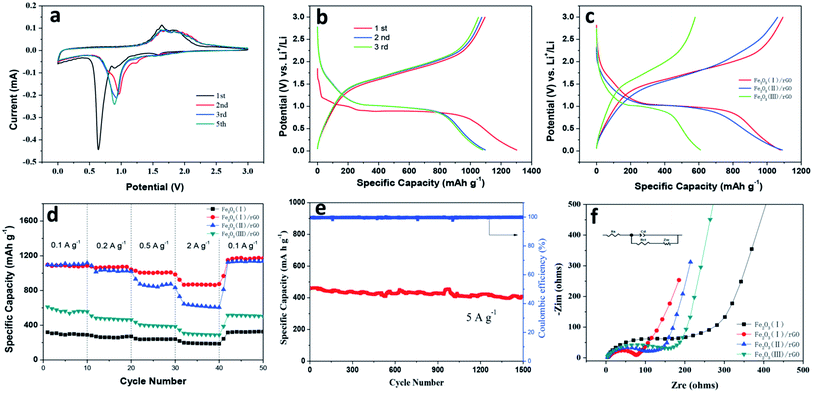
To investigate the possibility of the Fe2O3/rGO composites used as advanced anode materials, the coin-type Li half-cells has been assembled and their electrochemical performance were studied. The initial cyclic voltammetry (CV) curves at a scan rate of 0.1 mV s−1 for the first five cycles were shown in Fig. 7a. In the first scan, irreversible reduction peaks were observed at 1.57, 0.90 and 0.60–0.75 V for the Fe2O3/rGO, respectively. The irreversible peak of 1.57 V is attributed to the lithium intercalation into Fe2O3 fiber: Fe2O3 + xLi+ + xe− → LixFe2O3, disappearing at subsequent cycles. The cathodic peak of 0.90 V was ascribed to the phenomenon that hexagonal LixFe2O3 is transformed to cubic Li2Fe2O3: LixFe2O3 + (2 − x)Li+ + (2 − x)e− → Li2Fe2O3. The strongest peak of (0.60–0.75 V) corresponds to the stepwise reduction of Fe3+ to Fe2+ and Fe0 and the formation of the SEI layer:40 Li2Fe2O3 + 4Li+ + 4e− ↔ 2Fe0 + 3Li2O. The disappearance of the strongest peak in the subsequent cycle was due to the irreversible reactions induced by the formation of an SEI layer on the electrode in the first cycle. At the same time, the peaks at 1.57 V and 0.90 V disappeared indicating that lithium insertion and phase transformation from LixFe2O3 to Li2Fe2O3 are irreversible.41 On the other hand, the two anodic peaks at 1.64 and 1.86 V in the first scan corresponded to the oxidation process of Fe0 to Fe2+ and Fe3+.42 The broad peak appear in the subsequent cycles and their intensities remains almost the same, as observed from anodic curves, indicating enhanced stability during lithiation and delithiation processes.
Fig. 7b shows the charge–discharge curves of the Fe2O3 (I)/rGO composites anode at various cycles, which were tested at a current rate of 100 mA g−1 within a voltage range of 0.02–3.0 V. It is found that the Fe2O3 (I)/rGO composite electrode exhibits discharge and charge plateaus at ∼0.9–0.8 V and ∼1.5–1.9 V that are typical for Fe2O3 based materials, which is in agreement with the charge–discharge process as shown in Fig. 7a. It is also observed that the initial charge and discharge capacities are around 1095.3 and 1303.7 mA h g−1, and the initial coulombic efficiencies are 84%. In the second and third cycles, although the discharge capacities decrease gradually to about 1098.8 and 1081.6 mA h g−1, the coulombic efficiencies are all above 97%. Furthermore, the typical second discharge–charge curves of the Fe2O3 (I)/rGO, Fe2O3 (II)/rGO and Fe2O3 (III)/rGO composites at a current rate of 100 mA g−1 within a voltage range of 0.02–3.0 V are shown in Fig. 7c. The discharge capacity of the Fe2O3 (I)/rGO, Fe2O3 (II)/rGO and Fe2O3 (III)/rGO composite was 1093.6, 1062.3 and 578.7 mA h g−1, respectively. From the comparison, the Fe2O3 (I)/rGO with a smallest diameter show obvious improved specific capacity and higher Fe2O3 utilization.
To compare the nobility of Fe2O3/rGO composites of electrochemical characteristics, the rate capabilities of Fe2O3/rGO composites of Fe2O3 (I)/rGO, Fe2O3 (II)/rGO and Fe2O3 (III)/rGO and Fe2O3 fibers as anodes were examined at the various current densities of 0.1, 0.2, 0.5, 2 and 0.1 A g−1 (Fig. 7d). The Fe2O3 (III)/rGO electrode exhibited the lowest rate capability for three samples, significantly decreasing from 610.5 mA h g−1 at 0.1 A g−1 to 287.9 A h g−1 at 2 A g−1. By contrast, the Fe2O3 (I)/rGO electrode exhibited a more stable cyclic performance than others at high current rates and delivered capacities of 1085.2, 1065.1, 974.5, 866.1, and 1170.9 mA h g−1 at 0.1, 0.2, 0.5, 2 and 0.1 A g−1, respectively.
Then, the cyclic stability of the Fe2O3 (I)/rGO was investigated as shown in Fig. 7e. It were cycled under an high current density of 5 A g−1, and the Fe2O3/rGO composites show high stability with a specific capacity of 407.8 mA h g−1 after 1500 cycles compared to the Fe2O3 at the same test conditions and the excellent columbic efficiency of higher than 99%. Most notably, the cyclability and rate performance of Fe2O3/rGO are better than most of the lately reported Fe2O3-based anode materials, such as porous Fe2O3 nanotubes,11 nanoropes,13 hollow nanobarrels/rGO14 and hollow nanoparticles/rGO.15
In order to understand the fast ion transport in the composite electrodes, electrochemical impedance spectroscopy (EIS) measurements were conducted on the fresh cell with Fe2O3 (I) fiber, Fe2O3 (I)/rGO, Fe2O3 (II)/rGO and Fe2O3 (III)/rGO composite electrodes (Fig. 7f). The Nyquist plot shows a depressed semicircle, which generally describes two components: charge transfer resistance43 and interfacial resistance.44 The straight line in the low frequency region is the Warburg constant, which is assigned to the diffusion and transport of the Li+ ion from the electrolyte to the surface of the electrode. The electrochemical system can be simply modeled by a Randles equivalent circuit, where Rs is the ohmic resistance, Cd is the double-layer capacitance, Rct is the charge transfer resistance, and Zw is the Warburg impedance describing the solid-state diffusion of Li+ in Fe2O3.45 The resistance of the depressed semicircle of Fe2O3 (I)/rGO is lower than that of Fe2O3 (II)/rGO and Fe2O3 (III)/rGO, which is 78, 118 and 163 Ω, respectively. It suggests that the Fe2O3 (I)/rGO composite have a much lower electrolyte resistance and charge transfer resistance than other samples. These results confirm that such special structure for the Fe2O3 (I)/rGO composites with Fe2O3 fiber as the “corncob” and multilayer reduced graphene oxide as the “sepal” is beneficial to further reduce the electronic conductivity of composites. Also, the low impedance can be attributed to higher surface area, uniform Fe2O3 nanofiber distribution in graphene layer, and better electrolyte wettability associated with porous structure of the Fe2O3/rGO composite material.
Finally, to further understand the excellent rate and long cycle performance of the Fe2O3/rGO composite electrodes based on above results, the structural and morphological evolution of the electrodes were measured by SEM and TEM, respectively in different cycle stages: 100th cycle, 500th cycle and 1000th cycle. As shown in Fig. 8(a and d) and (b and e), it is found that the film electrodes have maintained the fiber morphology before 500 cycles though some Fe2O3/rGO composite fiber have fractured and some fiber diameters get thin during the discharge–charge process from 100 to 500 cycles. At the 1000th cycle, the nanowires are intermixed with each other and begun to get together (Fig. 8c and f), but these Fe2O3 nanoparticles are still homogeneously distributed on the graphene sheets, which maintains the reversible the high specific capacity of the electrode material. In the meantime, the electrochemical impedance spectroscopy (EIS) measurements after initial, 500, and 1000 cycles have also confirmed the stability of Fe2O3/rGO composite electrode (Fig. S7†). The charge transfer resistance of the Fe2O3 (I)/rGO composite anode are 78, 101 and 195 Ω, respectively. It suggests that the Fe2O3 (I)/rGO composite have low charge transfer resistances, though the values become larger with the cycle number for initial to 1000 cycles gradually. The low charge transfer can be derived from the Fe2O3 nanofibers or nanoparticles encapsulated in the high conductive graphenen network.46,47 In short, the aforementioned factors of as-prepared Fe2O3 fiber/rGO composites translate to greater accessibility to active sites for the lithium ions, shorter diffusion distances and quicker lithium ion diffusion, thereby explaining the significantly better rate capability and excellent cycling performance of the Fe2O3 fiber/rGO composite electrodes.
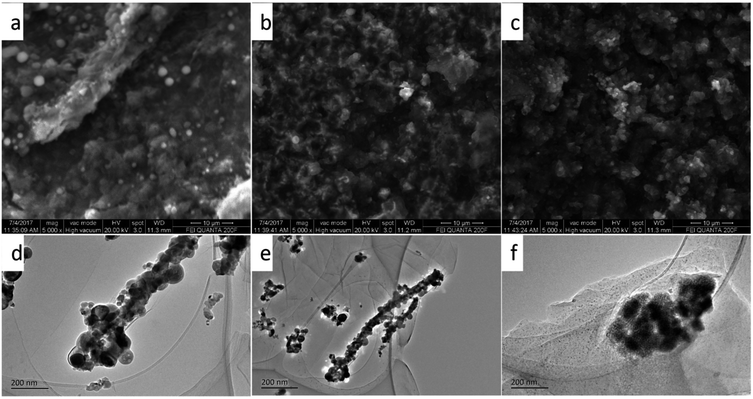 | ||
| Fig. 8 The SEM (a–c) and TEM (d–f) images of Fe2O3/rGO composites after different cycles: (a and d), 100 cycles; (b and e), 500 cycles; (c and f), 1000 cycles. | ||
4. Conclusions
In summary, we have designed and fabricated a “corn” structure for a scalable and electrochemically stable Fe2O3/rGO electrode. The fabrication process is carried out by an electrospinning technique assisted with anneal treatment and far infrared reduction process. The “corn” structure consists of Fe2O3 fibers completely protected by multilayer rGO. Natural void space between the Fe2O3 fibers and rGO allows for the expansion of Fe2O3; and the good surface area and unblocked channels in the Fe2O3 fiber facilitates fast diffusion of Li+. Interestingly, this electrode shows excellent capacity (1085.2 mA h g−1 at 0.1 A g−1), long cycle life (407.8 mA h g−1 at 5 A g−1 for 1500 cycles), and high coulombic efficiency (99%). In addition to Fe2O3, this “corn” structure can also be applied to other high capacity anode materials for next generation Li-ion batteries to improve cycle life and coulombic efficiency.Conflicts of interest
There are no conflicts to declare.Acknowledgements
This work is financial supported by the National Natural Science Foundation of China (No. 21263016, 21363015, 51662029) and the Jiangxi Province Research Program of Science and Technology (No. 2011BBE50022).References
- Z. Fan, B. Wang and S. Ding, A NiCo2O4 nanosheet-mesoporous carbon composite electrode for enhanced reversible lithium storage, Carbon, 2016, 99, 633–641 CrossRef CAS.
- Y. Guan, L. Yu and X. W. Lou, Formation of Onion-Like NiCo2S4 particles via sequential ion- exchange for hybrid supercapacitors, Adv. Mater., 2017, 29, 1605051–1605056 CrossRef PubMed.
- M. Wang, Y. Huang, X. Chen and K. Wang, Synthesis of nitrogen and sulfur co-doped graphene supported hollow ZnFe2O4 nanosphere composites for application in lithium-ion batteries, J. Alloys Compd., 2017, 691, 407–415 CrossRef CAS.
- L. Ji, α-Fe2O3 nanoparticle-loaded carbon nanofibers as stable and high-capacity anodes for rechargeable lithium-ion batteries, ACS Appl. Mater. Interfaces, 2012, 4(5), 2672–2679 CAS.
- J. Chen, L. N. Xu, W. Y. Li and X. L. Gou, α-Fe2O3 nanotubes in gas sensor and lithium-ion battery applications, Adv. Mater., 2005, 17, 582–586 CrossRef CAS.
- R. Liu, W. Su, P. He, C. Shen, C. Zhang, F. Su and C.-A. Wang, Synthesis of SnO2/Sn hybrid hollow spheres as high performance anode materials for lithium ion battery, J. Alloys Compd., 2016, 688, 908–913 CrossRef CAS.
- N. Zhang, Y. Huang, M. Zong and X. Ding, Synthesis of ZnS quantum dots and CoFe2O4 nanoparticles co-loaded with graphene nanosheets, Chem. Eng. J., 2017, 308, 214–221 CrossRef CAS.
- J. S. Cho, Y. J. Hong and Y. C. Kang, Design and synthesis of bubble-nanorod-structured Fe2O3 carbon nanofibers as advanced anode material for Li-ion batteries, ACS Nano, 2015, 4(9), 4025–4035 Search PubMed.
- Z. Li, Y. Wang and M. Wu, Synthesis of nanocomposites with carbon–SnO2 dual-shells on TiO2 nanotubes and their application in lithium ion batteries, J. Mater. Chem., 2015, 3, 16057–16062 RSC.
- Y. Xiang, H. Wu, S. Ding and G. Gao, Quick one-pot synthesis of amorphous carbon coated cobalt–ferrite twin elliptical frustums for enhanced lithium storage capability, J. Mater. Chem., 2017, 5, 8062–8069 RSC.
- B. Dong, M. Li and C. Xiao, Tunable growth of perpendicular cobalt ferrite nanosheets on reduced graphene oxide for energy storage, Nanotechnology, 2017, 28, 55401–55407 CrossRef PubMed.
- X. Sun, G.-P. Hao, X. Lu, L. Xi, B. Liu, W. Si, C. Ma, Q. Liu, Q. Zhang, S. Kaskel and O. G. Schmidt, High-defect hydrophilic carbon cuboids anchored with Co/CoO nanoparticles as highly efficient and ultra-stable lithium-ion battery anodes, J. Mater. Chem. A, 2016, 4(26), 10166–10173 CAS.
- X. Gu, J. Yue, L. Li, H. Xue, J. Yang and X. Zhao, General synthesis of MnOx (MnO2, Mn2O3, Mn3O4, MnO) hierarchical microspheres as lithium-ion battery anodes, Electrochim. Acta, 2015, 184, 250–256 CrossRef CAS.
- C. T. Cherian, J. Sundaramurthy, M. Kalaivani, P. Ragupathy, P. S. Kumar, V. Thavasi, M. Reddy, C. H. Sow, S. G. Mhaisalkar and S. Ramakrishna, Electrospun α-Fe2O3 nanorods as a stable, high capacity anode material for Li-ion batteries, J. Mater. Chem., 2012, 22, 12198–12204 RSC.
- M. V. Reddy, G. V. S. Rao and B. V. R. Chowdari, Metal oxides and oxysalts as anode materials for Li ion batteries, Chem. Rev., 2013, 113, 5364–5457 CrossRef CAS PubMed.
- Q. Su, D. Xie, J. Zhang, G. Du and B. Xu, In situ transmission electron microscopy observation of the conversion mechanism of Fe2O3/graphene anode during lithiation delithiation processes, ACS Nano, 2013, 7, 9115–9121 CrossRef CAS PubMed.
- H. Wang, et al., Fabrication, formation mechanism and the application in lithium-ion battery of porous Fe2O3 nanotubes via single-spinneret electrospinning, Electrochim. Acta, 2015, 158, 105–112 CrossRef CAS.
- J. Jiao, et al., Synthesis of well-defined Fe3O4 nanorods/N-doped graphene for lithium-ion batteries, Nano Res., 2016, 9(5), 1256–1266 CrossRef CAS.
- S. Yan and Q. Wu, A novel structure for enhancing the sensitivity of gas sensors-α-Fe2O3 nanoropes containing a large amount of grain boundaries and their excellent ethanol sensing performance, J. Mater. Chem. A, 2015, 3, 5982 CAS.
- K. S. Lee, et al., Hollow nanobarrels of α-Fe2O3 on reduced graphene oxide as high-performance anode for lithium-ion batteries, ACS Appl. Mater. Interfaces, 2016, 8(3), 2027–2034 CAS.
- Y. Wang, P. Mao and W. Wu, Flower-like Fe2O3/reduced graphene oxide composite for electrochemical energy storage, Synth. Met., 2016, 222, 198–204 CrossRef CAS.
- J. Liang, C. Xiao and S. Ding, Porous Fe2O3 spheres coated with N-doped carbon from polydopamine as Li ion battery anode materials, Nanotechnology, 2016, 27, 215403–215411 CrossRef PubMed.
- G. D. Park, et al., Na-ion storage performances of FeSex and Fe2O3 hollow nanoparticles-decorated reduced graphene oxide Balls prepared by nanoscale Kirkendall diffusion Process, Sci. Rep., 2016, 6, 22432 CrossRef CAS PubMed.
- T. Muraliganth, A. Vadivel Murugan and A. Manthiram, Facile synthesis of carbon-decorated single-crystalline Fe3O4 nanowires and their application as high performance anode in lithium ion batteries, Chem. Commun., 2009, 7360–7362 RSC.
- L. Wang, et al., Electrospun hollow cage-like α-Fe2O3 microspheres: synthesis, formation mechanism, and morphology-preserved conversion to Fe nanostructures, CrystEngComm, 2014, 16, 10618 RSC.
- S. Chaudhari and M. Srinivasan, 1D hollow α-Fe2O3 electrospun nanofibers as high performance anode material for lithium ion batteries, J. Mater. Chem., 2012, 22, 23049–23056 RSC.
- L. Liu, et al., Seaweed-derived route to Fe2O3 hollow nanoparticles/N-doped graphene aerogels with high lithium ion storage performance, ACS Appl. Mater. Interfaces, 2016, 8(11), 7047–7053 CAS.
- X. Zhu, et al., Nanostructured reduced graphene oxide/Fe2O3 composite as a high-performance anode material for lithium ion batteries, ACS Nano, 2011, 5(4), 3333–3338 CrossRef CAS PubMed.
- X. Wang, L. Fan and B. Lu, Core–shell Ge@graphene@TiO2 nanofibers as a high-capacity and cycle-stable anode for lithium and sodium ion battery, Adv. Funct. Mater., 2016, 26, 1104–1111 CrossRef CAS.
- L. Su, L. Jing and Z. Zhou, Li ion battery materials with core–shell nanostructures, Nanoscale, 2011, 3, 3969–3983 Search PubMed.
- Z. Zhang, F. Xiao and S. Wang, Functionalized carbonaceous fibers for high performance flexible all-solid-state asymmetric supercapacitors, J. Mater. Chem. A, 2015, 3, 11817–11823 CAS.
- Y. Zhu, W. Liu and J. Chen, Directing silicon-graphene self-assembly as a core/shell anode for high-performance lithium-ion batteries, Langmuir, 2013, 29, 744–749 CrossRef CAS PubMed.
- S. Yang, X. Feng and S. Ivanovici, Fabrication of graphene-encapsulated oxide nanoparticles: towards high-performance anode materials for lithium storage, Angew. Chem., Int. Ed., 2016, 49, 8408–8411 CrossRef PubMed.
- F. Xiang, et al., Scalable and rapid Far Infrared reduction of graphene oxide for high performance lithium ion batteries, Energy Storage Mater., 2015, 1, 9–16 CrossRef.
- Y. Zhu, et al., Preparation of superhydrophilic α-Fe2O3 nanofibers with tunable magnetic properties, Thin Solid Films, 2006, 510(1/2), 271–274 CrossRef CAS.
- Y. Xiao, X. Li, J. Zai and X. Qian, CoFe2O4 graphene nanocomposites synthesized through an ultrasonic method with enhanced performance as anode materials for Li-ion batteries, Nano-Micro Lett., 2014, 6, 307–315 CrossRef.
- Y. Xiao, J. Zai, B. Tian and X. Qian, Formation of NiFe2O4/expanded graphite nanocomposites with superior lithium storage properties, Nano-Micro Lett., 2017, 9, 34 CrossRef.
- C. Wu, H. Zhang and Y. X. Wu, Synthesis and characterization of Fe@Fe2O3 core-shell nanoparticles/graphene anode material for lithium-ion batteries, Electrochim. Acta, 2014, 134, 18–27 CrossRef CAS.
- T. Hu, et al., Trimethylamine sensing properties of graphene quantum dots/α-Fe2O3 composites, J. Solid State Chem., 2016, 237, 284–291 CrossRef CAS.
- Y. Zou, J. Kan and Y. Wang, Fe2O3-graphene rice-on-sheet nanocomposite for high and fast lithium ion storage, J. Phys. Chem. C, 2011, 115, 20747–20753 CAS.
- J. Morales, L. Sanchez and F. Martin, et al., Synthesis and characterization of nanometric iron and iron–titanium oxides by mechanical milling: electrochemical properties as anodic materials in lithium cells, J. Electrochem. Soc., 2005, 152, A1748 CrossRef CAS.
- G. Zhou, D.-W. Wang, P.-X. Hou, W. Li, N. Li, C. Liu, F. Li and H.-M. Cheng, A nanosized Fe2O3 decorated single-walled carbon nanotube membrane as a high-performance flexible anode for lithium ion batteries, J. Mater. Chem., 2012, 22, 17942–17946 RSC.
- K. Xu, S. Zhang and R. Jow, Electrochemical Impedance Study of Graphite/Electrolyte Interface Formed in LiBOB/PC Electrolyte, J. Power Sources, 2005, 143, 197–202 CrossRef CAS.
- Y. Zhang, C.-Y. Wang and X. Tang, Cycling Degradation of an Automotive LiFePO4 Lithium-Ion Battery, J. Power Sources, 2011, 196, 1513–1520 CrossRef CAS.
- A. J. Bard and L. R. Faulkner, Electrochemical Methods: Fundamentals and Applications, Wiley, New York, 2nd edn, 2001 Search PubMed.
- X. Li, J. Zai, S. Xiang and X. Qian, Regeneration of metal sulfides in the delithiation process: the key to cyclic stability, Adv. Energy Mater., 2016, 6, 1601056 CrossRef.
- X. Liu, J. Zai, Z. Ma and X. Qian, Na2Ge4O9 nanoparticles encapsulated in 3D carbon networks with long-term stability and superior rate capability in lithium ion batteries, J. Mater. Chem. A, 2016, 4, 10552–10557 CAS.
Footnote |
| † Electronic supplementary information (ESI) available. See DOI: 10.1039/c7ra08846a |
| This journal is © The Royal Society of Chemistry 2017 |

