 Open Access Article
A novel triazine-rich polymer wrapped MMT: synthesis, characterization and its application in flame-retardant poly(butylene terephthalate)
Fei Xin *a,
Chao Guoa,
Yu Chenb,
Hailong Zhanga and
Lijun Qian
 a
a
aSchool of Materials and Mechanical Engineering, Beijing Technology and Business University, Beijing 100048, People's Republic of China. E-mail: xinfei@th.btbu.edu.cn
bBeijing Huateng Hightech Co.,Ltd., Beijing 100048, PR China
First published on 9th October 2017
Abstract
A novel flame retardant (PTAC–MMT) was prepared by wrapping montmorillonite (MMT) with poly(2,4,6-triallyloxy-1,3,5-triazine) (TAC) via in situ polymerization, and its structure and properties were characterized by Fourier transformed infrared (FT-IR) spectroscopy, 1H nuclear magnetic resonance (1H NMR) and 13C NMR, transmission electron microscopy (TEM), X-ray powder diffraction (XRD) and thermogravimetric analysis (TGA) measurements. The PTAC–MMT and aluminum diethylphosphinate (AlPi) were then incorporated into poly(butylene terephthalate) (PBT) to improve the flame retardancy. The sample containing 1.67 wt% PTAC–MMT and 8.33 wt% AlPi had a LOI value of 36.4% and achieved UL94 V-0 classification. The wrapping flame retardants exhibited excellent anti-dripping effect in PBT composite. This work could provide a novel way to prepare modified MMT and the as-prepared flame retardants.
1. Introduction
Polybutylene terephthalate (PBT) is an important thermoplastic polymer in modern industry, and has been widely used because of its good mechanical properties, chemical resistance, low cost, high processability, and moderate recyclability.1–3 However, they are flammable and tend to drip during burning, which contributes to fire spread. Therefore, it is a challenging task and has caused great concern to impart both flame retardancy and dripping resistance to PBT.4–7 Although several commercially available systems for flame retardancy of PBT consist of a halogen-containing additive and a synergist, they are persistent, bio-accumulative, toxic, and are prohibited under various legislations.8–11To obtain a highly efficient and “safer” flame-retardant PBT, the syntheses of some new organophosphorous compounds or phosphorus–nitrogen compounds and inorganic additives have already been conducted.12–17 The improvement of flame retardancy attributed to the formation of network char layer created by decomposition of triazine-rich polymer, which can hinder the heat and mass transport.18–20 Montmorillonite (MMT) was frequently used in many polymer nanocomposites owing to its particular nano-layer structure.21–23 However, the agglomeration of MMT particles might cause poor dispersion in polymer matrix, which also deteriorates the flame retardancy efficiency and mechanical performances.24–27 Therefore, much effort is necessary devoted to improve the dispersibility of the MMT through organo- or nano-modification of MMT.28–30 To design an efficient triazine-rich flame-retardant and to study the effect of their wrapped structure on the properties of PBT composites is of great significance for promoting the development of this field. For example, higher flame retardancy obtained and the mechanical properties improved, which can be attributed to the good interfacial adhesion between wrapped MMT and the polymer matrix.
This work mainly aims at the reduction of the agglomeration of MMT layers in PBT nanocomposites, a triazine-rich polymer, poly(2,4,6-triallyloxy-1,3,5-triazine) (PTAC) wrapped on the surface of MMT was designed and synthesized by in situ intercalation polymerization to obtain PTAC–MMT. The PBT composite containing a small amount of PTAC–MMT in combination with AlPi was prepared, and its flammability was characterized. The synergistic flame-retardant effects of PTAC–MMT/AlPi were also analyzed. This study will focus on exploring a new route for the efficient use of MMT compared with the common organo-modified MMT.
2. Experimental
2.1. Raw materials
TAC, 2,4,6-triallyloxy-1,3,5-triazine, were supplied by TCI Shanghai Huacheng Industrial Development Corp. Ltd., China. The original montmorillonite (Na-MMT) in this study was provided by Zhejiang Fenghong Clay Corp. Ltd., China. Aluminum diethylphosphinate (AlPi) was obtained from Clariant Chemicals (China) Ltd. Poly(butylene terephthalate) (PBT) was purchased from Nantong Xingchen synthetic material CO. Ltd., China. Unless otherwise indicated, all materials were used as-received.2.2. Preparation of PTAC–MMT and PTAC
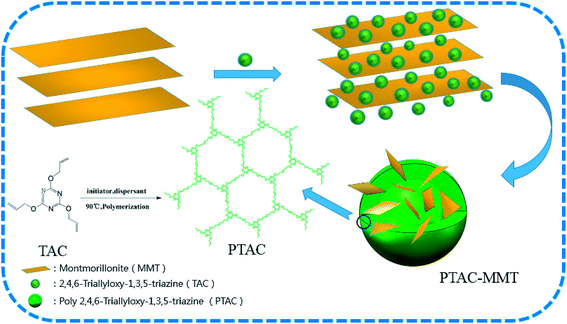
The wrapped MMT, designated as PTAC–MMT, were prepared as follows. 9.00 g TAC and 3.00 g original MMT dissolved in 200 mL water according to the feed ratio (3![[thin space (1/6-em)]](https://www.rsc.org/images/entities/char_2009.gif) :
:![[thin space (1/6-em)]](https://www.rsc.org/images/entities/char_2009.gif) 1) of polymer monomers to MMT and even agitation, then placed in an ultrasonic bath dispersion for 60 min under 60 °C, inserting TAC in MMT layer using the water solvation effects. Subsequently, the solution were fed into a 500 mL three-necked flask added initiator and dispersant, then the reaction mixture was maintained under 98 °C for 3 h and stir constantly. Finally, resulting emulsion colloid PTAC–MMT was filtered to remove the small molecular weight impurity, and the product was washed at least three times. The resulting product was dried for 6 h at 110 °C to a constant weight. Moreover, in order to determine the CPM, a triazine-rich polymer PTAC was synthesized using the same method without the addition of MMT. The schematic representation of preparing process of PTAC–MMT and PTAC are shown in Scheme 1.
1) of polymer monomers to MMT and even agitation, then placed in an ultrasonic bath dispersion for 60 min under 60 °C, inserting TAC in MMT layer using the water solvation effects. Subsequently, the solution were fed into a 500 mL three-necked flask added initiator and dispersant, then the reaction mixture was maintained under 98 °C for 3 h and stir constantly. Finally, resulting emulsion colloid PTAC–MMT was filtered to remove the small molecular weight impurity, and the product was washed at least three times. The resulting product was dried for 6 h at 110 °C to a constant weight. Moreover, in order to determine the CPM, a triazine-rich polymer PTAC was synthesized using the same method without the addition of MMT. The schematic representation of preparing process of PTAC–MMT and PTAC are shown in Scheme 1.
2.3. Preparation of flame-retardant PBT resins
The compounds of PBT with PTAC–MMT and AlPi were prepared using an LABTECH counter-roating twin-screw extruder with a screw speed of 70 rpm. Before mixing, flame retardants were dried at 120 °C and PBT resin dried at 140 °C under vacuum for 4 h. The aggregate samples were then transferred to a mold and preheated at 240 °C for 9 min, then pressed at 10 MPa, and cooled to room temperature to obtain the composite sheets. All the details of formulae listed in Table 1.| Samples | Composition of formulations in 10 wt% | ||
|---|---|---|---|
| PBT (wt%) | PTAC–MMT (wt%) | AlPi (wt%) | |
a 1PTAC–MMT/5AlPi/PBT means the weight ratio PTAC–MMT to AlPi was 1![[thin space (1/6-em)]](https://www.rsc.org/images/entities/char_2009.gif) : :![[thin space (1/6-em)]](https://www.rsc.org/images/entities/char_2009.gif) 5. 5. |
|||
| Pristine PBT | 100 | 0 | 0 |
| AlPi/PBT | 90 | 0 | 10 |
| 1PTAC–MMT/5AlPi/PBT | 90 | 1.67 | 8.33 |
| 1PTAC–MMT/4AlPi/PBT | 90 | 2 | 8 |
| 1PTAC–MMT/3AlPi/PBT | 90 | 2.5 | 7.5 |
| 1PTAC–MMT/2AlPi/PBT | 90 | 3.33 | 6.67 |
| 1PTAC–MMT/1AlPi/PBT | 90 | 5 | 5 |
2.4. Characterizations
Fourier transform infrared (FTIR) spectra was detected on a Nicolet iN10MX type spectrometer.Hydrogen-1 nuclear magnetic resonance (1H NMR) and 13C NMR data were obtained using a Bruker 400 MHz WB Solid-State NMR Spectrometer.
Morphology of PTAC–MMT were observed with a Talos F200S transmission electron microscope (TEM) at an accelerating voltage of 100 kV.
XRD patterns were measured using a RIGAKU Miniflex600 X-ray diffractometer with Cu Ka radiation (λ = 0.1541 nm).
Thermo gravimetric analysis (TGA) was recorded on TA instrument Q500 IR thermal gravimetric analyzer with a heating rate of 20 °C min−1 from 50 to 700 °C under N2 atmosphere.
The limiting oxygen index (LOI) values was performed on a FTT (Fire Testing Technology, UK) Dynisco LOI instrument according to ASTM D 2863-97 with sample size of 130 mm × 6.5 mm × 3.2 mm.
The vertical burning test (UL-94) were performed on FTT0082 instrument according to ASTM D 3801 testing procedure with sheet dimensions of 130 mm × 13 mm × 3 mm.
The fire behavior was characterized on a FTT cone calorimeter according to ISO5660 under an external heat flux of 50 kW m−2 with sample size of 100 mm × 100 mm × 3 mm.
The morphology images of the residues after cone calorimeter test were obtained using a digital camera and Phenom Pro field emission scanning electron microscope at high vacuum conditions with a voltage of 5 kV.
3. Results and discussion
3.1. Characterization of PTAC–MMT
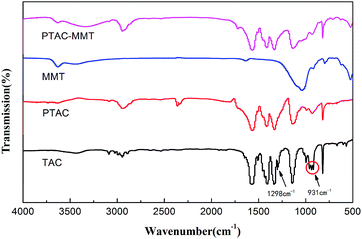
Fig. 1 shows the FTIR spectra of TAC, MMT, PTAC and PTAC–MMT. For MMT, they have few identifiable functional groups. The characteristic absorption bands at 1636 cm−1 and 1038 cm−1, which attributed to H–O–H bending vibration, and Si–O–Si asymmetric stretching vibration, respectively.31 Several characteristic peaks appeared in PTAC–MMT after in situ polymerization. In the FTIR spectra of PTAC, it is observed that the strong absorption peaks at 1567 cm−1 are attributed to the vibration of the triazine ring skeleton. The characteristic peaks centered at 1404 cm−1 and 1331 cm−1 correspond to C–N and C–O, respectively. The absorption peak at 931 cm−1 indicates the formation of the RCH![[double bond, length as m-dash]](https://www.rsc.org/images/entities/char_e001.gif) CHR′. Meanwhile, the absorption peak at 1298 cm−1 corresponding to the RCH
CHR′. Meanwhile, the absorption peak at 1298 cm−1 corresponding to the RCH![[double bond, length as m-dash]](https://www.rsc.org/images/entities/char_e001.gif) CH2 bond disappear. Therefore, it can be deduced that the PTAC was successfully synthesized. Furthermore, these characteristic peaks in the spectrum of PTAC also appear in the spectrum of PTAC–MMT. It shows that the polymer PTAC exists in PTAC–MMT.
CH2 bond disappear. Therefore, it can be deduced that the PTAC was successfully synthesized. Furthermore, these characteristic peaks in the spectrum of PTAC also appear in the spectrum of PTAC–MMT. It shows that the polymer PTAC exists in PTAC–MMT.
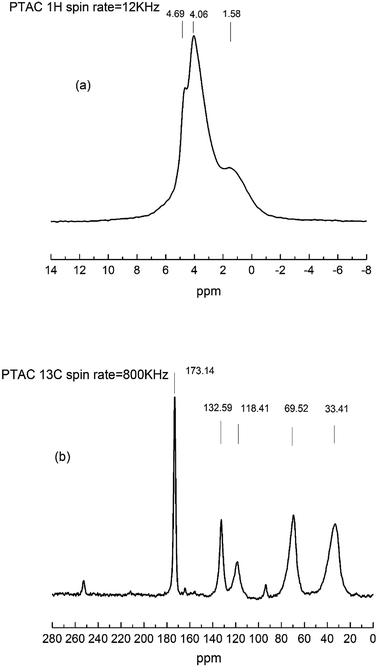
The 1H NMR (a) and 13C NMR (b) spectrum were further used to investigate the chemical structural of PTAC. As shown in Fig. 2, in the 1H solid-state NMR spectrum, it can be found that the 1H of –CH2 from PTAC resonates at δ = 1.58 ppm, ![[double bond, length as m-dash]](https://www.rsc.org/images/entities/char_e001.gif) CH2 from PTAC resonates at δ = 4.69 ppm. Another typical peak observed at δ = 4.06 ppm, induced by the proton peak of RCH
CH2 from PTAC resonates at δ = 4.69 ppm. Another typical peak observed at δ = 4.06 ppm, induced by the proton peak of RCH![[double bond, length as m-dash]](https://www.rsc.org/images/entities/char_e001.gif) groups. From the 13C solid-state NMR spectrum, the two typical absorption peaks at δ = 33.41 ppm and δ = 69.52 ppm were assigned to carbon atoms in the triazine groups and methylene groups, respectively. Furthermore, the two typical absorption peaks at δ = 118.41 ppm and δ = 132.59 ppm were assigned to carbon atoms in the R2C
groups. From the 13C solid-state NMR spectrum, the two typical absorption peaks at δ = 33.41 ppm and δ = 69.52 ppm were assigned to carbon atoms in the triazine groups and methylene groups, respectively. Furthermore, the two typical absorption peaks at δ = 118.41 ppm and δ = 132.59 ppm were assigned to carbon atoms in the R2C![[double bond, length as m-dash]](https://www.rsc.org/images/entities/char_e001.gif) CH2 and RCH
CH2 and RCH![[double bond, length as m-dash]](https://www.rsc.org/images/entities/char_e001.gif) CHR′. The results of FTIR and 1H NMR/13C NMR clearly verified that PTAC was successfully synthesized.
CHR′. The results of FTIR and 1H NMR/13C NMR clearly verified that PTAC was successfully synthesized.
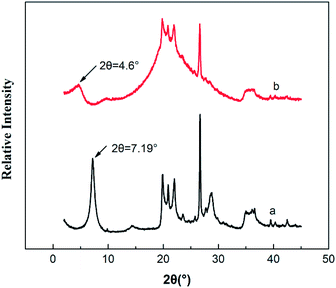
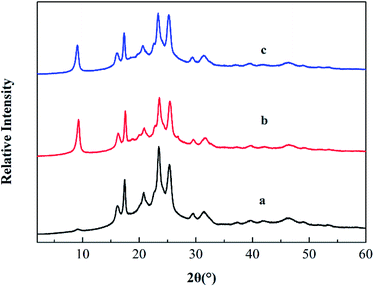
XRD analysis is a classical method to evaluate whether PTAC was entered into MMT or not, because the interlayer can be estimated by measuring the d001 spacing. Fig. 3 shows the XRD pattern of original MMT and PTAC–MMT, respectively. At 2θ = 7.19°, there is a strong diffraction peak in MMT. The distance between layers can be calculated according to the Bragg equation.
2d![[thin space (1/6-em)]](https://www.rsc.org/images/entities/char_2009.gif) sin sin![[thin space (1/6-em)]](https://www.rsc.org/images/entities/char_2009.gif) θ = nλ θ = nλ
| (1) |
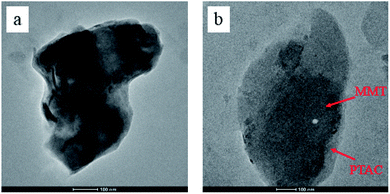
The TEM images of MMT and PTAC–MMT presented in Fig. 4. One can see a typical TEM of the surface morphology and aqueous suspensions of the original MMT and PTAC–MMT hybrid particles. As shown in Fig. 4(a), silicate lamella of MMT in the forms of aggregation or stack together arbitrary were observed. In Fig. 4(b), the bright regions of the photograph at 100 nm magnification represent the domain polymer of PTAC and the dark lines correspond to the cross section of clay layers. The surface of MMT became obscure and rough because the polymer PTAC wrapped on the external surface of MMT.32 These results demonstrated that the PTAC successfully coated onto MMT surface, which was in good agreement with the XRD results. Undoubtedly, the TEM images provide further evidence of the successful wrapping of PTAC–MMT.
Fig. 5 shows the TGA curves of MMT, PTAC, and PTAC–MMT, which were measured from 50 °C to 700 °C at 20 °C min−1 under N2 atmosphere. Obviously, MMT presented good thermal stability under N2 atmosphere. When the temperature was increased up to 700 °C, there was no evident decomposition in MMT, with 96.1 wt% of residue at that temperature. The synthesized triazine-rich polymer PTAC started to decompose at 318 °C (weight loss 0.5 wt%) and about 8.1 wt% of residue was left at 700 °C, indicating PTAC had a good char-forming capability. For PTAC–MMT about 23.9 wt% of residues were left at 700 °C. By comparing the differences in the weight loss between MMT, PTAC, and PTAC–MMT, the content of the polymer PTAC in PTAC–MMT was roughly estimated using the following equation:
| WPTAC–MMT = (1 − CPM) × WMMT + CPM × WPTAC | (2) |
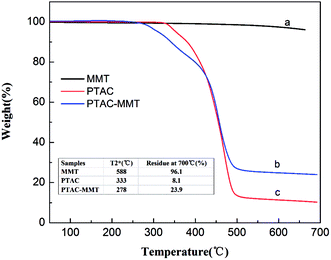 | ||
Fig. 5 TGA curves of (a) original MMT, (b) PTAC–MMT and (c) PTAC.  = the temperature at which 2 wt% weight loss takes place. = the temperature at which 2 wt% weight loss takes place. | ||
Considering that the mutual influence on thermal degradation between PTAC and MMT is possible, the CPM is only approximate but not accurate. The calculated CPM is 82.0%.
3.2. Structure and morphology of PBT/AlPi/MMT and PBT/AlPi/PTAC–MMT nanocomposites
The reinforcement potential of PTAC–MMT is remarkably dependent on the distribution of PTAC–MMT in the PBT matrix. Therefore, it is necessary to determine the dispersibility of PTAC–MMT in the PBT matrix. As shown in Fig. 6, the dispersion of PTAC–MMT was examined by SEM. The fracture surface of pristine PBT in Fig. 6(a) was undefiled without nanofillers. We can see from Fig. 6(b), PTAC–MMT and AlPi particles showed a good dispersion in the PBT and no obvious aggregation was observed. After the introduction of PTAC–MMT, the fracture surface of flame retardant PBT become rough, moreover, it is hard to distinct PBT from PTAC–MMT, indicating a strong interaction between PTAC–MMT and PBT matrix.20 This indicates that the PTAC wrapped on the surface of MMT could prevent the agglomeration of MMT and improve the interfacial interactions between PBT and PTAC–MMT.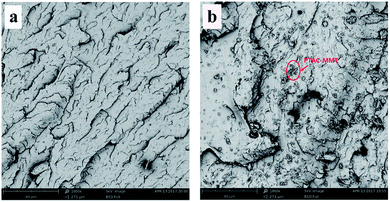 | ||
| Fig. 6 SEM images of fracture surfaces of (a) pristine PBT × 1000; (b) 10% 1PTAC–MMT/5AlPi/PBT × 1000. | ||
Fig. 7 shows the XRD patterns of PBT, PBT/AlPi/MMT and PBT/AlPi/PTAC–MMT. The PBT/AlPi/MMT mixture did not show any obvious characteristic MMT peaks, whereas the characteristic peaks of PBT were still well retained, which might possibly be related to the dilution effect by the PBT matrix at lower addition of clay.33 It can be seen from Fig. 7(c), the diffraction peak of PTAC–MMT at 2θ = 4.6° disappeared, which indicated exfoliation of MMT in the polymer matrix. The other peaks of MMT in PTAC–MMT cannot be detected, this implies that the regular and periodic structure of MMT is lost and the MMT layers are exfoliated.23,24
3.3. The flame-retardant performances of the composites
| Samples | LOI | Ul-94 | Dripping | Residue (%) at 700 °C |
|---|---|---|---|---|
| Pristine PBT | 20.4 | NR | Y | 4.83 |
| AlPi/PBT | 34.1 | NR | Y | 7.48 |
| 1PTAC–MMT/5AlPi/PBT | 36.4 | V-0 | N | 7.90 |
| 1PTAC–MMT/4AlPi/PBT | 35.2 | V-0 | N | 7.82 |
| 1PTAC–MMT/3AlPi/PBT | 33.7 | V-0 | N | 7.69 |
| 1PTAC–MMT/2AlPi/PBT | 29.3 | V-0 | N | 7.46 |
| 1PTAC–MMT/1AlPi/PBT | 27.0 | NR | Y | 7.34 |
| Samples | Pristine PBT | 10% AlPi/PBT | 10% 1PTAC–MMT/5AlPi/PBT |
|---|---|---|---|
| a The uncertainty is ±10% of reported the TTI, PHRR, THR, av-EHC and char yield values. | |||
| TTI(s) | 52 | 49 | 41 |
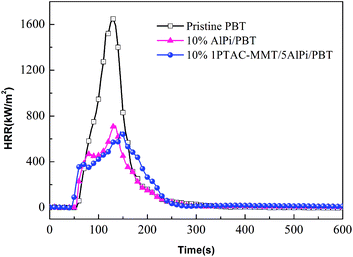
| PHRR (kW m−2) | 1648.9 | 714.4 (56.6%) | 661.5 (59.8%) |
| THR (MJ m−2) | 116.15 | 67.97 (41.4%) | 78.87 (32.09%) |
| av-EHC (MJ kg−1) | 21.26 | 18.96 (10.8%) | 16.32 (23.2%) |
| Char yield (%) | 4.83 | 7.48 | 7.90 |
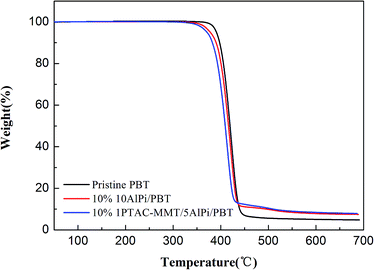 | ||
| Fig. 9 Normalized mass loss curves of pristine PBT, 10% AlPi/PBT and 10% 1PTAC–MMT/5AlPi/PBT from the TGA under N2 atmosphere. | ||
As shown in Fig. 8, the HRR curves of pristine PBT had a small shoulder after ignition and before PHRR and represents non-charring materials.37 The HRR curve of 10% 1PTAC–MMT/5AlPi/PBT showed a gentle rise after strong initial increase up to the occurring of PHRR. This was due to the 10% 1PTAC–MMT/5AlPi/PBT formed a thicker intumescent char, which showed effective barrier effect. A reduction of ignition time was observed for the 10% PTAC–MMT/AlPi/PBT nanocomposite, we can deduced that PTAC–MMT may interact with AlPi and promote the decomposition of AlPi, the nanocomposite materials is easier to be ignited and release heat.
The quantitative assessment of flame retardancy can precisely compare the difference between AlPi and PTAC–MMT in flame retardant effect. The gas-phase effect and charring are quantified by the reduction of the effective heat of combustion of the volatiles (av-EHC) and the increase in residue, respectively. The change of PHRR is attributed to the changes of the effective heat of combustion, the amount of released fuel and the barrier effect of the char.38,39
In Table 3, the av-EHC of 10% AlPi/PBT was reduced to 89.2% compared with that of the pristine PBT. The residue increased from 4.83% to 7.48%, thus the amount of released fuel was reduced to 97.2% [(1–7.48%)/(1–4.83%)]. The PHRR was reduced to 43.3%. This result demonstrates that the gas-phase effect plays a main role in the flame retardancy of 10% AlPi/PBT. The method also used for calculation of 1PTAC–MMT/5AlPi/PBT. The av-EHC was reduced to 76.7% due to the carbonication effect of PTAC–MMT. The residue increased to 7.90%, thus the amount of released fuel was reduced to 96.8%. The PHRR was reduced to 40.1%. The additional reduction of the PHRR comes from the barrier effect of the intumescent char. It shows that the barrier effect of the carbonaceous char is significant for PTAC–MMT/AlPi/PBT.
Numbers in parenthesis represent the percent reduction.
The increased char formation was observed and the evidence described in the TGA results. Fig. 9 shows the mass loss curves of the pristine PBT, 10% AlPi/PBT and 10% 1PTAC–MMT/5AlPi/PBT. The mass loss curve characterizes the reduction of mass of the material during decomposition. At the end of combustion (700 °C), the char yield of 1PTAC–MMT/5AlPi/PBT was obviously more than those of pristine PBT and 10% AlPi/PBT. The amount of solid residue collected at the end of decomposition corresponds approximately to the amount of inorganic aluminum phosphates expected from AlPi decomposition and additional carbonaceous char. Therefore, the wrapped MMT present better charring.
The differences of flame retardancy mechanisms of 10% AlPi/PBT and 10% 1PTAC–MMT/5AlPi/PBT are further compared. In condensed phase, the charring and barrier effects of 10% 1PTAC–MMT/5AlPi/PBT are stronger than 10% AlPi/PBT, which just accords with the characteristics of char yield in Fig. 9. The reason is deduced that the interaction of the products from the pyrolysis of the triazine-rich polymer and wrapped MMT promoted charring of the PBT matrix and enhanced the barrier effect of the char. Thus, the reinforced char of 1PTAC–MMT/5AlPi/PBT is more effective to hinder the heat and mass transport compared with that of 10% AlPi/PBT. The further evidences in detail will be provided in the following discussion.
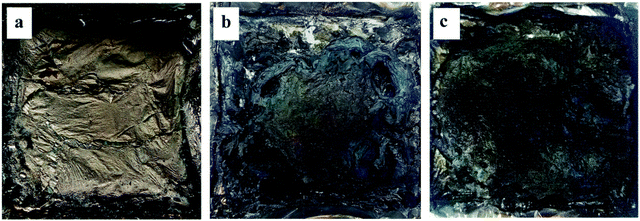 | ||
| Fig. 10 Digital photos of cone calorimeter residues of (a) pristine PBT; (b) 10% AlPi/PBT; (c) 10% 1PTAC–MMT/5AlPi/PBT. | ||
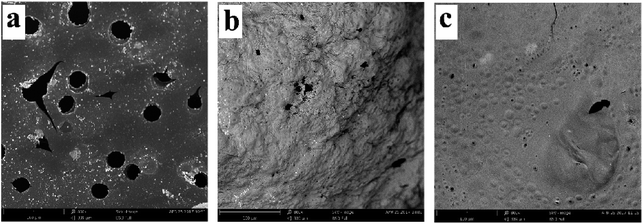
In order to further explore the charring and barrier effects of 10% 1PTAC–MMT/5AlPi/PBT, SEM images of cone calorimeter residues are shown in Fig. 11. From direct observations, the residue of pristine PBT in Fig. 11(a) had a lot of open holes with different sizes, which provided channels for the combustible volatiles from the inner matrix and heat feedback from the flame. In Fig. 11(b), the residue of 10% AlPi/PBT appeared exterior osteoporosis and porous because the undispersed network char layer created by decomposition of AlPi was brittle and easy to be damaged. Obviously, the residue of 10% 1PTAC–MMT/5AlPi/PBT in Fig. 11(c) was very dense, and few open holes were found. This can be explained by the facts that, on one hand, the wrapped MMT formed a continuous network structured protective layer; on the other hand, the polymer PTAC in PTAC–MMT generated some products to fill the gap of the network char layer of MMT to make it denser. Therefore, this residue structure can effectively seal the combustible volatiles in the matrix and decrease the combustion intensity.
4. Conclusions
A novel triazine-rich polymer wrapped MMT, PTAC–MMT, have been synthesized and characterized by FTIR and 1H NMR/13C NMR, XRD and TEM. The novel flame retardant have matchable thermal stability with PBT matrix. The combination of PTAC–MMT and AlPi shows outstanding flame-retardant effect, in particular anti-dripping property in the UL94 test. The sample containing 1.67 wt% PTAC–MMT and 8.33 wt% AlPi had a LOI value of 36.4% and achieved UL94 V-0 classification without any dripping. The wrapped MMT can significantly improve flame retardancy of PBT, and has a good anti-dripping effect. It is proposed that the wrapping with this triazine-rich flame retardant can improve the dispersibility of the MMT and hence enhance the flame retardancy simultaneously.Conflicts of interest
There are no conflicts to declare.Acknowledgements
The work was supported by the National Natural Science Foundation of China (No. 51403007).References
- S. Sullalti, M. Colonna, C. Berti, M. Fiorini and S. Karanam, Polym. Degrad. Stab., 2012, 97, 566–572 CrossRef CAS.
- T. Koppl, S. Brehme, D. Pospiech, O. Fischer, F. W. Fabris, V. Altstadt, B. Schartel and M. Doring, J. Appl. Polym. Sci., 2013, 128, 3315–3324 CrossRef.
- D. Wang, Q. J. Zhang, K. Q. Zhou, W. Yang, Y. Hu and X. L. Gong, J. Hazard. Mater., 2014, 278, 391–400 CrossRef CAS PubMed.
- Y. X. Qi, W. H. Wu, X. W. Liu, H. Q. Qu and J. Z. Xu, Fire Mater., 2017, 41, 195–208 CrossRef CAS.
- S. V. Levchik and E. D. Weil, Polym. Adv. Technol., 2004, 15, 691–700 CrossRef CAS.
- S. V. Levchik and E. D. Weil, Polym. Int., 2005, 54, 11–35 CrossRef CAS.
- E. Gallo, B. Schartel, U. Braun, P. Russo and D. Acierno, Polym. Adv. Technol., 2011, 22, 2382–2391 CrossRef CAS.
- P. Y. Jia, L. H. Hu, G. D. Feng, C. Y. Bo, J. Zhou, M. Zhang and Y. H. Zhou, RSC Adv., 2017, 7, 897–903 RSC.
- D. Y. Zhu, J. W. Guo, J. X. Xian and S. Q. Fu, RSC Adv., 2017, 7, 39270–39278 RSC.
- A. Salamova, M. H. Hermanson and R. A. Hites, Environ. Sci. Technol., 2014, 48, 6133–6140 CrossRef CAS PubMed.
- P. Gramatica, S. Cassani and A. Sangion, J. Hazard. Mater., 2016, 306, 237–246 CrossRef CAS PubMed.
- P. Liu, M. M. Liu, C. Gao, F. Wang, Y. F. Ding, B. Wen, S. M. Zhang and M. S. Yang, J. Appl. Polym. Sci., 2013, 130, 1301–1307 CrossRef CAS.
- R. Sablong, R. Duchateau, C. E. Koning, D. Pospiech, A. Korwitz, H. Komber, S. Starke, L. Häußler, D. Jehnichen and M. A. der Landwehr, Polym. Degrad. Stab., 2011, 96, 334–341 CrossRef CAS.
- W. H. Wu, S. F. Lv, X. Liu, H. Q. Qu, H. C. Zhang and J. Z. Xu, J. Therm. Anal. Calorim., 2014, 118, 1569–1575 CrossRef CAS.
- L. Y. Zou, J. Y Liu, X. Q. Liu, X. M. Wang and J. Chen, J. Therm. Anal. Calorim., 2016, 124, 1399–1409 CrossRef CAS.
- E. Gallo, U. Braun, B. Schartel, P. Russo and D. Acierno, Polym. Degrad. Stab., 2009, 94, 1245–1253 CrossRef CAS.
- W. Yang, Y. C. Kan, L. Song, Y. Hu, H. D. Lu and R. K. K. Yuen, Polym. Adv. Technol., 2011, 22, 2564–2570 CrossRef CAS.
- Y. Qiu, L. J. Qian, W. Xi and X. X. Liu, J. Appl. Polym. Sci., 2016, 43241, 1–8 Search PubMed.
- Y. J. Chen, W. Wang, Z. Q. Liu, Y. Y. Yao and L. J. Qian, J. Appl. Polym. Sci., 2016, 44660, 1–8 Search PubMed.
- M. L. Xu, Y. J. Chen, L. J. Qian, J. Y. Wang and S. Tang, J. Appl. Polym. Sci., 2014, 41006, 1–8 Search PubMed.
- Y. M. Wang, J. P. Gao, Y. Q. Ma and U. S. Agarwal, Composites, Part B, 2006, 37, 399–407 CrossRef.
- Y. H. Yang, Y. C. Li, J. Shields and R. D. Davis, J. Appl. Polym. Sci., 2015, 41767, 1–8 Search PubMed.
- D. Gao, R. Li, B. Lv, J. Z. Ma, F. Tian and J. Zhang, Composites, Part B, 2015, 77, 329–337 CrossRef CAS.
- G. B. Huang, J. R. Gao, Y. J. Li, L. Han and X. Wang, Polym. Degrad. Stab., 2010, 95, 245–253 CrossRef CAS.
- S. T. Bee, A. Hassan, C. T. Ratnam, T. T. Tee, L. T. Sin and D. Hui, Composites, Part B, 2014, 61, 41–48 CrossRef CAS.
- G. Sanchez-Olivares, A. Sanchez-Solis, F. Calderas, L. Medina-Torres, O. Manero, A. Di Blasio and J. Alongi, Appl. Clay Sci., 2014, 102, 254–260 CrossRef CAS.
- J. C. Liu, M. Y. Fu, M. M. Jing and Q. Y. Li, Polym. Adv. Technol., 2013, 24, 273–281 CrossRef CAS.
- A. K. Kalkar, V. D. Deshpande and B. S. Vatsaraj, Thermochim. Acta, 2013, 568, 74–94 CrossRef CAS.
- S. S. Hwang, S. P. Liu, P. P. Hsu, J. M. Yeh, K. C. Chang and Y. Z. Lai, Int. Commun. Heat Mass Transfer, 2010, 37, 1036–1043 CrossRef CAS.
- S. J. Wang, F. Xin, Y. Chen, L. J. Qian and Y. J. Chen, Polym. Degrad. Stab., 2016, 129, 133–141 CrossRef CAS.
- G. G. Chen, X. M. Qi, Y. Guan, F. Peng, C. L. Yao and R. C. Sun, ACS Sustainable Chem. Eng., 2016, 4, 1985–1993 CrossRef CAS.
- K. C. Chang, G. W. Jang, C. W. Peng, C. Y. Lin, J. C. Shieh, J. M. Yeh, J. C. Yang and W. T. Li, Electrochim. Acta, 2007, 52, 5191–5200 CrossRef CAS.
- Z. Wang, H. J. Kang, W. Zhang, S. F. Zhang and J. Z. Li, Appl. Surf. Sci., 2017, 401, 271–282 CrossRef CAS.
- L. Ye, J. Ren, S. Y. Cai, Z. G. Wang and J. B. Li, Chin. J. Polym. Sci., 2016, 34, 785–796 CrossRef CAS.
- P. Luangtriratana, B. K. Kandola and P. Myler, Mater. Des., 2015, 68, 232–244 CrossRef CAS.
- X. M. Zhao, D. Xiao, J. P. Alonso and D. Y. Wang, Mater. Des., 2017, 114, 623–632 CrossRef CAS.
- M. Shabanian, M. Hajibeygi, K. Hedayati, M. Khaleghi and H. A. Khonakdar, Mater. Des., 2016, 110, 811–820 CrossRef CAS.
- S. Brehme, B. Schartel, J. Goebbels, O. Fischer, D. Pospiech, Y. Bykov and M. Döring, Polym. Degrad. Stab., 2011, 96, 875–884 CrossRef CAS.
- A. Viretto, R. Sonnier, A. Taguet, B. Otazaghine, L. Ferry, J. M. Lopez-Cuesta and C. Lagrève, Fire Mater., 2016, 40, 445–463 CrossRef CAS.
| This journal is © The Royal Society of Chemistry 2017 |

