 Open Access Article
Synthesis, structure and optical performance of red-emitting phosphor Ba5AlF13:Mn4+
Lin Qin,
Peiqing Cai,
Cuili Chen,
Jing Wang and
Hyo Jin Seo *
*
Department of Physics and Interdisciplinary Program of Biomedical, Mechanical and Electrical Engineering, Pukyong National University, Busan 608-737, Republic of Korea. E-mail: hjseo@pkun.ac.kr
First published on 24th October 2017
Abstract
Mn4+-activated cubic phase Ba5AlF13 red phosphors were prepared by the two-step coprecipitation method. The structural and optical features were characterized on the basis of X-ray diffraction (XRD), transmission electron microscopy (TEM), emission and excitation spectra, and luminescence decay curves. The Ba5AlF13:Mn4+ phosphors can be efficiently excited by near-UV to blue light and exhibit bright red emission at around 627 nm, which is assigned to the 2Eg → 4A2g transition of the 3d3 electrons in [MnF6] octahedra. Temperature dependent emission spectra and decay curves from 10 to 550 K were measured to deeply understand the luminescence mechanism of Mn4+ in the Ba5AlF13 lattice. Notably, this novel red phosphor shows excellent anti-thermal quenching behaviour (∼700% of emission intensity at 300 K relative to 10 K).
1. Introduction
Compared with traditional oxide lattices, fluoride lattices have rich advantages; for example, lower phonon energy, high refractive index, high quantum efficiency, and high thermal stability.1 From the viewpoint of the low quenching probability of the excited states of the dopant ions, many fluoride lattices have been chosen as phosphors with various activators. Mn4+, as a transition metal ion with an unfilled 3d3 electron shell, plays an important role in lighting and display fields.2 Contrary to the rare-earth-ions with the parity-forbidden f–f transition, the luminescence properties of Mn4+ with the d–d transition are easily influenced by various factors of the coordination environment. In fluoride lattices, Mn4+ prefers to occupy sites with octahedral coordination, on which a strong crystal field acts. Therefore, the Mn4+ ions exhibit an intense broad absorption band in the wavelength region near UV (550 nm) and a series of sharp emission lines peaking at around 630 nm.3,4 Due to these characteristics, considerable attention has been focused on this field.A series of Mn4+ activated red phosphors with high luminous efficacy have been reported as candidates for red-emitting phosphors, especially, Mn4+-doped fluoride hosts. Mn4+-activated microcrystals of K2TiF6 were successfully synthesized by Zhu et al. in 2014.5 The K2TiF6 microcrystals presented strong line emission with high luminescence quantum yield as high as 98%, high thermal stability, and extremely high emission intensity. Mn4+-doped alkaline hexa-fluorides, B2XF6:Mn4+ (B = K, Cs, Rb; X = Ti, Si and Ge), are well known as excellent red-emitting phosphors for warm w-LEDs.6–8 However, further exploration of novel Mn4+-doped fluorides for red phosphors is deserved, and their properties should be investigated more deeply.
Here, in this work, we choose the Mn4+-doped fluoride Ba5AlF13 as a red-emitting phosphor, which has not yet been reported in the literature to our best knowledge. The Ba5AlF13:Mn4+ nanoparticles were synthesized via the two-step coprecipitation method. The phase formation, morphological features, excitation and emission spectra and thermal quenching behaviours were further investigated. The obtained product possesses a red line-emission spectrum with high thermal stability, which has the potential to enhance the color rendering index of an LED device.
2. Experimental
2.1 Synthesis process
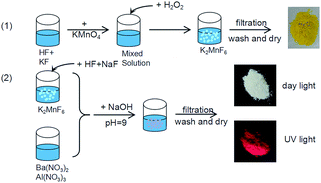
The Ba5AlF13:Mn4+ nanoparticles were prepared via the two-step coprecipitation method as shown in Fig. 1. The chemical reagents in the synthesis process were KMnO4, KF, HF, Ba(NO3)2, Al(NO3)3, NaF, H2O2, and NaOH. Firstly, the tetravalent manganese source K2MnF6 was synthesized according to Bode's method.9 The starting materials KF and KMnO4 were both dissolved in HF solution. The mixed solution was stirred for at least 30 min and then doped with H2O2 aqueous solution drop by drop until the yellow precipitate K2MnF6 was obtained. In the process of preparing the Ba5AlF13:Mn4+ nanoparticles, K2MnF6 was added to the HF solution, and then a double molar amount of NaF was added to yield the solution A.In a separate vessel, Ba(NO3)2 and Al(NO3)3 were both dissolved in water to yield solution B. Then, the A and B solutions were mixed together, and an appropriate amount of NaOH was added drop-wise while stirring the solution to adjust the pH value to about 9. Finally, the resulting white slurry was filtered, washed several times using distilled water and then dried at 180 °C for 5 h.
2.2 Characterization
The structure of the Ba5AlF13:Mn4+ nanoparticles was examined by XRD on a Rigaku D/Max 2000 diffractometer with operating parameters set to 40 kV and 30 mA. Transmission electron microscopy (TEM) was conducted to investigate the surface morphology of the samples. The samples were excited by using a 488 nm argon-ion laser and 355 nm pulsed Nd-YAG laser. The luminescence signal was detected using a photomultiplier tube (PMT, Hamamatsu, R928, Shizuoka, Japan) mounted on a 75 cm monochromator (Acton Research Corp. Pro-750). A 450 W Xe lamp dispersed by a 25 cm monochromator (Acton Research Corp. Pro-250) was used as a light source for the excitation and emission spectra. The time-resolved signal was digitized by means of a 500 MHz Tektronix DPO 3054 scope.3. Results and discussion
3.1 Structural characterization
Fig. 2 shows the XRD patterns of the Ba5AlF13:Mn4+ nanoparticles as functions of Mn4+ concentration. The standard PDF card (PDF#44-1368) is displayed for comparison. All the diffraction peaks match well with the standard PDF card, indicating that the Ba5AlF13:Mn4+ nanoparticles with different Mn4+ concentrations have been prepared as desired through the two-step coprecipitation method. The Ba5AlF13:Mn4+ nanoparticles crystallize in a cubic space group, Fd![[3 with combining macron]](https://www.rsc.org/images/entities/char_0033_0304.gif) m. The unit cell parameters are a = b = c = 17.378 Å, α = β = γ = 90°, V = 4427.83 Å3 and Z = 3.10 Although Ba5AlF13 and K2MnF6 have different crystal structures and there is a mismatch in the valence states between Al3+ and Mn4+, the Mn4+ ions can also be incorporated into the host lattice of Ba5AlF13 due to the similar ionic radii of Mn4+ (coordination number (CN) = 6, 0.53 Å) in [MnF6] and Al3+ (CN = 6, 0.535 Å) in [AlF6].11
m. The unit cell parameters are a = b = c = 17.378 Å, α = β = γ = 90°, V = 4427.83 Å3 and Z = 3.10 Although Ba5AlF13 and K2MnF6 have different crystal structures and there is a mismatch in the valence states between Al3+ and Mn4+, the Mn4+ ions can also be incorporated into the host lattice of Ba5AlF13 due to the similar ionic radii of Mn4+ (coordination number (CN) = 6, 0.53 Å) in [MnF6] and Al3+ (CN = 6, 0.535 Å) in [AlF6].11
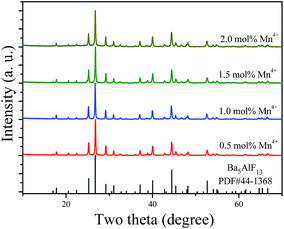 | ||
| Fig. 2 X-ray diffraction patterns of Ba5AlF13:Mn4+ nanoparticles as functions of Mn4+ concentration. The PDF card is displayed for comparison. | ||
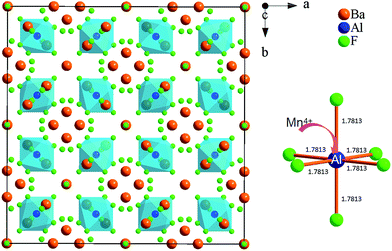
Fig. 3 shows the structural map of Ba5AlF13 and an illustration of an [AlF6] octahedron according to the atomic coordinate data from ref. 10. The Ba5AlF13 lattice contains only one unique crystallographic site of Al3+. All the Al3+ ions are located at the center of the regular octahedron [AlF6], while Ba2+ forms [Ba(2)F8] and [Ba(1)F10] polyhedra connected together with the [AlF6] octahedra. Since the ionic radius (0.530 Å) of Mn4+ is a little smaller than that (0.535 Å) of Al3+, the Mn4+–F− distance is probably smaller than the Al3+–F− distance. This means that a distorted system of [MnF6] octahedra is preserved.
The actual size and morphology of the particles were analysed by TEM. Fig. 4a is a typical TEM image of the Ba5AlF13:Mn4+ nanoparticles. The size of the nanoparticles is estimated to be about 120 × 120 nm2. Fig. 4b shows the high-resolution TEM (HRTEM) image confirming the single-crystalline nature of the Ba5AlF13:Mn4+ nanoparticles. In addition, the selected area electron diffraction (SAED) pattern (the inset of Fig. 4b) exhibits the cubic symmetry ascribed to the Ba5AlF13:Mn4+ nanoparticles. The spacing of 3.33 Å corresponds to the (333) reflections of the Ba5AlF13:Mn4+ nanoparticles.
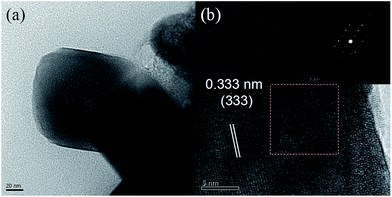 | ||
| Fig. 4 Typical TEM image (a), HRTEM image (b), and the selected area electron diffraction pattern (the inset of b) of Ba5AlF13:Mn4+ nanoparticles. | ||
3.2 Spectroscopic properties of Mn4+ ions in Ba5AlF13 lattice
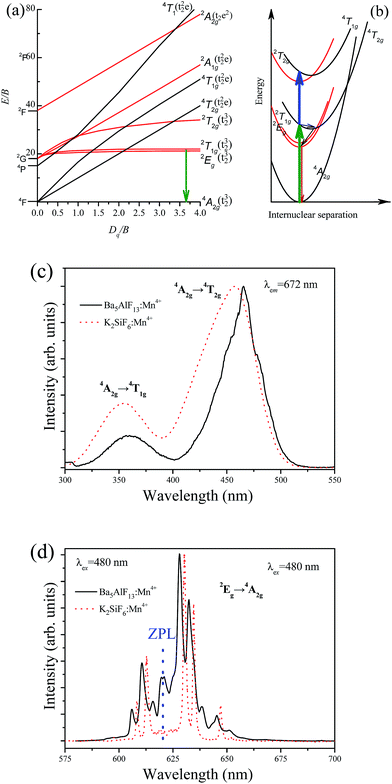
The energy level scheme of Mn4+ in the lattice can be described by using the Tanabe–Sugano diagram and configuration coordinate model as shown in Fig. 5a and b, respectively. The luminescence characteristics of the Mn4+ ions depend highly on the crystal field strength except for the 2T1g and 2Eg states. The excitation spectrum of Mn4+ corresponds to the spin allowed 4A2g → 4T2g and 4A2g → 4T1g transitions, while the emission spectrum belongs to the spin-forbidden d–d transition from the 2Eg state to the 4A2g state as in Fig. 5b. The lateral displacement between the parabolas of ground state 4A2g and excited state 4T1g (or 4T2g) is large, while there is a small displacement between the parabolas of 4A2g and 2Eg. A larger displacement implies a stronger electron–phonon interaction giving rise to a larger spectral bandwidth of the transition.12 Thus, intense excitation bands with relatively large bandwidths are expected for the transitions between these states, as well as sharp emission lines due to the 2Eg → 4A2g transition of Mn4+.The room temperature excitation spectrum of Ba5AlF13:Mn4+ (0.5 mol%) is shown in Fig. 5c. The excitation spectrum is composed of two broad bands with the maxima at 360 and 460 nm corresponding to the spin allowed 4A2g → 4T1g and 4A2g → 4T2g transitions of Mn4+, respectively. A slight splitting phenomenon can be observed in the excitation band corresponding to the 4A2 → 4T2 transition but is not observed for the 4A2 → 4T1 transition, probably due to a strong overlap with the re-absorption band of the 4A2 → 2T1 and 4A2 → 2E transitions.13 The excitation spectrum indicates that the red phosphor doped with Mn4+ can be effectively excited by near UV/blue light, which is especially ideal for blue light excitation LED chips.
Contrary to the excitation spectrum, the emission spectrum belongs to the spin-forbidden d–d transition from the 2Eg state to the 4A2g state of Mn4+, as shown in Fig. 5d. The emission spectrum consists of several sharp lines with the main peak at 627 nm. In general, the zero-phonon line (ZPL) of Mn4+ in fluoride lattices is located at around 620 nm.3 The three peaks at wavelengths longer than 620 nm belong to Stokes ν6 (t2u bending), ν4 (t1u bending), and ν3 (t1u stretching) modes, whereas the two peaks at wavelengths shorter than 620 nm belong to anti-Stokes ν6 (t2u bending) and ν4 (t1u bending) modes. The ZPL is not observable for highly symmetrical lattice environments, for example, Rb2SiF6:Mn4+ and BaTiF6:Mn4+ red phosphors.6,14 More distorted coordination environments cause a stronger intensity of the ZPL line.6 The intense ZPL observed in the emission spectrum of the Ba5AlF13:Mn4+ nanoparticles indicates that the Mn4+ ions experience a lower crystal field symmetry which is mainly due to the distorted [MnF6] octahedron in the Ba5AlF13:Mn4+ lattice. According to ref. 6, the existence of ZPL emission in a Mn4+ doped phosphor can further improve the color rendering index. The CIE chromaticity coordinates of Ba5AlF13:Mn4+ are calculated to be (x = 0.691, y = 0.31), which are close to the National Television System Committee (NTSC) standard values for red color (x = 0.67, y = 0.33).15
The local crystal field strength Dq and two Racah parameters B and C can be introduced to describe the unique energy levels of the Mn4+ ions in the Ba5AlF13 lattice.2 The local crystal field strength Dq is given by the mean peak energy of the 4A2g → 4T2g transition as obtained by the following equation:
| Dq = E(4A2g − 4T2g)/10 | (1) |
In this work, 10Dq is estimated to be 21![[thin space (1/6-em)]](https://www.rsc.org/images/entities/char_2009.gif) 500 cm−1 from the excitation spectrum. On the basis of the peak energy difference (11
500 cm−1 from the excitation spectrum. On the basis of the peak energy difference (11![[thin space (1/6-em)]](https://www.rsc.org/images/entities/char_2009.gif) 900 cm−1) between the 4A2g → 4T2g and 4A2g → 4T1g transitions, the Racah parameters B and C can be evaluated by the expressions:
900 cm−1) between the 4A2g → 4T2g and 4A2g → 4T1g transitions, the Racah parameters B and C can be evaluated by the expressions:
 | (2) |
 | (3) |
 | (4) |
From eqn (2)–(4), the crystal field parameters B and C are calculated to be 587 and 3800 cm−1, respectively, which are comparable to those of K2SiF6:Mn4+ (10Dq = 23![[thin space (1/6-em)]](https://www.rsc.org/images/entities/char_2009.gif) 900 cm−1, B = 605 cm−1, C = 3806 cm−1).16
900 cm−1, B = 605 cm−1, C = 3806 cm−1).16
The well-known K2SiF6:1% Mn4+ red phosphor was prepared for comparison with the Ba5AlF13:Mn4+ phosphor. The excitation spectrum of Ba5AlF13:Mn4+ shifts to lower energy, by about 2400 cm−1, than that of K2SiF6:Mn4+ as shown in Fig. 5c. This means that the crystal field strength of Mn4+ is weaker in the Ba5AlF13 lattice. As reported in ref. 3, the 10Dq value depends on the metal–ligand distance according to the relationship 10Dq = K/Rn, where K represents a constant and the value of n is approximately 5. As calculated in this work and with reference to ref. 3, the Al–F bond distance in the [AlF6] group is 1.781 Å in Ba5AlF13, while the Si–F bond distance in the [SiF6] group is 1.682 Å. Hence, the crystal field strength of Mn4+ is weaker in the Ba5AlF13 lattice, which is consistent with the calculated 10Dq values above. As a consequence, the excitation spectrum of Ba5AlF13:Mn4+ shifts to lower energy. In addition, the luminescence intensity of the K2SiF6:1% Mn4+ red phosphor is about three times higher than the phosphor prepared in this work.
Fig. 6 shows the emission spectra and decay curves of the Ba5AlF13:Mn4+ nanoparticles as functions of Mn4+ concentration. No difference in spectral features between different Mn4+ concentrations is observed in the emission spectra except for the relative intensities of the phonon lines. The emission intensity increases with increasing Mn4+ concentration from 0.1 mol% and then reaches the maximum intensity at 0.5 mol%. With a further increase in Mn4+ concentration, the emission intensity starts to decrease gradually because of concentration quenching.17 However, the emission intensity ratio (R) of the integrated ZPL intensity to the integrated ν6 line intensity depends on the Mn4+ concentration as shown in the inset of Fig. 6a. As mentioned above, the intensity of the ZPL depends highly on the local symmetry of the environment surrounding Mn4+. The substitution of the larger Mn4+ ion for the smaller Al3+ ion gives rise to lattice distortion. Therefore, higher Mn4+ concentrations cause more distortion of the [MnF6] octahedron, thus lowering the crystal field symmetry with larger values of R.
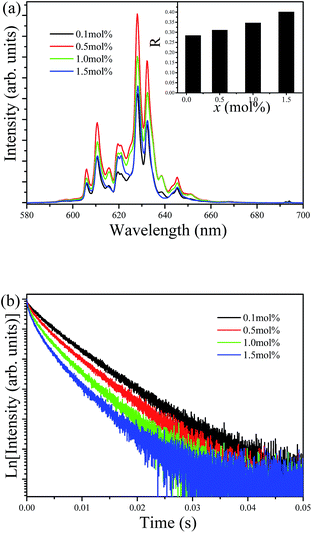 | ||
| Fig. 6 Emission spectra (a) and decay curves (b) of Ba5AlF13:Mn4+ nanoparticles as functions of Mn4+ concentration. | ||
Fig. 6b shows the luminescence decay curves of Ba5AlF13:Mn4+ (0.1–1.5 mol%) nanoparticles obtained by monitoring the 627 nm emission under excitation at 355 nm. The average decay time τ can be calculated by using the following equation.
 | (5) |
The decay time decreases with increasing Mn4+ concentration and the decay curves gradually deviate from the single exponential. The decay times are estimated to be 8.03, 7.34, 6.07 and 5.13 ms for the Mn4+ concentrations of 0.1, 0.5, 1.0 and 1.5 mol%, respectively. Samples with low Mn4+ concentrations feature reduced interactions between the Mn4+ ions, leading to nearly single exponential decay curves. However, with increasing Mn4+ concentration, the distance between the ions shortens; subsequently, energy transfer between the Mn4+ ions can occur, which provides an additional decay channel, leading to non-exponential decay curves. A possible explanation for this luminescence quenching is due to the higher nonradiative energy migration through direct transfer among the Mn4+ ions.18,19
3.3 Unusual temperature-dependent emission spectra
Fig. 7a shows the emission spectra of Ba5AlF13:Mn4+ (0.5 mol%) as functions of temperature in the temperature region 10–500 K under excitation at 488 nm. As mentioned above, the emission lines are assigned to the spin-forbidden 2Eg → 4A2g transition of Mn4+, but can gain intensity by the activation of vibronic modes.20 Some features are worth noting: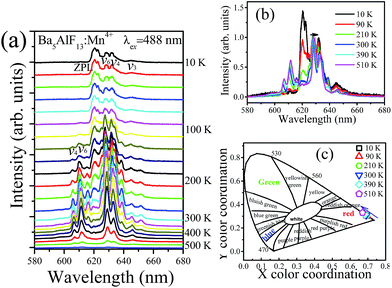 | ||
| Fig. 7 Temperature dependent emission spectra (a) and normalized emission spectra (b) and CIE chromaticity coordinates (c) of Ba5AlF13:Mn4+ (0.5 mol%). | ||
(1) The emission spectra show different spectral features at different temperatures. At 10 K, the dominant peaks are those on the low-energy side of the ZPL at 620 nm, while at T > 100 K the emission lines become broader and appear not only on the low-energy side but also on the high-energy side, and are known as the Stokes and anti-Stokes emission lines, respectively. At low temperature, the systems are more likely to occupy the vibrational ground state and Stokes emission primarily occurs. However, when the temperature rises, the electrons have enough energy to populate the upper vibration states and relax back to the ground state of 4A2g with anti-Stokes emission.21
(2) Based on the temperature dependent emission spectra in Fig. 7a, the total emission intensity as a function of temperature is shown in Fig. 8. The emission intensity increases firstly and then decreases with further increase in temperature. The emission intensity of some previously studied luminescent phosphors consistently decreases with the increase of temperature which is mainly due to the increase of the non-radiative transition probability.22 However, differently from most oxide lattices, Mn4+-doped fluoride lattices exhibit anti-thermal quenching behavior.21,23,24 As shown in Fig. 8, the total integrated emission intensity of the 2Eg → 4A2g transition at 300 K is found to be increased by about 700% compared with the initial intensity at 10 K and then decreased at higher temperatures due to the intense non-radiative transition. It is suggested for Ba5AlF13:Mn4+ that the increased emission intensity is due to expansion of the host lattice and the enhancement of the lattice vibration modes with increasing temperature.21
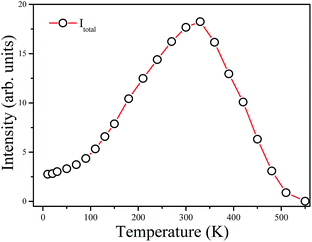 | ||
| Fig. 8 Integrated intensity of total emission (Itotal) of Ba5AlF13:Mn4+ as a function of temperature. | ||
(3) It is observed that all the emission peaks show a tiny red shift and become gradually broader with increasing temperature (Fig. 7b). This is mainly due to the expansion of the unit cell and the enhancement of the vibration modes of the MnF62− octahedra in a hot environment.16
(4) The shifts of emission peaks and the changes in the relative emission intensity may induce variations of the chromatic coordinates of the phosphor. The dependences of the chromatic coordinates upon the temperature are calculated in Table 1 and shown in Fig. 7c. The x values slightly decrease, while the y values slightly increase, with increasing temperature. The variations in chromatic coordinates are caused by the red-shift of emission bands and the enhancement of anti-Stokes bands.
| Temperature | x | y |
|---|---|---|
| 10 K | 0.696 | 0.304 |
| 90 K | 0.695 | 0.305 |
| 210 K | 0.694 | 0.306 |
| 300 K | 0.691 | 0.309 |
| 390 K | 0.683 | 0.317 |
| 510 K | 0.670 | 0.330 |
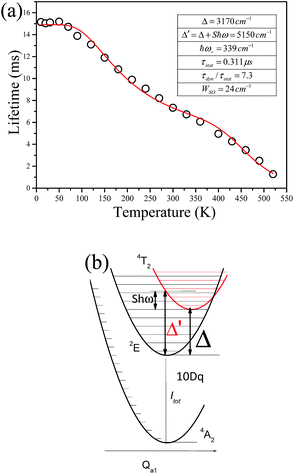
Fig. 9 shows the decay curves of the 627 nm emission under excitation at 355 nm as functions of temperature. The decays are single exponential at low temperature and become slightly non-exponential at high temperature. The decay times of the 2Eg state are calculated by using eqn (5). The decay times decrease monotonically from 15.2 ms at 10 K to 1.28 ms at 520 K. The decay times calculated from the temperature-dependent decay curves are shown in Fig. 10a. The temperature dependent decay times of Mn4+ can be analyzed by the model for Cr3+ suggested by Grinberg.25 Cr3+ is isoelectronic with Mn4+ (3d3 configuration). According to this model, an additional relaxation pathway (the spin-allowed 4T2g → 4A2g transition) occurs with increasing temperature and the temperature dependent decay times can be written by the following equation.26
 | (6) |
 is the ratio of the radiative decay times induced by static and dynamic processes. In addition,
  is explicitly independent of temperature.21
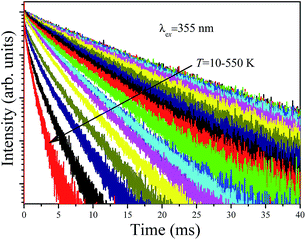 | ||
| Fig. 9 Temperature dependent decay curves of Ba5AlF13:Mn4+ obtained by monitoring the 627 nm emission under excitation at 355 nm. | ||
The temperature dependent decay times are well fitted to eqn (6) and the fit result is shown by the solid red curve in Fig. 10a. The best fit result gives the parameters Δ′ = 5150 cm−1, Δ = 3170 cm−1, ℏω = 339 cm−1, WSO = 24 cm−1, τstat = 0.311 μs and  . The results of the temperature dependent decay times of the 2Eg state indicate that an additional relaxation pathway (the spin-allowed 4T2g → 4A2g transition) due to the spin–orbit interaction of 2Eg and 4T2g states occurs with increasing temperature. As calculated, the obtained value of the radiative lifetime τstat corresponding to 4T2 → 4A2 is 0.311 μs, which is much shorter than the observed 2E → 4A2 transition. Moreover, the effective spin–orbit coupling energy (24 cm−1) is much smaller than the spin–orbit coupling energy of the spin–orbit interaction Hamiltonian generated by vibronic overlap integrals between the involved states as products of the electronic and vibronic wave functions.21
4. Conclusions
Ba5AlF13:Mn4+ nanoparticles were developed by the two-step coprecipitation method. Well-crystallized particles were obtained with sizes ranging from 300 to 500 nm. The phosphors can be effectively excited by near UV – blue light and show bright red emission colors with several sharp lines of emission in the wavelength region 60–660 nm. An intense ZPL emission at 620 nm is observed even at room temperature, which can be attributed to the incorporation of Mn4+ ions into highly distorted octahedral lattice sites. The temperature dependent luminescence indicates that the Ba5AlF13:Mn4+ red phosphor shows significant anti-thermal quenching behaviour to increase its emission intensity at 300 K relative to 10 K. In addition, based on the temperature dependent decay curves, a modified dynamic model was constructed, indicating that an additional relaxation pathway (the spin-allowed 4T2g → 4A2g transition) occurs with increasing temperature.Conflicts of interest
There are no conflicts to declare.Acknowledgements
This research was supported by Basic Science Research Program through the National Research Foundation of Korea (NRF) funded by the Ministry of Education (2017R1D1A1B03029432).References
- J. C. Boyer, F. Vetrone, L. A. Cuccia and J. A. Capobianco, J. Am. Chem. Soc., 2006, 128, 7444–7445 CrossRef CAS PubMed.
- M. G. Brika, S. J. Camardello, A. M. Srivastava, N. M. Avram and A. Suchocki, ECS J. Solid State Sci. Technol., 2016, 5, R3067–R3077 CrossRef.
- Y. Jin, M. H. Fang, M. Grinberg, S. Mahlik, T. Lesniewski, M. G. Brik, G. Y. Luo, J. G. Lin and R. S. Liu, ACS Appl. Mater. Interfaces, 2016, 8, 11194–11203 CAS.
- L. Huang, Y. W. Zhu, X. J. Zhang, R. Zou, F. J. Pan, J. Wang and M. M. Wu, Chem. Mater., 2016, 28, 1495–1502 CrossRef CAS.
- H. M. Zhu, C. C. Lin, W. Q. Luo, S. T. Shu, Z. G. Liu, Y. S. Liu, J. T. Kong, E. Ma, Y. G. Cao, R. S. Liu and X. Y. Chen, Nat. Commun., 2014, 5, 4312–4321 CAS.
- M. H. Fang, H. D. Nguyen, C. C. Lin and R. S. Liu, J. Mater. Chem. C, 2015, 3, 7277–7280 RSC.
- L. L. Wei, C. C. Lin, Y. Y. Wang, M. H. Fang, H. Jiao and R. S. Liu, ACS Appl. Mater. Interfaces, 2015, 7, 10656–10659 CAS.
- T. Han, T. C. Lang, J. Wang, M. J. Tu and L. L. Peng, RSC Adv., 2015, 5, 100054–100059 RSC.
- H. Bode, H. Jenssen and F. Bandte, Angew. Chem., 1953, 65, 304 CrossRef CAS.
- C. Martineau, M. Allix, M. R. Suchomel, F. Porcher, F. Vivet, C. Legein, M. Body, D. Massiot, F. Taulelle and F. Fayon, Dalton Trans., 2016, 45, 15565–15574 RSC.
- R. D. Shannon, Acta Crystallogr., Sect. A: Cryst. Phys., Diffr., Theor. Gen. Crystallogr., 1976, 32, 751 CrossRef.
- B. Henderson and G. F. Imbusch, Optical Spectroscopy of Inorganic Solids, Oxford University Press, 1989 Search PubMed.
- A. Lempicki, L. Andrews, S. J. Nettel, B. C. McCollum and E. I. Solomon, Phys. Rev. Lett., 1980, 44, 1234–1236 CrossRef CAS.
- D. Sekiguchi and S. Adachi, ECS J. Solid State Sci. Technol., 2014, 3, R60–R64 CrossRef CAS.
- Y. C. Chang, C. H. Liang, S. A. Yan and Y. S. Chang, J. Phys. Chem. C, 2010, 114, 3645–3652 CAS.
- L. L. Wei, C. C. Lin, M. H. Fang, M. G. Brik, S. F. Hu, H. Jiao and R. S. Liu, J. Mater. Chem. C, 2015, 3, 1655–1660 RSC.
- M. Y. Peng, X. W. Yin, P. A. Tanner, C. Q. Liang, P. F. Li, Q. Y. Zhang and J. R. Qiu, J. Am. Chem. Soc., 2013, 96, 2870–2876 CAS.
- Y. H. Jin, Y. R. Fu, Y. H. Hu, L. Chen, H. Y. Wu, G. F. Ju, M. He and T. Wang, Powder Technol., 2016, 292, 74–79 CrossRef CAS.
- R. P. Cao, Y. J. Ye, Q. Y. Peng, G. T. Zheng, H. Ao, J. W. Fu, Y. M. Guo and B. Guo, Dyes Pigm., 2017, 146, 14–19 CrossRef CAS.
- D. Sekiguchi, J. Nara and S. Adachi, J. Appl. Phys., 2013, 113, 183516–183522 CrossRef.
- W. L. Wu, M. H. Fang, W. L. Zhou, T. Lesniewski, S. Mahlik, M. Grinberg, M. G. Brik, H. S. Sheu, B. M. Cheng, J. Wang and R. S. Liu, Chem. Mater., 2017, 29, 935–939 CrossRef CAS.
- B. Wang, H. Lin, J. Xu, H. Chen and Y. S. Wang, ACS Appl. Mater. Interfaces, 2014, 6, 22905–22913 CAS.
- L. Y. Wang, E. H. Song, Y. Y. Zhou, T. T. Deng, S. Ye and Q. Y. Zhang, J. Mater. Chem. C, 2017, 5, 7253–7261 RSC.
- T. T. Deng, E. H. Song, J. Sun, L. Y. Wang, Y. Deng, S. Ye, J. Wang and Q. Y. Zhang, J. Mater. Chem. C, 2017, 5, 2910–2918 RSC.
- M. Grinberg, Opt. Mater., 2002, 19, 37–45 CrossRef CAS.
- Z. Pan, Y. Y. Lu and F. Liu, Nat. Mater., 2012, 11, 58–63 CrossRef CAS PubMed.
| This journal is © The Royal Society of Chemistry 2017 |

