 Open Access Article
Creative Commons Attribution 3.0 Unported Licence
Comparative study on sulfamethoxazole degradation by Fenton and Fe(II)-activated persulfate process
Shizong Wangab and
Jianlong Wang *abc
*abc
aCollaborative Innovation Center for Advanced Nuclear Energy Technology, INET, Tsinghua University, Beijing 100084, P. R. China. E-mail: wangjl@tsinghua.edu.cn; Fax: +86-10-62771150; Tel: +86-10-62784843
bState Key Joint Laboratory of Environment Simulation and Pollution Control, Tsinghua University, Beijing 100084, P. R. China
cBeijing Key Laboratory of Radioactive Wastes Treatment, Tsinghua University, Beijing 100084, P. R. China
First published on 17th October 2017
Abstract
Pharmaceuticals and personal care products (PPCPs) are emerging contaminants, which are ubiquitous and pose the potential risk to ecosystem and human health. It is necessary to remove PPCPs from water and wastewater. In this study, sulfamethoxazole, a widely used antibiotic, was chosen as targeted pollutant. Fenton process and persulfate process were employed to remove sulfamethoxazole from aqueous solution. The results showed that Fenton process required less amount of Fe(II) and oxidant than persulfate process to achieve 100% removal of sulfamethoxazole in the water sample prepared with de-ionized water. The maximal mineralization reached 83% when hydrogen peroxide concentration was 1 mM and Fe(II) was 0.05 mM for Fenton process. The maximal mineralization for persulfate process was 60% with 4 mM of persulfate and 4 mM of Fe(II). The increase of Fe(II) concentration could increase the decomposition of hydrogen peroxide and persulfate, but did not increase the mineralization of sulfamethoxazole, indicating that the decomposition of hydrogen peroxide and persulfate was not positive correlation with the removal and mineralization of sulfamethoxazole. Five intermediate compounds were detected in Fenton process while eight intermediate compounds in persulfate process, suggesting that different degradation pathway occurred in the two processes. The wastewater components had negative effect on the degradation of sulfamethoxazole for both Fenton and persulfate processes. The removal efficiency of sulfamethoxazole was 52.5% and 52.3%, respectively, for Fenton and persulfate processes. Persulfate process could be an alternative for treating the real wastewater containing PPCPs.
1. Introduction
Pharmaceuticals and personal care products (PPCPs) have been frequently detected in wastewater and surface water due to their widespread application.1 Some PPCPs are resistant to biodegradation, which brought the great challenge to wastewater treatment process.2 Sulfamethoxazole as one of pharmaceuticals has been widely used to cure diseases and infections, and to promote growth of animals as feed additives.3 However, the conventional wastewater treatment processes cannot effectively remove sulfamethoxazole.4–6Advanced oxidation processes (AOPs) have been employed to remove the toxic organic pollutants from water and wastewater.7 Ozonation8 and photo oxidation9 can be used to eliminate sulfamethoxazole. Fenton oxidation has attracted increasing attention due to the easy operation and relative low treatment cost. However, Fenton process has been reported to produce large amounts of iron sludge, which is required to be further treated.10 To reduce the formation of iron sludge, some iron-based compounds, such as zero valent iron,11 Fe3O4,12 Fe3O4/CeO2 composite,13 Fe3O4–Mn3O4/reduced graphene oxide hybrid,14 or the hybrid activation systems have been developed to induce the decomposition of hydrogen peroxide to hydroxyl radicals. The previous study has shown that the ultrasonic/Fe/H2O2 systems can effectively degrade carbamazepine.15 Although Fenton-like system using the iron-based compounds to replace ferrous ions showed good performance in removing sulfonamides, the recycle and stability of iron-based compounds limited practical application. Therefore, conventional Fenton process was still main treatment process in practice.
Similar to hydrogen peroxide, persulfate can be decomposed to generate sulfate radicals by activation, which can effectively degrade organic pollutants.16 The usually used activation methods mainly include heat, alkalinity, transient metal and UV.17–19 Among them, transient metal activation, especially iron species, has attracted much attention because iron was the second earth-abundant metal. Bench-scale experiments demonstrated that ferrous-activated persulfate can effectively remove sulfamethoxazole.18 The use of iron particle for activating persulfate is gaining increasing attention. It has been proved that iron particles are better for the activation of persulfate than ferrous ions because Fe(II) is not sustainable in aqueous solution compared to iron particles that corrode in solution while generating iron corrosion products playing also the role of PS activators. In addition, the trace amounts of other metals in iron particles can sustain the corrosion of iron particles and improve the reaction stoichiometric efficiency (RSE).20,21
In comparison with hydrogen peroxide, persulfate can persist longer time in groundwater and soil, which can contribute to the removal of organic pollutants.22 Therefore, persulfate has been used to remediate in situ contaminated groundwater23 and soil.24 However, studies on the application of persulfate for treating wastewater are relatively less.
The objective of this study was to compare the degradation of sulfamethoxazole by Fenton oxidation and Fe(II)-activated persulfate process.
2. Materials and methods
2.1 Chemicals
Hydrogen peroxide and persulfate were obtained from Tianjin Yongda Chemical Reagent Co., LTD, China. Sulfamethoxazole was purchased from Aladdin Company with the purity of higher than 98% (China). Ferrous sulfate was bought from Xilong Scientific, China. Other chemicals were reagent grade unless specially stated.2.2 Sulfamethoxazole degradation experiments
The stock solution of sulfamethoxazole was prepared by adding sulfamethoxazole (200 mg) into de-ionized water (1 L) at room temperature (25 °C), and stirred with magnetic stirrers for overnight to make it completely dissolved. The initial concentration of sulfamethoxazole used in this study was 0.05 mM. Similarly, the stock solution of persulfate was prepared using de-ionized water with concentration of 20 mM. Ferrous stock solution was prepared by dissolving ferrous sulfate into de-ionized water with addition of sulfuric acid. The concentration of ferrous stock solution was 20 mM. During the experiments, quantified ferrous stock solution was added into the glass bottles (150 mL).The sulfamethoxazole degradation by Fenton process was performed in a constant temperature shaker at 25 °C and 160 rpm. The initial pH was adjusted to be 3, and no adjustment of pH was used for all the experiments. Quantified ferrous stock solution, sulfamethoxazole stock solution and hydrogen peroxide were added into the glass bottles to achieve the desired values. The total volume in the glass bottles was 100 mL. Samples were taken at certain intervals. Methanol was used to quench the radical reaction. For the total organic carbon (TOC) measurement, 4 mL of sample was taken, and sodium thiosulfate was used to quench the radical reaction because odium thiosulfate has no effect on the measurement of TOC. All the samples were first passed through 0.45 μm filter membrane, and then stored at 4 °C. The samples were stored less than 5 h before the measurement.
For the degradation of sulfamethoxazole by persulfate, hydrogen peroxide was replaced by persulfate. Other experimental conditions and experimental procedure were the same with the above mentioned.
For the degradation of sulfamethoxazole in the real wastewater, sulfamethoxazole stock solution was prepared using the effluents from the secondary sedimentation tank of a local wastewater treatment plant. The initial pH of the wastewater was 6.8, and it was adjusted to 3 before the experiments. Other experimental conditions and procedure were the same as stated above.
2.3 Analytical methods
The concentration of sulfamethoxazole was determined by high performance liquid chromatography (HPLC) (Agilent 1200 Series, Agilent, USA) with a C18 reversed-phase column (5 μm, 4.6 × 150 mm) and a diode array detector (DAD). The measurement wavelength was set at 275 nm, and the column temperature was 30 °C, the flow rate was maintained at 1 mL min−1. The initial mobile phase consisted of 70% water containing 0.1% formic acid (A) and 30% acetonitrile (B). The level of solvent B increased to 80% within 5 min and maintained for 2 min, and returned to initial settings in 4 min.The HPLC equipped with a photo diode array (PDA) detector coupled to a Shimadzu 2010EV mass spectrometer with ESI ion source (LC-MS) was employed to identify the intermediate compounds. The aforementioned conditions were adopted.
The mineralization of sulfamethoxazole was determined by measuring TOC in aqueous phase using a TOC analyzer (Multi N/C 2100, Jena, Germany).
The concentration of hydrogen peroxide was determined using the spectrophotometric method with titanium oxalate at 400 nm.25 Persulfate concentration was measured using the spectrophotometric method at 352 nm.26 It is noted that the presence of Fe(III) can interfere the determination of persulfate. The ferrous concentration was analyzed with the spectrophotometric method at 510 nm. For the measurement of Fe(III), hydroxylamine hydrochloride was firstly added into the solution to test the total concentration of Fe(II). The difference between the total concentration of Fe(II) and the concentration of Fe(II) without addition of hydroxylamine hydrochloride was denoted as the concentration of Fe(III). To eliminate the error caused by Fe(III), a control solution with known concentration of Fe(III) was prepared. And the absorbance was measured. The actual concentration of persulfate in water was the difference between the absorbance in the presence of Fe(III) and persulfate and the absorbance in the presence of only Fe(III).
3. Results and discussion
3.1 Effect of oxidant concentration on sulfamethoxazole degradation
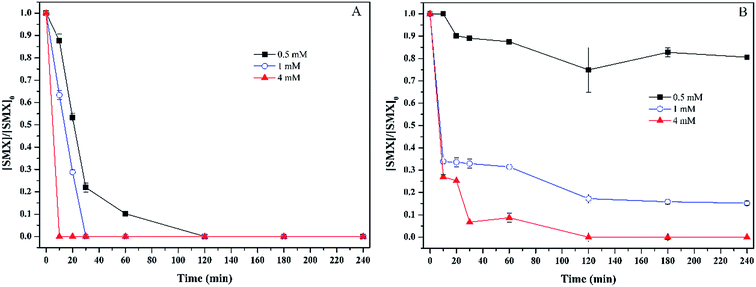
Fig. 1 shows the degradation of sulfamethoxazole with various concentrations of oxidant by Fenton process and persulfate process. For Fenton process, the increase of hydrogen peroxide concentration accelerated the degradation of sulfamethoxazole. When the initial concentration of hydrogen peroxide was 0.5 mM, sulfamethoxazole was totally degraded within 120 min. While the time for completely removing sulfamethoxozole decreased to 30 min and 10 min, respectively, when initial concentration of hydrogen peroxide was 1 mM and 4 mM. For persulfate process, similar degradation trend was observed. When initial concentration of persulfate was 0.5 mM, the degradation of sulfamethoxazole mainly occurred within 20 min. Thereafter, sulfamethoxazole concentration kept almost unchanged, and the removal efficiency of sulfamethoxazole reached 19.4%. When the initial concentration was over 0.5 mM, sulfamethoxazole was degraded very fast within 10 min, and then followed a slow degradation. The removal efficiency was 84.8% and 100%, respectively, for the initial concentration of 1 mM and 4 mM. Previous study has shown that the remove efficiency of sulfamethoxazole was about 80% when the molar ratio of sulfamethoxazole to persulfate was 1![[thin space (1/6-em)]](https://www.rsc.org/images/entities/char_2009.gif) :
:![[thin space (1/6-em)]](https://www.rsc.org/images/entities/char_2009.gif) 80,18 which was lower than our results, which could be attributed to different experimental conditions, including the initial concentration of persulfate, sulfamethoxazole and pH values.
80,18 which was lower than our results, which could be attributed to different experimental conditions, including the initial concentration of persulfate, sulfamethoxazole and pH values.
Fig. 2 shows the removal efficiency of TOC under various conditions. For Fenton process, 4 mM of hydrogen peroxide accelerated the degradation of sulfamethoxazole, but decreased the removal efficiency of TOC, which might be due to recombination of hydroxyl radicals caused by excess hydrogen peroxide. The maximal removal efficiency reached 83% when hydrogen peroxide concentration was 1 mM. For persulfate process, the removal efficiency of TOC increased with the concentration of persulfate. The maximal removal efficiency of TOC achieved 60%. In addition, the decomposition efficiency of oxidants was investigated (Fig. 2). For Fenton process, the decomposition efficiency varied from 94% to 82.5%, and no obvious difference was found between 1 mM and 4 mM hydrogen peroxide. For persulfate process, the decomposition efficiency increased with increase of its initial concentration. And the maximum decomposition efficiency was 62.8%.
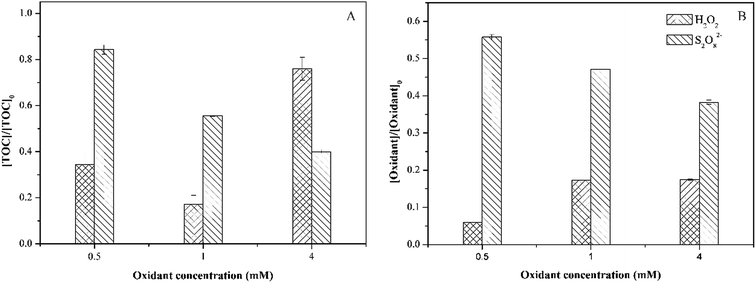 | ||
| Fig. 2 TOC removal efficiency with various concentrations of oxidant and decomposition efficiency of oxidant. | ||
Based on the removal efficiency of sulfamethoxazole and TOC, it is easy to see that Fenton process performed better in removing sulfamethoxazole than persulfate process. The degradation of sulfamethoxazole by Fenton process was faster than that by persulfate process. Moreover, less amounts of hydrogen peroxide was required to reach the complete removal of sulfamethoxazole than persulfate, which might be due to the higher decomposition efficiency of hydrogen peroxide than persulfate. In addition, it is noted that much less Fe(II) was used in Fenton process than that in persulfate process.
3.2 Effect of Fe(II) concentration on sulfamethoxazole degradation
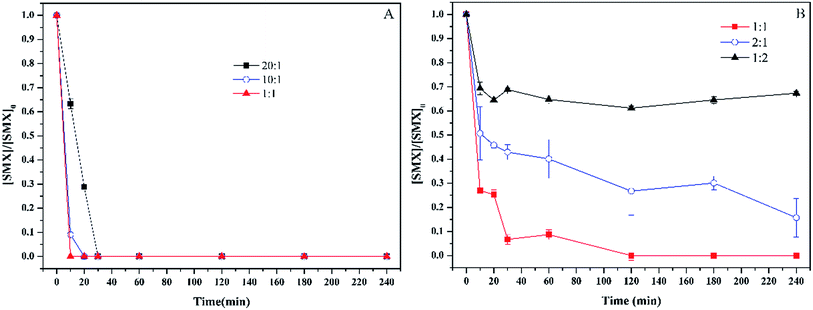
Fe(II) plays a key role in Fenton process and persulfate process. It acts as catalyst for the decomposition of hydrogen peroxide and persulfate,27,28 but it can also act as the scavenger of hydroxyl radicals and sulfate radicals.29,30 Thus, the concentration of Fe(II) has an important effect on the degradation of sulfamethoxazole by Fenton process and persulfate process. To investigate the effect of Fe(II) concentration on sulfamethoxazole degradation, the concentration of hydrogen peroxide and persulfate used in this study was 1 mM and 4 mM, respectively. Fig. 3 depicts the concentration of Fe(II) on the sulfamethoxazole degradation. For Fenton process, the increase of Fe(II) concentration increased the degradation rate of sulfamethoxazole, and sulfamethoxazole was completely decomposed within 10 min when the molar ratio of hydrogen peroxide to Fe(II) was 1![[thin space (1/6-em)]](https://www.rsc.org/images/entities/char_2009.gif) :
:![[thin space (1/6-em)]](https://www.rsc.org/images/entities/char_2009.gif) 1. For persulfate process, the optimal ratio of persulfate to Fe(II) was 1
1. For persulfate process, the optimal ratio of persulfate to Fe(II) was 1![[thin space (1/6-em)]](https://www.rsc.org/images/entities/char_2009.gif) :
:![[thin space (1/6-em)]](https://www.rsc.org/images/entities/char_2009.gif) 1. When the molar ratio was lower or higher, the sulfamethoxazole degradation was delayed. When the molar ratio was 1
1. When the molar ratio was lower or higher, the sulfamethoxazole degradation was delayed. When the molar ratio was 1![[thin space (1/6-em)]](https://www.rsc.org/images/entities/char_2009.gif) :
:![[thin space (1/6-em)]](https://www.rsc.org/images/entities/char_2009.gif) 2, the removal efficiency was only 32.7%, which was attributed to the quenching reaction caused by excess Fe(II).31
2, the removal efficiency was only 32.7%, which was attributed to the quenching reaction caused by excess Fe(II).31
Fig. 4 presents the TOC removal efficiency with the different molar ratio of oxidant to Fe(II). For Fenton process, the increase of Fe(II) decreased TOC removal efficiency, which was different from sulfamethoxazole degradation. The maximal TOC removal efficiency was 83% with the molar ratio of 20![[thin space (1/6-em)]](https://www.rsc.org/images/entities/char_2009.gif) :
:![[thin space (1/6-em)]](https://www.rsc.org/images/entities/char_2009.gif) 1, while TOC removal efficiency decreased to 16.9% with the molar ratio of 1
1, while TOC removal efficiency decreased to 16.9% with the molar ratio of 1![[thin space (1/6-em)]](https://www.rsc.org/images/entities/char_2009.gif) :
:![[thin space (1/6-em)]](https://www.rsc.org/images/entities/char_2009.gif) 1. For persulfate process, TOC removal efficiency was consistent with sulfamethoxazole degradation. The maximal TOC removal efficiency (60%) was obtained with the molar ratio of 1
1. For persulfate process, TOC removal efficiency was consistent with sulfamethoxazole degradation. The maximal TOC removal efficiency (60%) was obtained with the molar ratio of 1![[thin space (1/6-em)]](https://www.rsc.org/images/entities/char_2009.gif) :
:![[thin space (1/6-em)]](https://www.rsc.org/images/entities/char_2009.gif) 1. The removal efficiency of TOC was 52.9% and 47.4%, respectively, when the molar ratio was 2
1. The removal efficiency of TOC was 52.9% and 47.4%, respectively, when the molar ratio was 2![[thin space (1/6-em)]](https://www.rsc.org/images/entities/char_2009.gif) :
:![[thin space (1/6-em)]](https://www.rsc.org/images/entities/char_2009.gif) 1 and 1
1 and 1![[thin space (1/6-em)]](https://www.rsc.org/images/entities/char_2009.gif) :
:![[thin space (1/6-em)]](https://www.rsc.org/images/entities/char_2009.gif) 2.
2.
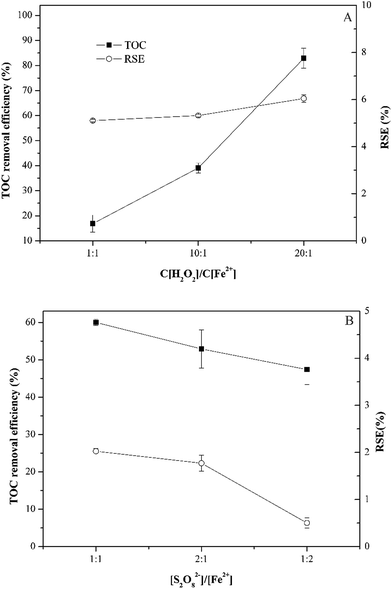 | ||
| Fig. 4 TOC removal efficiency with various molar ratios of oxidant to Fe(II) and RSE (A) Fenton process; (B) persulfate process. | ||
The reaction stoichiometric efficiency (RSE) was calculated. For both processes, TOC increased with the increase of RSE. Previous study has shown a clear opposite trend between TOC and RSE.15 This difference could be due to the presence of ferrous. In Fig. 4, the concentration of oxidant was fixed and the concentration of ferrous changed, while the concentration of oxidant changed.
To further understand the effect of Fe(II) on sulfamethoxazole degradation, the decomposition of hydrogen peroxide and persulfate was analyzed (Fig. 5). For Fenton process, the increase of Fe(II) concentration accelerated the decomposition of hydrogen peroxide, which was consist with degradation of sulfamethoxazole. At the end of experiments, the maximal decomposition efficiency of hydrogen peroxide reached 99% with the molar ratio of 1![[thin space (1/6-em)]](https://www.rsc.org/images/entities/char_2009.gif) :
:![[thin space (1/6-em)]](https://www.rsc.org/images/entities/char_2009.gif) 1. Although the decomposition efficiency of hydrogen peroxide was lower with the molar ratio of 20
1. Although the decomposition efficiency of hydrogen peroxide was lower with the molar ratio of 20![[thin space (1/6-em)]](https://www.rsc.org/images/entities/char_2009.gif) :
:![[thin space (1/6-em)]](https://www.rsc.org/images/entities/char_2009.gif) 1 than that with the molar ratio of 10
1 than that with the molar ratio of 10![[thin space (1/6-em)]](https://www.rsc.org/images/entities/char_2009.gif) :
:![[thin space (1/6-em)]](https://www.rsc.org/images/entities/char_2009.gif) 1 and 1
1 and 1![[thin space (1/6-em)]](https://www.rsc.org/images/entities/char_2009.gif) :
:![[thin space (1/6-em)]](https://www.rsc.org/images/entities/char_2009.gif) 1, the mineralization of sulfamethoxazole was much higher with the molar ratio of 20
1, the mineralization of sulfamethoxazole was much higher with the molar ratio of 20![[thin space (1/6-em)]](https://www.rsc.org/images/entities/char_2009.gif) :
:![[thin space (1/6-em)]](https://www.rsc.org/images/entities/char_2009.gif) 1 than that with the molar ratio of 10
1 than that with the molar ratio of 10![[thin space (1/6-em)]](https://www.rsc.org/images/entities/char_2009.gif) :
:![[thin space (1/6-em)]](https://www.rsc.org/images/entities/char_2009.gif) 1 and 1
1 and 1![[thin space (1/6-em)]](https://www.rsc.org/images/entities/char_2009.gif) :
:![[thin space (1/6-em)]](https://www.rsc.org/images/entities/char_2009.gif) 1. This could be explained by following reasons. The first reason was that the increase of Fe(II) concentration led to the formation of colloidal particles of Fe(OH)3, which could adsorb sulfamethoxazole. But the colloidal complex was still in water. The second reason was that excess Fe(II) could quench hydroxyl radicals, which reduced the amount of hydroxyl radicals reacting with the intermediate compounds of sulfamethoxazole degradation. For sulfate process, the final decomposition efficiency of persulfate was examined. The decomposition efficiency of persulfate was 61.8%, 39.5% and 81.3%, respectively, for the molar ratio of 1
1. This could be explained by following reasons. The first reason was that the increase of Fe(II) concentration led to the formation of colloidal particles of Fe(OH)3, which could adsorb sulfamethoxazole. But the colloidal complex was still in water. The second reason was that excess Fe(II) could quench hydroxyl radicals, which reduced the amount of hydroxyl radicals reacting with the intermediate compounds of sulfamethoxazole degradation. For sulfate process, the final decomposition efficiency of persulfate was examined. The decomposition efficiency of persulfate was 61.8%, 39.5% and 81.3%, respectively, for the molar ratio of 1![[thin space (1/6-em)]](https://www.rsc.org/images/entities/char_2009.gif) :
:![[thin space (1/6-em)]](https://www.rsc.org/images/entities/char_2009.gif) 1, 2
1, 2![[thin space (1/6-em)]](https://www.rsc.org/images/entities/char_2009.gif) :
:![[thin space (1/6-em)]](https://www.rsc.org/images/entities/char_2009.gif) 1 and 1
1 and 1![[thin space (1/6-em)]](https://www.rsc.org/images/entities/char_2009.gif) :
:![[thin space (1/6-em)]](https://www.rsc.org/images/entities/char_2009.gif) 2. The decomposition efficiency increased with Fe(II) concentration. However, the maximal removal efficiencies of sulfamethoxazole and TOC were obtained with the molar ratio of 1
2. The decomposition efficiency increased with Fe(II) concentration. However, the maximal removal efficiencies of sulfamethoxazole and TOC were obtained with the molar ratio of 1![[thin space (1/6-em)]](https://www.rsc.org/images/entities/char_2009.gif) :
:![[thin space (1/6-em)]](https://www.rsc.org/images/entities/char_2009.gif) 1 (Fig. 3 and 4), indicating that the decomposition efficiency of sulfamethoxazole was not positive correlation with the removal and mineralization of sulfamethoxazole. This phenomenon was also observed for the decomposition of hydrogen peroxide.
1 (Fig. 3 and 4), indicating that the decomposition efficiency of sulfamethoxazole was not positive correlation with the removal and mineralization of sulfamethoxazole. This phenomenon was also observed for the decomposition of hydrogen peroxide.
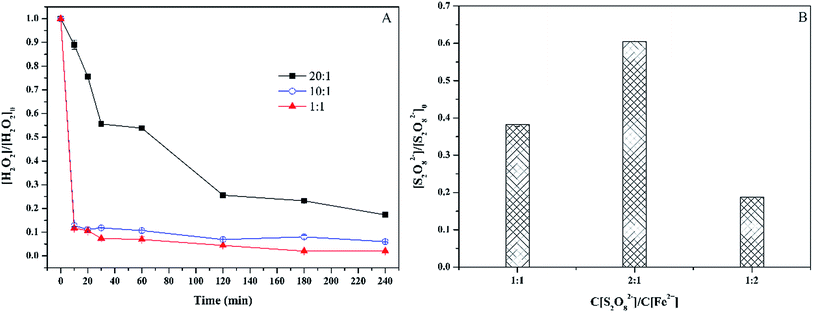 | ||
| Fig. 5 The decomposition efficiency of oxidant with various molar ratios of oxidant to Fe(II) (A) hydrogen peroxide; (B) persulfate. | ||
In terms of the removal and mineralization of sulfamethoxazole and decomposition of oxidant, it could be found that in the wastewater prepared with de-ionized water, Fenton process performed better than persulfate process. The difference for the two processes could be due to the reaction rate of oxidants and Fe(II) and the reaction mechanisms. The reaction rate of Fe(II) with hydrogen peroxide was faster than that with persulfate.31,32 Furthermore, hydroxyl radicals played a major role in removing sulfamethoxazole in Fenton process, while sulfate radicals in persulfate process.
3.3 Degradation pathway of sulfamethoxazole
The intermediate compounds formed during Fenton process and persulfate process were determined to investigate the effect of process on the degradation pathway of sulfamethoxazole. For Fenton process, five intermediate compounds were identified. The two intermediate compounds with m/z of 198 and 129, respectively, might derive from the bond cleavage between sulfur and carbon. The intermediate with m/z of 284 was from the oxidation of amino group in the benzene ring. Then hydroxyl radicals attacked the benzene ring resulting in the formation of intermediate with m/z of 299. For the intermediate with m/z of 284, the bond between benzene ring and sulfur might cleave leading to the formation of the intermediates with m/z of 198 and 143, respectively. Based on the intermediate compounds, the degradation pathway of sulfamethoxazole by Fenton process was proposed (Fig. 6A). Two possible degradation pathways were involved in the sulfamethoxazole degradation during Fenton process. One is the oxidation of amino group in benzene ring due to hydroxyl radicals, and then hydroxylation. Another is that the bond cleavage between sulfur and benzene ring. Previous study has shown that hydroxyl radicals can oxidize the amino group.33 Moreover, the attack of hydroxyl radicals on the benzene ring and isoxazole has been reported.34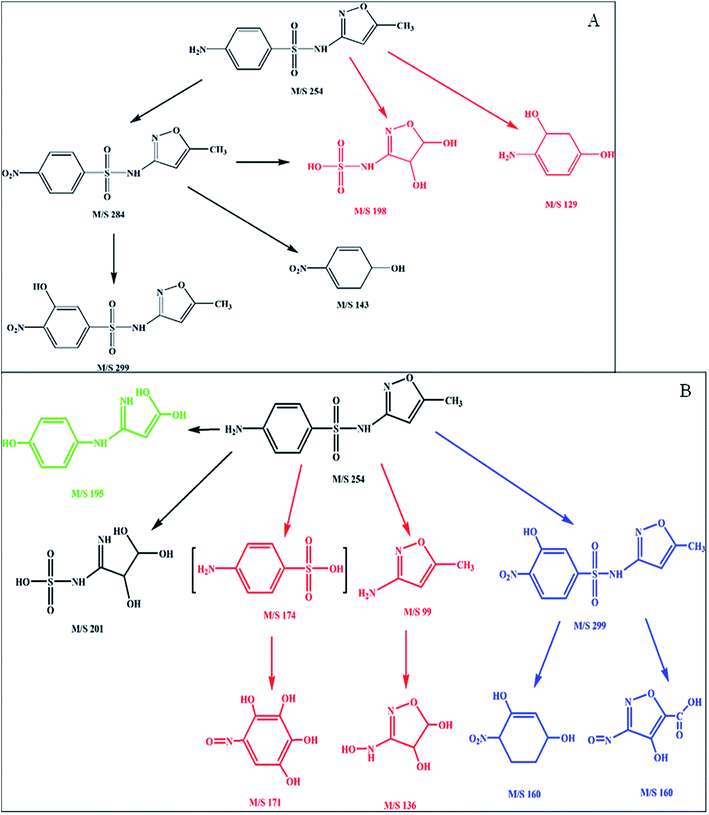 | ||
| Fig. 6 Degradation pathway of sulfamethoxazole during Fenton process and persulfate process (A) Fenton process; (B) persulfate process. | ||
In comparison to Fenton process, more intermediate compounds (eight) were found, indicating that different degradation pathways occurred. Among eight intermediate compounds, the intermediate with m/z of 299 were also found in Fenton process. The intermediate with m/z of 160 might derive from the intermediate with m/z of 299. But the intermediate with m/z of 160 was not observed in Fenton process, which could be due to the fast transformation of the intermediates during Fenton process. In addition, the bond cleavage between sulfur and nitrogen was found, which resulted in the formation of two intermediate compounds with m/z of 198 and 129, respectively. Thereafter, the attack of hydroxyl radicals on the above mentioned intermediate compounds, resulted in the formation of the intermediates with m/z of 171 and 136, respectively. Similar to Fenton process, the bond cleavage between sulfur and benzene ring was also found. Bur the intermediate from the bond cleavage between sulfur and benzene appeared at m/z of 201. Moreover, the desulfuration directly from sulfamethoxazole has been observed, resulting in the formation of the intermediate with m/z of 195. In general, four possible degradation pathways might be involved in the degradation of sulfamethoxazole in persulfate process: (1) the oxidation of amino group and hydroxylation; (2) the bond cleavage between sulfur and nitrogen; (3) the bond cleavage between sulfur and benzene ring; (4) the desulfuration. In addition to the bond cleavage between benzene ring and sulfur, other three degradation mechanisms have been reported in previous studies.31,35
The intermediate compounds formed during Fenton process and persulfate process could be due to the different degradation mechanisms. Hydroxyl radicals formed during Fenton process mainly depends on hydrogen abstraction and hydroxylation to remove organic pollutants,36 while sulfate radicals formed during persulfate process mainly relied on the electron transfer to remove organic pollutants.37
3.4 Effect of wastewater components on sulfamethoxazole degradation
The effluent from the secondary sedimentation tank was taken to investigate the effect of wastewater components on sulfamethoxazole degradation. Based on the above results, the optimal conditions for Fenton process and persulfate process were adopted. The hydrogen peroxide concentration was 1 mM, and the molar ratio of hydrogen peroxide to Fe(II) was 20![[thin space (1/6-em)]](https://www.rsc.org/images/entities/char_2009.gif) :
:![[thin space (1/6-em)]](https://www.rsc.org/images/entities/char_2009.gif) 1. The concentration of persulfate was 4 mM, the molar ratio of persulfate to Fe(II) was 1
1. The concentration of persulfate was 4 mM, the molar ratio of persulfate to Fe(II) was 1![[thin space (1/6-em)]](https://www.rsc.org/images/entities/char_2009.gif) :
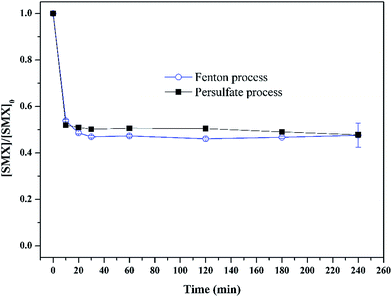
:![[thin space (1/6-em)]](https://www.rsc.org/images/entities/char_2009.gif) 1. The experimental results were shown in Fig. 7. In the real wastewater, Fenton process exhibited similar capacity in removing sulfamethoxazole compared with persulfate radicals. In the wastewater prepared with de-ionized water, Fenton process can totally remove sulfamethoxazole within 30 min at optimal condition. However, in the real wastewater, the removal efficiency was only 52.5%. For persulfate process, the removal efficiency was 100% within 120 min in the wastewater prepared with de-ionized water, while the removal efficiency was only 52.3%, probably because the wastewater components such as organic matter can act as the scavenger of hydroxyl radicals and sulfate radicals, which reduced the amounts of radicals reacting with sulfamethoxazole. In addition, for the real wastewater, the degradation rate for persulfate process was almost equivalent with that in Fenton process. This can be explained by the fact that hydroxyl radicals has less selectivity than sulfate radicals, so more hydroxyl radicals were consumed by the untargeted compounds, such as organic matters.37 Based on the removal efficiency of sulfamethoxazole in the real wastewater, it is concluded that persulfate process could be an alternative for treating the PPCPs-laden wastewater.
1. The experimental results were shown in Fig. 7. In the real wastewater, Fenton process exhibited similar capacity in removing sulfamethoxazole compared with persulfate radicals. In the wastewater prepared with de-ionized water, Fenton process can totally remove sulfamethoxazole within 30 min at optimal condition. However, in the real wastewater, the removal efficiency was only 52.5%. For persulfate process, the removal efficiency was 100% within 120 min in the wastewater prepared with de-ionized water, while the removal efficiency was only 52.3%, probably because the wastewater components such as organic matter can act as the scavenger of hydroxyl radicals and sulfate radicals, which reduced the amounts of radicals reacting with sulfamethoxazole. In addition, for the real wastewater, the degradation rate for persulfate process was almost equivalent with that in Fenton process. This can be explained by the fact that hydroxyl radicals has less selectivity than sulfate radicals, so more hydroxyl radicals were consumed by the untargeted compounds, such as organic matters.37 Based on the removal efficiency of sulfamethoxazole in the real wastewater, it is concluded that persulfate process could be an alternative for treating the PPCPs-laden wastewater.
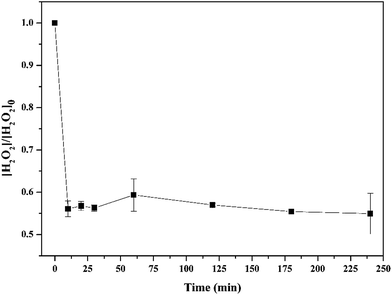
Fig. 8 shows the decomposition of hydrogen peroxide in the real wastewater. In line with the sulfamethoxazole degradation, the decomposition of hydrogen peroxide mainly occurred within 10 min, and then almost kept unchanged. This phenomenon could be explained by the reason that Fe(II) combined with wastewater components, forming colloid or precipitation, which reduced the amounts of Fe(II) reacting with hydrogen peroxide. This indicated that higher Fe(II) concentration might be required for treating the real wastewater. For persulfate process, the final decomposition efficiency of persulfate in the same real wastewater reached 93.1%, which was higher than that obtained in the wastewater prepared with de-ionized water. This could be attributed to the activation of persulfate by organic matters in wastewater.38
The cost evaluation of Fenton and persulfate processes was simply made. The price of hydrogen peroxide, persulfate and ferrous sulfate (heptahydrate) was 1.06 € per g, 0.28 € per g and 0.15 € per g, respectively (based on the price obtained from Sigma Aldrich company). Under the optimal conditions for Fenton and persulfate process in this study, the total cost of Fenton and persulfate process was 0.29 € and 0.47 €, respectively, for removing 0.05 mM sulfamethoxazole. In addition, persulfate is easier to store and transport than hydrogen peroxide. In general, the final costs, including the oxidant, Fe(II), storage and transportation for both Fenton process and persulfate process are comparable.
It is well-known that Fenton and persulfate processes could be inevitably produce iron sludge. However, it is still a problem how to deal with the iron sludge during the two processes. Several strategies could be used to solve this problem. One is reusability of iron sludge as iron source for other treatment process such as electrochemical Fenton-type process.10,39 Another is reusability of iron sludge as adsorbents for phosphate ion.40
4. Conclusions
In this study, the performance of Fenton process and persulfate process for removing sulfamethoxazole was investigated and compared. Fenton process performed better than persulfate process for the removal and mineralization of sulfamethoxazole in the wastewater prepared with de-ionized water. To achieve complete removal of sulfamethoxazole, less amounts of Fe(II) and less time were required for Fenton process in comparison with persulfate process. Different intermediate compounds were detected during Fenton process and persulfate process, indicating that alternative degradation pathway occurred. In the real wastewater, wastewater components had negative effect on sulfamethoxazole degradation by Fenton process and persulfate process. Fenton process and persulfate process exhibited similar removal efficiency of sulfamethoxazole. Moreover, the cost evaluation for Fenton and persulfate processes was simply made. The persulfate process could be an alternative for treating the real wastewater containing PPCPs.Conflicts of interest
There are no conflicts to declare.Acknowledgements
This research was supported by the National Natural Science Foundation of China (51338005) and the Program for Changjiang Scholars and Innovative Research Team in University (IRT-13026) and China Postdoctoral Science Foundation (2017M610920).References
- J. Wang and S. Wang, J. Environ. Manage., 2016, 182, 620–640 CrossRef CAS PubMed.
- J. Wang and L. Chu, Radiat. Phys. Chem., 2016, 125, 56–64 CrossRef CAS.
- A. Kumar and I. Xagoraraki, Sci. Total Environ., 2010, 408, 5972–5989 CrossRef CAS PubMed.
- S. R. Nagulapally, A. Ahmad, A. Henry, G. L. Marchin, L. Zurek and A. Bhandari, Water Environ. Res., 2009, 81, 82–90 CrossRef CAS PubMed.
- Q. Sun, M. Lv, A. Hu, X. Yang and C. P. Yu, J. Hazard. Mater., 2014, 277, 69–75 CrossRef CAS PubMed.
- V. Osorio, J. Sanchís, J. L. Abad, A. Ginebreda, M. Farré, S. Pérez and D. Barceló, J. Hazard. Mater., 2016, 309, 157–164 CrossRef CAS PubMed.
- J. L. Wang and L. J. Xu, Crit. Rev. Environ. Sci. Technol., 2012, 42, 251–325 CrossRef CAS.
- J. Akhtar, N. A. S. Amin and A. Aris, Chem. Eng. J., 2011, 170, 136–144 CrossRef CAS.
- Y. F. Su, G. B. Wang, D. T. F. Kuo, M. L. Chang and Y. H. Shih, Appl. Catal., B, 2016, 186, 184–192 CrossRef CAS.
- J. Bolobajev, E. Kattel, M. Viisimaa, A. Goi, M. Trapido, T. Tenno and N. Dulova, Chem. Eng. J., 2014, 255, 8–13 CrossRef CAS.
- L. Xu and J. Wang, J. Hazard. Mater., 2011, 186, 256–264 CrossRef CAS PubMed.
- S. P. Sun, X. Zeng, C. Li and A. T. Lemley, Chem. Eng. J., 2014, 244, 44–49 CrossRef CAS.
- L. Xu and J. Wang, Environ. Sci. Technol., 2012, 46, 10145 CrossRef CAS PubMed.
- Z. Wan and J. Wang, J. Hazard. Mater., 2016, 324, 653–664 CrossRef PubMed.
- A. Ghauch, H. Baydoun and P. Dermesropian, Chem. Eng. J., 2011, 172, 18–27 CrossRef CAS.
- L. W. Matzek and K. E. Carter, Chemosphere, 2016, 151, 178–188 CrossRef CAS PubMed.
- A. Ghauch, A. M. Tuqan and N. Kibbi, Chem. Eng. J., 2015, 279, 861–873 CrossRef CAS.
- Y. Ji, C. Ferronato, A. Salvador, X. Yang and J. M. Chovelon, Sci. Total Environ., 2014, 472, 800–808 CrossRef CAS PubMed.
- P. Xie, J. Ma, W. Liu, J. Zou, S. Yue, X. Li, M. R. Wiesner and J. Fang, Water Res., 2015, 69, 223–233 CrossRef CAS PubMed.
- S. Naim and A. Ghauch, Chem. Eng. J., 2016, 288, 276–288 CrossRef CAS.
- G. Ayoub and A. Ghauch, Chem. Eng. J., 2014, 256, 280–292 CrossRef CAS.
- Y. Deng and C. M. Ezyske, Water Res., 2011, 45, 6189–6194 CrossRef CAS PubMed.
- H. Liu, T. A. Bruton, F. M. Doyle and D. L. Sedlak, Environ. Sci. Technol., 2011, 48, 10330–10336 CrossRef PubMed.
- B. Ranc, P. Faure, V. Croze and M. O. Simonnot, J. Hazard. Mater., 2016, 312, 280–297 CrossRef CAS PubMed.
- R. M. Sellers, Analyst, 1980, 105, 950–954 RSC.
- C. Liang, C. F. Huang, N. Mohanty and R. M. Kurakalva, Chemosphere, 2008, 73, 1540–1543 CrossRef CAS PubMed.
- A. D. Bokare and W. Choi, J. Hazard. Mater., 2014, 275, 121–135 CrossRef CAS PubMed.
- I. Epold, M. Trapido and N. Dulova, Chem. Eng. J., 2015, 279, 452–462 CrossRef CAS.
- S. Akbari, F. Ghanbari and M. Moradi, Chem. Eng. J., 2016, 294, 298–307 CrossRef CAS.
- H. Peng, W. Zhang, L. Liu and K. Lin, Chem. Eng. J., 2016, 307, 750–755 CrossRef.
- A. Ghauch, G. Ayoub and S. Naim, Chem. Eng. J., 2013, 228, 1168–1181 CrossRef CAS.
- T. Rigg, W. Taylor and J. Weiss, J. Chem. Phys., 1954, 22, 575–577 CrossRef CAS.
- K. O. Hiller, B. Masloch, M. Goebl and K. D. Asmus, J. Am. Chem. Soc., 1981, 103, 327–338 CrossRef.
- A. G. Trovó, R. F. P. Nogueira, A. Agüera, A. R. Fernandez-Alba, C. Sirtori and S. Malato, Water Res., 2009, 43, 3922–3931 CrossRef PubMed.
- C. Qi, X. Liu, C. Lin, X. Zhang, J. Ma, H. Tan and W. Ye, Chem. Eng. J., 2014, 249, 6–14 CrossRef CAS.
- C. Sirtori, A. Agüera, I. Carra and J. A. Sanchéz Pérez, Anal. Bioanal. Chem., 2014, 406, 5323–5337 CrossRef CAS PubMed.
- M. M. Ahmed, S. Barbati, P. Doumenq and S. Chiron, Chem. Eng. J., 2012, 197, 440–447 CrossRef.
- A. L. Teel, F. C. Elloy and R. J. Watts, Chemosphere, 2016, 158, 184–192 CrossRef CAS PubMed.
- N. Kishimoto, T. Kitamura, M. Kato and H. Otsu, Water Res., 2013, 47, 1919–1927 CrossRef CAS PubMed.
- C. A. Jørgensen, H. S. Jensen and S. Egemose, Environ. Technol., 2016, 38, 2185–2192 CrossRef PubMed.
| This journal is © The Royal Society of Chemistry 2017 |

