 Open Access Article
Facile synthesis of CuMAl (M = Cr, Mn, Zn, and Co) with highly dispersed Cu and tailorable surface acidity for efficient 2-methylpyrazine synthesis†
Jindou Hou‡
a,
Wen. Luo‡b,
Shizhong Luob,
Chao Linc,
Ping Liua,
Xuemei Liao *ab,
FangLi Jing*b and
Xiaopeng Li*c
aCollege of Food and Biological Engineering, Xihua University, Chengdu, China. E-mail: xmliao@mail.xhu.edu.cn
bDepartment of Chemical Engineering, Sichuan University, Chengdu, China. E-mail: fangli.jing@scu.edu.cn
cCAS Key Laboratory of Low-Carbon Conversion Science and Engineering, Shanghai Advanced Research Institute, Chinese Academy of Sciences, Shanghai, 201210, China. E-mail: lixp@sari.ac.cn
First published on 16th October 2017
Abstract
Synthesis of 2-methylpyrazine (2-MP) from 1,2-propylene glycol (PG) and ethylenediamine (ED) was investigated in the presence of multifunctional catalytic systems (CuMAl) possessing acidic and metallic functional sites. Catalytic systems were prepared from mixed CuMAl-layered double hydroxides (CuMAl-LDHs, M = Cr, Mn, Zn, and Co) via their thermal decomposition. CuMAl-LDH were prepared from Cu(NO3)2, M(NO3)x and Al(NO3)3 and NaOH/Na2CO3 as a precipitating agent. X-ray diffraction (XRD), N2 adsorption–desorption, temperature-programmed desorption with ammonia (NH3-TPD), N2O chemisorption, transmission electron microscopy (TEM), and high-angle annular dark-field scanning transmission electron microscopy (HAADF-STEM) were used to characterize the physical and chemical properties of the catalysts. The results showed that the nature of the secondary metal M inserted into the LDH structure significantly affected the crystalline structure, the dispersion of copper nanoparticles, and the density of surface acidic sites of the catalysts. The as-prepared CuMAl catalysts displayed promising catalytic performances towards the synthesis of 2-MP. Among them, CuCoAl showed the highest PG conversion (97%) and 2-MP selectivity (55%). These high catalytic activities were found to be associated with the ultra-small Cu nanoparticles (∼2 nm) and high surface acidity (2433 μmol g−1).
1. Introduction
Conversion of biomass into biodiesel has gained importance as an alternative way to utilize renewable biological sources. However, the byproduct of this process (i.e., glycerol) accounts for around 10 wt% of the total bio-diesel production. Since it has no practical use, bio-glycerol is accumulated, thus increasing the storage or waste costs of biodiesel companies. Therefore, the conversion of bio-glycerol into value-added chemicals has received great interest in recent years. 2-Methylpyrazine (2-MP) is an intermediate compound in the synthesis of 2-aminopyrazine, a well-known bacteriostatic and antitubercular drug. Up to now, 2-MP is mostly synthesized via cyclization of ethylenediamine (ED) and 1,2-propylene glycol (PG).1 Since the catalytic synthesis of 2-MP involves cyclization (i.e., dehydration) and dehydrogenation of a piperazine intermediate (Scheme 1), the well-designed catalysts should possess dual (i.e., acidic and metallic) functional active sites. Acidic sites are required to catalyze-cyclization/dehydration of ED and PG, while metallic sites (e.g., copper, nickel, or cobalt, among others) allow dehydrogenation of the piperazine intermediate to 2-MP, with the metal particle size playing a major role in this latter transformation. Therefore, the synthesis of 2-MP can be enhanced upon increasing the number of acidic active sites and decreasing the metal particle size via rational design of a bifunctional catalyst. | ||
| Scheme 1 Reaction pathway for the synthesis of 2-MP from ED and PG.5 | ||
Up to now, various catalysts such as Cu–Zn–Si–O,2,3 Cu–Zn–Al–O,4 Cu–Zn–Cr–Al–O5 and Cu/Co/Ni–Al–O8 have been prepared and used in the synthesis of 2-MP. These Cu-based materials containing alumina as an acidic material were found to be efficient catalysts. However, these catalysts were mostly prepared by conventional methods such as impregnation, co-precipitation and sol–gel techniques, which typically resulted in inhomogeneous agglomeration of copper species, particularly in the case of the impregnation approaches. Usually, increasing the metal loading may result in the formation of large copper particles and thus poor catalytic activity.7
Thermal decomposition of layered double hydroxides (LDHs) is an attractive approach to obtain uniformly distributed metal nanoparticles.7–11 Venugopal et al. prepared LDHs-derived Cu/Zn–Cr–O catalysts and used them in the synthesis of 2,6-dimethylpyrazine. However, the low surface area (50 m2 g−1) and the large CuOx crystalline size (5.8 nm) of the catalyst resulted in a poor glycerol conversion (9%) at 375 °C.9 The formation of the LDH precursor can be significantly altered by changing the secondary metal element (M) in CuMAl catalysts, thereby potentially leading to higher metallic Cu dispersion. However, to date, a systematical study of the impact of M species on the dispersion of Cu in CuMAl catalysts for 2-MP synthesis is lacking in the literature. Moreover, strategies allowing simultaneous control of the surface acidity and active metal dispersion in these catalysts have not been developed yet.
In this work, we investigated a series of M doped (M = Cr, Mn, Zn and Co) CuMAl catalysts derived from LDHs. The catalysts were characterized by a variety of techniques including N2 adsorption–desorption, X-ray diffraction (XRD), H2-temperature-programmed reduction (H2-TPR), NH3-temperature-programmed desorption (NH3-TPD), transmission electron microscopy (TEM), high-angle annular dark-field imaging (HAADF) and scanning transmission electron microscopy (STEM). The effects of the M species on the Cu dispersion and surface acidity of the CuMAl catalysts and their catalytic performance towards the 2-MP synthesis will be unraveled.
2. Experimental
2.1 Catalyst preparation
CuMAl LDH precursors (M = Co, Zn, Cr, and Mn) were prepared by a conventional Na2CO3/NaOH co-precipitation method.7 Typically, 100 mL of a mixed metal solution, containing 1 M of cations (Cu(NO3)2·6H2O, M(NO3)x·yH2O, and Al(NO3)3·9H2O), with the desired molar ratio and 100 mL of a mixed basic solution consisting of NaOH and Na2CO3 with [OH−] = 2.0 mol L−1 and [OH−]/[CO32−] = 2 were simultaneously added dropwise to 100 mL of distilled water under vigorous mechanical stirring. The mixed solution was kept at constant pH (10 ± 0.5). The resulting suspension was aged at 70 °C for 12 h. The resulting solid were obtained thoroughly washed with distilled water, dried at 70 °C for 12 h and further at 120 °C overnight. Finally, the precursors were calcined at 500 °C for 4 h.2.2 Characterizations
All the XRD experiments were performed on a Philips X′ pert PRO powder diffractometer with a graphite-monochromated Cu Kα operating radiation in the Bragg–Brentano parafocusing geometry. The patterns were collected between 10 and 80° (2θ range), with a scanning speed of 10° min−1. The actual element loadings of Cu and M (Co, Zn, Cr, and Mn) were measured by scanning electron microscope (SEM), equipped with energy-dispersive X-ray spectroscopy (EDS). The results in Table S1† showed that the actual Cu loading on CuAl and CuMAl catalysts was 43% and 21 ± 2%, respectively; while the loading amount of M (Co, Zn, Cr, and Mn) was approximately 20%. In general, the actual loading of Cu and M are adjacent to their respectively theoretical values. The specific surface area, total pore volume, and average pore diameter were determined by N2 adsorption–desorption isotherms at −196 °C, using a Quantachrome NOVA 1000e apparatus. Before each measurement, the sample was degassed under vacuum at 300 °C for 3 h. TPR experiments were carried out in a fixed-bed reactor. 50 mg of catalysts were reduced under flowing a 5% H2/N2 (30 mL min−1) from 100 to 900 °C at a rate of 10 °C min−1. The hydrogen consumption was analyzed on-line by a SC-200 gas chromatograph provided with a thermal conductivity detector (TCD). The surface acidity and acid strength of the catalysts were determined by NH3-TPD. All the samples were pre-reduced before evaluating their acidity. 100 mg of the catalysts were introduced into the reactor and the temperature was subsequently increased to 400 °C at 10 °C min−1 under an Ar flow (30 mL min−1). Finally, the catalysts were reduced in situ under a stream of pure H2 (15 mL min−1) at 400 °C for 1 h and subsequently cooled to room temperature (RT) under a flow of Ar (30 mL min−1) to remove the adsorbed H2. A stream of NH3 (25 mL min−1) was subsequently, a flow of Ar (25 mL min−1) was introduced to remove the NH3 physically adsorbed on the catalyst surface. When the signals were stabilized, the temperature was increased from 100 to 700 °C at a rate of 10 °C min−1. Integration of the TPD curves was used to quantify the amount of desorbed NH3. Note that this method is valid for obtaining the total acidity of the samples and it does not allow to obtain the exact nature of the adsorption sites (e.g. Brønsted or Lewis). The dispersion of Cu metal was measured by using dissociative N2O chemisorption. The experiment was carried out in a TPR setup, using the sample mass 100 mg. The amount of the consumed hydrogen in the first prereduction reduction was denoted as X. Subsequently, catalyst beds were purged with He (30 mL min−1) and cooled to 50 °C. Following this 10% N2O/He with the flow rate of 50 mL min−1 was introduced to the catalyst bed at 50 °C for 10 min to perform the dissociative adsorption and corresponding oxidation of Cu surface to Cu2O. In order to remove excess oxidant, the samples were again flushed with a highly pure He (30 mL min−1) and cooled to the temperature at 50 °C under the same atmosphere. As the signal baseline stabilized, the second temperature programmed reduction was performed on the samples. The amount of the consumed hydrogen in the second temperature programmed reduction was denoted as Y. Hence, the dispersion of Cu is calculated as follows: D = 2Y/X.12,13 The morphology of the samples was observed by TEM and it was conducted on an FEI Tecnai F20 transmission electron microscope at an acceleration voltage of 200 kV.2.3 Catalytic test
The catalytic activity tests were carried out at atmospheric pressure in a continuous fixed-bed reactor, 0.5 g of catalyst were loaded in the middle of the tube (Quartz, inner diameter = 8 mm, length = 300 mm). Before reaction, the catalysts were reduced under flowing H2/N2 gas mixture (H2/N2 = 1, molar ratio) at 400 °C for 1 h. The liquid feed, prepared by mixing ED and PG in a mole ratio of 1![[thin space (1/6-em)]](https://www.rsc.org/images/entities/char_2009.gif) :
:![[thin space (1/6-em)]](https://www.rsc.org/images/entities/char_2009.gif) 1, diluted with deionized water (to 50 wt%), was injected into the reactor by a micro pump at 5 mL min−1 and N2 (25 mL min−1) was supplied as a carrier gas. The liquid mixture form the outlet of the reactor (including remained raw materials and products) were collected in an ice-water condenser and subsequently analyzed by gas chromatography (GC-112A) with a capillary column (cross-linked SE-30 gum, 0.33 mm × 30 m) and a flame ionization detector (FID). Different concentrated solutions of standard samples (such as ED, PG, 2-MP, pyrazine, 2-methylpiperazine etc.) were prepared to make the calibration curve for quantification of the chemicals in the products. The identification of the liquid products was done by GC-MS (Agilent Technol. 6890N/Agilent Technol. 5973 Network, Mass Selective Detector).5
1, diluted with deionized water (to 50 wt%), was injected into the reactor by a micro pump at 5 mL min−1 and N2 (25 mL min−1) was supplied as a carrier gas. The liquid mixture form the outlet of the reactor (including remained raw materials and products) were collected in an ice-water condenser and subsequently analyzed by gas chromatography (GC-112A) with a capillary column (cross-linked SE-30 gum, 0.33 mm × 30 m) and a flame ionization detector (FID). Different concentrated solutions of standard samples (such as ED, PG, 2-MP, pyrazine, 2-methylpiperazine etc.) were prepared to make the calibration curve for quantification of the chemicals in the products. The identification of the liquid products was done by GC-MS (Agilent Technol. 6890N/Agilent Technol. 5973 Network, Mass Selective Detector).5
3. Results and discussion
3.1 X-ray diffractions of Cu, M, Al-LDHs and CuMAl oxides
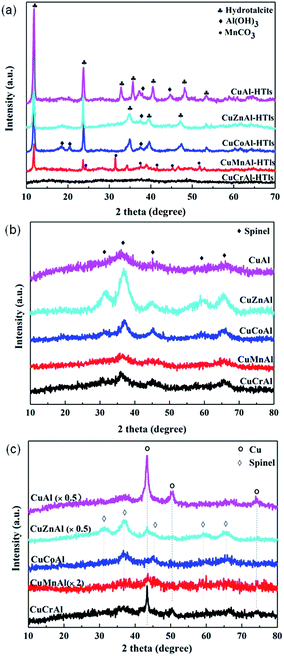
Fig. 1(a) shows the XRD patterns of the Cu, M, Al-LDHs prepared by co-precipitation using NaOH/Na2CO3 as a precipitant agent. The Cu, M, Al-LDHs showed the typical hydrotalcite-like pattern with sharp diffraction peaks at 2θ = 11.8°, 23.6° and 34.9°, corresponding to the reflection of (003), (006) and (012) crystalline planes, respectively. The CuAl, CuZnAl and CuCoAl samples showed an additional diffraction peak at 2θ = 37.5° corresponding to Al(OH)3 (JCPDS file 033-0018). A pure hydrotalcite-like layered double hydroxide phase has been reported to form only for MIII/(MIII + MII) ratios between 0.2 and 0.4.14,15 However, in our case, the Al3+/(Al3+ + M2+ (Cu2+, Co2+, and Zn2+)) ratio was considerable higher (0.67). As previously reported for Co(Zn)–Al LDH samples, excess aluminum segregates to form additional phases such as gibbsite AlO(OH) at 2θ = 37.4°,16,17 instead of incorporating into the hydrotalcite-type structure.7,18 Hence, these results support our results showing the formation of an Al(OH)3 phase from excess Al in the CuAl, CuZnAl, and CuCoAl samples. While for the case of CuCrAl sample neither Al(OH)3 nor hydrotalcite-like crystallite phases (i.e., amorphous CuCrAl) was found, probably due to the low kinetic crystallization constant of Cr3+.19The XRD patterns of the Cu, M, Al-LDHs after being calcined at 500 °C for 4 h are presented in Fig. 1(b). All the patterns showed weak and broad diffraction peaks at 2θ = 37°, 45°, and 65°, corresponding to a spinel phase structure. However, it was extremely difficult to distinguish the exact spinel structure of CuAl2O4, CoAl2O4 and ZnAl2O4 because of their tiny difference in lattice constant.20 As shown in Fig. 1(b), no diffraction peaks corresponding to metal oxides such as CuO were detected. No ZnO and Cr2O3 phases were observed for all the calcined samples, probably because these phases were highly dispersed on the catalyst and/or were present in the form of Cu or Zn spinels.21
Fig. 1(c) shows the XRD patterns of the reduced CuMAl catalysts. The CuAl sample showed peaks at 2θ = 43°, 50° and 74°, which can be ascribed to the (111), (200) and (220) crystalline planes of a metallic Cu phase, respectively.22 This result indicated that the reduction pretreatment at 400 °C for 1 h allowed the reduction of Cu2+ from the CuAl2O4 spinel to form a new phase of Cu0. Similarly, the CuCrAl sample showed a diffraction patterns with only one metallic copper phase. However, CuZnAl sample displayed weaker Cu0 diffractions peaks accompanied with a spinel phase of ZnAl2O4. In case of the CuCoAl sample, no X-ray diffraction peaks corresponding to metallic Cu were observed. Instead, diffraction peaks at 2θ = 36°, 45° and 65° were detected and ascribed to a Co–Al spinel phase. Considering that the copper loading of the catalyst (18%) is above the typical detection limit of the diffractometers, we can therefore conclude that Cu0 was highly dispersed on the catalyst surface. As described below, this result was further confirmed by TEM. The CuMnAl catalyst showed very weak Cu0 diffraction peaks after reduction, and no evidences of the formation of Mn0 and/or MnO were obtained in Fig. 1(c).
N2 adsorption–desorption was utilized to characterize the textural properties of the calcined catalysts prepared from the LDH as precursors. The Brunauer–Emmett–Teller (BET) specific surface area, pore volume and pore diameter are summarized in Table 1. It can been seen that after thermal decomposition under air, all the samples showed high surface areas, ca. centered at 200 m2 g−1 except for CuCrAl, that showed an specific surface area of only 98 m2 g−1. According to the literature,15,23 the mixed oxide samples decomposed from hydrotalcite precursors with similar chemical compositions as our catalysts usually present specific surface areas lower than 100 m2 g−1. For examples, CoAl and CuCuAl mixed oxides prepared by calcination of hydrotalcite precursors at 500 °C showed a surface area of ca. 100 m2 g−1 and 70 m2 g−1, respectively.15,23 However, in our case, we used a Al3+/(Al3+ + M2+ (Cu2+, Co2+ and Zn2+)) ratio (0.67), higher than the nominal M3+/(M3+ + M2+) ratio, which led to the formation of hydrotalcite and Al(OH)3 phases. Thus, Al(OH)3 in hydrotalcite-like compounds decomposed into alumina oxides during the thermal pretreatment, thereby resulting in higher surface areas as compared to the reported LDH compounds.15,23
| Samples | N2 physisorption | NH3-TPD | |||||
|---|---|---|---|---|---|---|---|
| Acid site distribution and density | |||||||
| Surface areaa (m2 g−1) | Pore diameterb (nm) | Pore volumec (cm3 g−1) | α-Weak acidic sitesd (%) | β-Moderate acidic sitesd (%) | γ-Strong acidic sitesd (%) | Desorption amount of NH3 (μmol g−1) | |
| a BET specific area.b Average pore diameter calculated by the Barrett–Joyner–Halenda (BJH) method.c Total pore volumes were obtained at P/P0 = 0.975.d Determined by deconvolution of the NH3-TPD curves. | |||||||
| CuAl | 168 | 7.6 | 0.32 | 19.7 | 62.1 | 18.2 | 1668 |
| CuCoAl | 185 | 5.3 | 0.25 | 43.6 | 56.4 | — | 2433 |
| CuZnAl | 201 | 4.3 | 0.21 | 17.9 | 57.1 | 25.0 | 1742 |
| CuMnAl | 227 | 7.8 | 0.45 | 29.4 | 51.4 | 19.2 | 1454 |
| CuCrAl | 98 | 8.1 | 0.20 | 17.8 | 58.9 | 39.5 | 598 |
3.2 H2-TPR of the calciend CuMAl catalysts
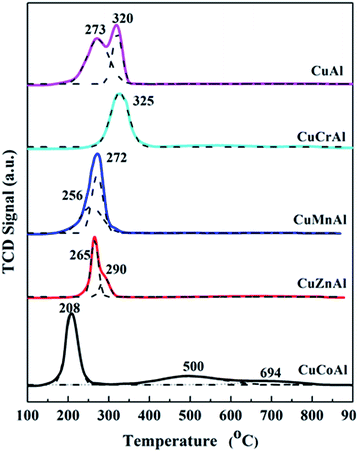
H2-TPR was used to evaluate the reducibility of the calcined samples and the hydrogen consumption of the catalysts, and the results are shown in Fig. 2. Obviously, the nature of the secondary M species strongly influenced the reducibility of the calcined samples. In order to establish the relationship between the reducibility and the catalytic performance, the main overlapped peak was deconvoluted using a Gaussian function. For CuAl sample, there were two overlapped reduction peaks centered at 273 and 320 °C. The peak at low temperature corresponded to the reduction of CuO to Cu0,24–26 while the peak at high temperature was ascribed to the hydrogen consumption process involving the CuAl2O4 spinel in agreement with the results reported by Faungnawakij et al.27–29 Similarly, the CuZnAl catalyst showed two overlapped reduction peaks at slightly lower temperatures as compared to the CuAl sample (265 and 290 °C), and also attributed to the reduction of CuO and CuAl2O4, respectively.30,31 However, it is worth noting that, compared to the CuAl catalyst, the reduction peak of CuZnAl at high temperatures showed a significantly lower area, thereby indicating the formation of a ZnAl2O4 phase, as shown in Fig. 1(c). When Mn was co-precipitated with CuAl, two overlapped reduction peaks were observed at 256 and 272 °C, although their area was lower as compared to those of the CuAl and CuZnAl samples. In this case, the hydrogen consumption process at low temperature can be ascribed to the reduction of CuO and CuAl2O4, while the one at high temperature can be produced by the following reduction process: Mn2O3 → Mn3O4 → MnO.27,32In case of the CuCoAl catalyst, the reduction was centered at a very low temperature of ca. 208 °C. This enhanced CuO reduction compared to the other CuMAl catalysts indicated that the CuO nanoparticle might be highly dispersed on the mixed metal oxides or the presence of cobalt promoting CuO reduction due to their strong interaction. The broad high temperature peak from 400 to 800 °C can be attributed to the reduction of the Co–Al spinel phase.23,33–35 With respect to the CuCrAl sample, the hydrogen consumption peak at 200–400 °C could be ascribed to the reduction of CuCrO4 to Cu and Cr2O3. In general, the nature of M element played a major role on the reducibility of the calcined CuMAl catalysts. Except for the sample CuCrAl, the other secondary M metals promoted the reducibility of CuO to a lower reduction temperature compared to that of CuAl catalyst. According to the TPR profiles, the reducibility of the calcined CuMAl catalysts followed the trend CuCoAl > CuMnAl > CuZnAl > CuAl > CuCrAl.
3.3 NH3-TPD of reduced CuMAl catalysts
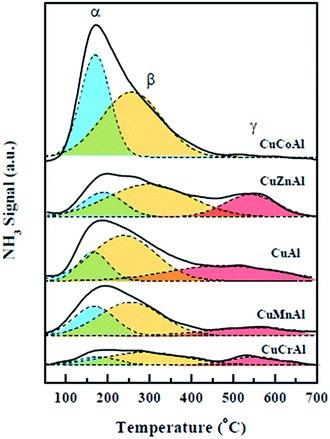
Since the acidic properties of the catalysts also play a key role in catalyzing the cyclization/dehydration reaction to form the important intermediate 2-methylpiperazine, TPD experiments using NH3 as a base probe molecule were performed for all the reduced samples (Fig. 3). A wide distribution of acidic surface sites was obtained as revealed by the large temperature range of the desorption peaks. Three NH3 desorption peaks at 170–187, 254–293 and 539–551 °C were observed for the CuMAl catalysts (M = Zn, Mn, and Cr), whereas the CuCoAl sample, only showed two desorption peaks at 170 and 257 °C. NH3 typically adsorbs on the surface of the CuMAl catalysts over two kinds of acid sites namely, Brønsted acid (low temperature) and Lewis acid (high temperature) sites. The Brønsted acid sites correspond to NH3 interacting with surface hydroxyl group, while the Lewis acid sites correspond to the nitrogen atoms interacting with the unsaturated electrons from the metal oxide.34,35 Hence, as shown in Fig. 3, the desorption peak at 180 °C was ascribed to NH3 desorbed from Brønsted sites, while the desorption peak at 270 °C can be attributed to NH3 desorbed from Lewis Al3+–O2− sites. Desorption of NH3 at high temperatures (above 500 °C) can be ascribed to NH3 adsorbed on strong Lewis acid sites (i.e., tetrahedral Al3+, from the amorphous AlxOy phase formed upon excess amount of Al32). In the case of CuCoAl, NH3 was desorbed below 450 °C probably because of the presence of excess Al forming an octahedral Co–Al spinel (not decomposed after reduction at 400 °C) providing strong Lewis acid sites for NH3 adsorption. In contrast, the CuZnAl catalyst, despite forming a Zn–Al spinel phase, showed Zn2+ remaining sites with strong Lewis acid properties. Therefore, the CuZnAl exhibited a strong NH3 desorption peak at high temperatures 539–551 °C.3.4 Catalytic properties of CuMAl catalysts
The catalytic performances of the reduced CuMAl catalysts towards the synthesis of 2-MP as a function of temperature are shown in Fig. 4. The conversion of PG and ED gradually increased with temperature. Since the synthesis of 2-MP is an endothermic reaction and therefore the temperature positively affected the reaction rate. However, there were some differences in the selectivity towards 2-MP. The selectivity of 2-MP increased with temperature, reaching a maximum value at 400 °C and slightly decreasing thereafter (420 °C, Fig. 4), probably due to the formation of polymerization by-products resulting from side reactions promoted at high temperatures. The secondary M species in CuMAl catalysts played a major role in the catalytic performances of these materials. Among all the samples, CuCoAl provided the highest PG and EG conversions in values of 63% and 82% at temperature of 340 °C, respectively. In contrast, CuCrAl displayed the poorest catalytic performance (i.e., PG and ED conversions lower than 40% and a 2-MP selectivity of 10–20% at 420 °C). Moreover, CuAl, CuMnAl, and CuZnAl catalysts showed nearly similar PG and ED conversions and these values were higher than that of CuCrAl, but lower than that of CuCoAl.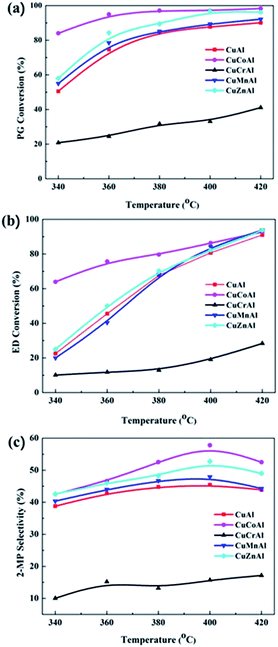 | ||
| Fig. 4 Catalytic performance of the CuMAl catalysts in the synthesis of 2-MP at different temperatures. | ||
The synthesis of 2-MP via cyclization of ED and PG involves two steps namely, dehydration and dehydrogenation. Several groups have proposed a mechanism for the formation of 2-MP over mixed oxide catalysts.36–38 As reported by Basak et al.,37 the surface acidity originated from the metal oxides catalyzes the dehydration reaction, while the metal sites catalyze the dehydrogenation of the 2-methylpiperazine intermediate into 2-MP. Hence, according to the plots shown in Fig. 4, the acid site distribution and density exposed on the catalyst surface was calculated and summarized in Table 1. The acid site density of the CuMAl catalysts as a function of the conversion of ED and PG at 360 °C is shown in Fig. 5. The density of acidic sites of the catalyst exhibited a good linear relationship with the conversion of EG and PG, thereby indicating that the density of acidic sites positively affected the conversion of reactants. In our case, CuCoAl showed the highest density of acidic sites (2433 μmol g−1), and thus dehydration of ED and PG was favored on acidic sites present on the catalyst surface, which matched with the highest catalytic performance of this catalyst at 360 °C. On the contrary, CuCrAl catalyst exhibited the lowest PG and ED conversion due to its lowest surface acidity (598 μmol g−1). This result was consistent with the aforementioned mechanism of the synthesis of 2-MP.
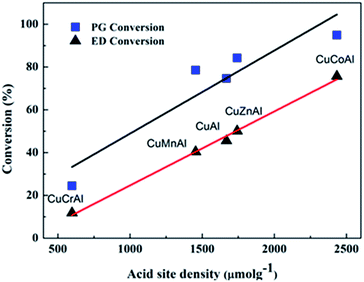 | ||
| Fig. 5 Acidic site density versus conversion of ED and PG for the CuMAl catalysts during the synthesis of 2-MP (reaction conditions: 0.5 g of catalysts, temperature = 360 °C). | ||
The dehydrogenation has a strong dependence on the Cu dispersion. The TPR results provided circumstantial evidence that CuCoAl may possess the highest Cu dispersion among all the CuMAl samples. Therefore, N2O chemisorption experiment was further conducted to verify the Cu dispersion. As shown in Fig. 6, the CuCoAl sample exhibited the highest dispersion of copper species, which was as high as 73%, and that the dispersion of Cu particle increased in the following order: CuCoAl > CuMnAl > CuAl > CuZnAl > CuCrAl. It is generally acknowledged that higher dispersion of metal corresponds to its smaller particle size.38,39 Similarly, we correlated the Cu dispersion of the reduced CuMAl catalysts with the selectivity towards 2-MP. As shown in Fig. 6, the selectivity to 2-MP followed a positive linear relationship with Cu dispersion. As discussed above, the dispersion of metal has a major-effect on the dehydrogenation of the 2-methylpiperazine intermediate into 2-MP. The higher Cu dispersion led to the higher 2-methylpiperazine dehydrogenation activities and 2-MP yield (Fig. S1a and b†). In general, among the investigated samples, CuCoAl with the highest Cu dispersion and largest acidic site density, and this material therefore, displayed the highest selectivity to 2-MP (ca. 55%), in contrast, CuCrAl only showed 15% of 2-MP selectivity. Interestingly, CuZnAl showed higher selectivity to 2-MP as compared to the rest of samples, which was probably produced by the high selectivity of ZnO to the dehydrogenation reaction.6 Furthermore, the TOF of the catalysts in Fig. 7 showed that CuCoAl catalyst exhibited the highest TOF, and decreased values can be found on CuAl, CuCrAl, CuZnAl, and CuMnAl samples. Among them, CuCrAl samples showed the lowest TOF. This trend is similar as the trends of PG and ED conversion, as well as 2-MP yield on these catalysts, indicating that CuCoAl has the highest intrinsic catalytic performances.
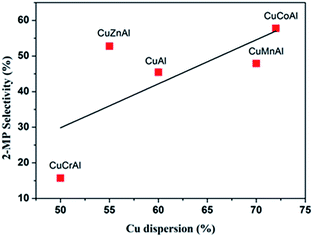 | ||
| Fig. 6 2-MP selectivity as a function of the Cu dispersion for the reduced CuMAl catalysts (reaction conditions: 0.5 g of catalysts, temperature = 400 °C). | ||
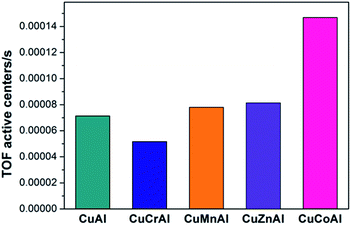 | ||
| Fig. 7 TOF comparison over CuMAl catalysts (reaction conditions, 0.5 g catalyst, temperature 340 °C). | ||
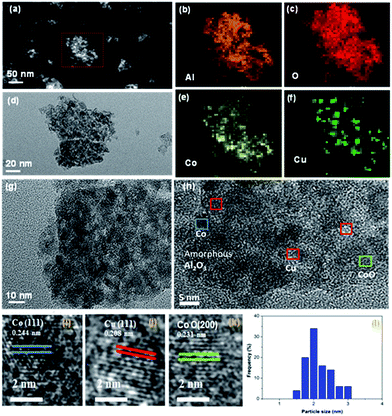
To further confirm the existence of tiny Cu nanoparticles in CuCoAl, micro-structure characterization by STEM-HAADF and TEM were conducted. Fig. 8(a) showed the STEM-HAADF and TEM images of a reduced CuCoAl with porous feature. The corresponding EDS mapping in Fig. 8(b–d) revealed the relatively homogeneous distribution of Al and O. Co also distributed throughout the particle, with slightly higher concentration in the particle center. By contrast, Cu metal existed as nanosized domain. High resolution TEM provided more structure details. According to the deduced lattice distance values from the metal particles (Fig. 8(j)), we confirmed the formation of metallic Cu. Interestingly, the reduction of the calcined CuCoAl sample resulted in the presence of metallic Co and CoO nanoparticles (Fig. 7(i and k)). The calculated average particle size of Cu nanoparticles based on HRTEM characterization was as small as ∼2 nm.
4. Conclusions
In this work, well-dispersed copper over CuMAl as the bi-functional catalysts (M = Cr, Mn, Zn, and Co) derived from LDH compounds were prepared and applied in the synthesis of 2-MP. The combined characterization results revealed that the nature of M metal remarkably influenced the Cu dispersion and surface acidity of the catalysts, and thus played a major role on the catalytic performance compared with the CuAl metal oxides. Among them, CuCoAl catalyst displayed the highest 2-MP yield (56%) at 400 °C, whereas CuCrAl sample exhibited the lowest 2-MP yield (6%) at 400 °C. The explanation for the higher catalytic behaviors achieved over CuCoAl catalyst with compared to the other samples can be ascribed to (i) more surface acid density (2433 μmol g−1), which facilitated to cyclization/dehydration of ED and PG, (ii) highly dispersed Cu (∼2 nm) favored to dehydrogenation of the piperazine intermediate into 2-MP. Our results offer new hints for rational design of bifunctional catalyst for 2-MP synthesis.Conflicts of interest
There are no conflicts to declare.Acknowledgements
We gratefully acknowledge financial support from the spring plan of the Ministry of Education (Z2016137), the Sichuan Education Department (17ZB0410), the Open Research Subject of key laboratory (Research Base) of automotive engineering (szjj2017-075), Science & Technology Department of Sichuan Province (2016GZ0027, 2015GZ0127) and the opening project of State key laboratory of Polymer Materials Engineering (Sichuan University, Grant No. sklpme2016-4-35). P. Liu acknowledges the Open Research Subject of key laboratory (Research Base) of food biotechnology (szjj2013-046). X. Li and X. Liao acknowledge the financial support from the National Natural Science Foundation of China (NSFC, No. 21403280, 21706216).References
- V. Akula, R. Sarkari, A. Chatla, K. Vankudoth and K. K. Mandari, Appl. Catal., A, 2012, 441, 108–118 CrossRef.
- I. Park, J. Lee, Y. Rhee, Y. Han and H. Kim, Appl. Catal., A, 2003, 253, 249–255 CrossRef CAS.
- I. Park, Y. Rhee, J. Lee, Y. H. Han, J. Jeon and H. Kim, Res. Chem. Intermed., 2003, 29, 575–587 CrossRef CAS.
- F. L. Jing, W. Chu, Y. Y. Zhang, Y. Q. Chen and S. Z. Luo, Chin. Chem. Lett., 2008, 19, 752–755 CrossRef CAS.
- F. L. Jing, Y. Y. Zhang, S. Z. Luo, W. Chu, H. Zhang and X. Y. Shi, J. Chem. Sci., 2010, 122, 621–630 CrossRef CAS.
- F. L. Jing, Y. Y. Zhang, S. Z. Luo, W. Chu and W. Z. Qian, Appl. Clay Sci., 2010, 48, 203–207 CrossRef CAS.
- W. Luo, F. L. Jing, X. P. Yu, S. Sun, S. Z. Luo and W. Chu, Catal. Lett., 2012, 142, 492–500 CrossRef CAS.
- R. Sarkari, C. Anjaneyulu, V. Krishna, R. Kishore, M. Sudhakar and A. Venugopal, Catal. Commun., 2011, 12, 1067–1070 CrossRef CAS.
- A. Venugopal, R. Sarkari, C. Anjaneyulu, V. Krishna, M. K. Kumar, N. Narender and A. H. Padmasri, Appl. Catal., A, 2014, 469, 398–409 CrossRef CAS.
- V. Krishna, S. N. Kumar, S. Reema, A. H. Padmasri, K. V. R. Chary and A. Venugopal, Appl. Catal., A, 2014, 488, 275–284 CrossRef CAS.
- C. A. Antonyraj, M. Gandhi and S. Kannan, Ind. Eng. Chem. Res., 2010, 49, 6020–6026 CrossRef CAS.
- V. Dasireddy and B. Likozar, Fuel, 2017, 196, 325–335 CrossRef CAS.
- S. Hajduk, V. Dasireddy, B. Likozar, G. Drazi and Z. Orel, Appl. Catal., B, 2017, 211, 57–67 CrossRef CAS.
- S. Velu, K. Suzuki, S. Hashimoto, N. Satoh, F. Ohashi and S. Tomura, J. Mater. Chem., 2001, 11, 2049–2060 RSC.
- M. Gabrovsk, R. Edreva-Kardjieva, K. Tenchev, P. Tzvetkov, A. Spojakina and L. Petrov, Appl. Catal., A, 2011, 399, 242–251 CrossRef.
- T. Tsuchida and N. Ichikawa, React. Solids, 1989, 7, 207–217 CrossRef CAS.
- K. J. D. Mackenzie, J. Temuuijin and K. Okada, Thermochim. Acta, 1999, 327, 103–108 CrossRef CAS.
- M. E. Perez-Bernal, R. J. Ruano-Casero, F. Benito and V. Rives, J. Solid State Chem., 2009, 182, 1593–1601 CrossRef CAS.
- C. M. S. Polato, C. A. Henriques, A. C. C. Rodrigues and J. L. F. Monteiro, Catal. Today, 2008, 133–135, 534–540 CrossRef CAS.
- J. Cheng, J. Yu, X. Wang, L. Li, J. Li and Z. Hao, Energy Fuels, 2008, 22, 2131–2137 CrossRef CAS.
- E. L. Rodrigues, A. J. Marchi, C. R. Apesteguia and J. M. C. Bueno, Appl. Catal., A, 2005, 294, 197–207 CrossRef CAS.
- B. R. Strohmeier, D. E. Levden, R. S. Field and D. M. Hercules, J. Catal., 1985, 94, 514–530 CrossRef CAS.
- V. Rives, A. Dubey and S. Kannan, Phys. Chem. Chem. Phys., 2001, 3, 4826–4836 RSC.
- M. N. Barroso, M. F. Gomez, J. A. Gamboa, L. A. Arrua and M. C. J. Abelloa, Phys. Chem. Solids, 2006, 67, 1583–1589 CrossRef CAS.
- A. J. Marchi, D. A. Gordo, A. F. Trasarti and C. R. Apesteguía, Appl. Catal., A, 2003, 249, 53–67 CrossRef CAS.
- Y. Tanaka, T. Utaka, R. Kikuchi, T. Takeguchi, K. Sasaki and K. Eguchi, J. Catal., 2003, 215, 271–278 CrossRef CAS.
- K. Faungnawakij, N. Shimoda, T. Fukunaga, R. Kikuchi and K. Eguchi, Appl. Catal., A, 2008, 341, 139–145 CrossRef CAS.
- S. Tanasoi, N. Tanchoux, A. Urdă and I. C. Marcu, Appl. Catal., A, 2009, 363, 135–142 CrossRef CAS.
- Q. Song, W. Liu, C. D. Bohn, R. N. Harper, E. S. Scott and S. A. Dennis, Energy Environ. Sci., 2013, 6, 288–298 CAS.
- S. Zhang, Q. Liu, G. Fan and F. Li, Catal. Lett., 2012, 142, 1121–1127 CrossRef CAS.
- J. Beiramar, A. Constant and A. Khodakov, ChemcatChem, 2014, 6, 1788–1793 CrossRef CAS.
- Y. Tanaka, T. Takeguchi, R. Kikuchi and K. Eguchi, Appl. Catal., A, 2005, 279, 59–66 CrossRef CAS.
- S. Velu, K. Suzuki and T. Osaki, Catal. Lett., 2000, 69, 43–50 CrossRef CAS.
- C. Rudolf, B. Dragoi, A. Ungureanu, A. Chirieac, S. Royer, A. Nastro and E. Dumitriu, Catal. Sci. Technol., 2014, 1, 179–189 Search PubMed.
- L. J. I. Coleman, W. Epling, R. R. Hudgins and E. Croiset, Appl. Catal., A, 2009, 363, 52–63 CrossRef CAS.
- A. Auroux and A. J. Gervasini, J. Phys. Chem., 1990, 94, 6371–6379 CrossRef CAS.
- J. Basak, N. Hardia, S. Saxena, R. Dixit, R. Dwivedi, S. Bhadauria and R. Prasad, Ind. Eng. Chem. Res., 2007, 46, 7039–7044 CrossRef CAS.
- A. S. Bennici, Appl. Catal., A, 2005, 281, 199–205 CrossRef.
- Z. Yuan, L. Wang, J. Wang, S. Xia, P. Chen, Z. Hou and X. Zheng, Appl. Catal., B, 2011, 101, 431–440 CrossRef CAS.
Footnotes |
| † Electronic supplementary information (ESI) available. See DOI: 10.1039/c7ra08349a |
| ‡ Both authors contributed equally. |
| This journal is © The Royal Society of Chemistry 2017 |

