 Open Access Article
Creative Commons Attribution 3.0 Unported Licence
Dynamics of a water droplet on a hydrophobic inclined surface: influence of droplet size and surface inclination angle on droplet rolling
Bekir Sami Yilbas *ab,
Abudllah Al-Sharafia,
Haider Alia and
Nasser Al-Aqeelia
aMechanical Engineering Department, King Fahd University of Petroleum & Minerals, Dhahran, Saudi Arabia. E-mail: bsyilbas@kfupm.edu.sa
bCenter of Excellence in Renewable Energy, King Fahd University of Petroleum & Minerals, Dhahran, Saudi Arabia
First published on 17th October 2017
Abstract
An understanding of the dynamic motion of a water droplet is critical to reduce the effort required to remove dust particles from such surfaces. In line with self-cleaning applications, the wobbling and geometric variations of a rolling droplet were experimentally assessed for various droplet sizes. Furthermore, the internal fluidity of a rolling droplet was numerically predicted. The findings revealed that the rotational Bond number influenced the droplet wobbling due to adhesion force variations during rolling. Small-sized droplets, which were comparable to the capillary length, resulted in higher rotational speeds than those of larger-sized droplets. The ability to alter the rolling characteristics of droplets on inclined hydrophobic surfaces could address the limitations of self-cleaning surfaces and has implications for efficiency enhancements in solar energy devices.
Introduction
Recent climate changes in the Middle East have initiated dust storms, particularly in the Kingdom of Saudi Arabia.1 Dust settlements on surfaces both during and after dust storms reduce the efficiency of solar energy harvesting devices, such as photo voltaic panels.2 Considerable effort is required to clean these surfaces because of the large surface area of the devices and the scarcity of clean water in urban areas. Water droplets on inclined hydrophobic surfaces can reduce the effort required to remove dust particles from the surfaces. The dynamic motion of a water droplet remains critical for removing dust particles on hydrophobic surfaces. The contact line dynamics of the droplet govern droplet behavior by either rolling off or sliding on the surface. A droplet rolling off a surface is mainly associated with the contact angle hysteresis and inclination angle of the surface. In hydrophobic surfaces with high-contact angle hysteresis, the adhesion force remains high and the droplet attaches at the surface, even at high inclination angles.3 The droplet attachment is due to the force balance along the surface inclination. The sum of the adhesion force, which is related to πrσ(cos![[thin space (1/6-em)]](https://www.rsc.org/images/entities/char_2009.gif) θR − cos
θR − cos![[thin space (1/6-em)]](https://www.rsc.org/images/entities/char_2009.gif) θA) (where r is the contact area radius, θR is the receding (uphill) angle of the droplet, θA is the advancing (downhill) angle of the droplet, and σ is the surface tension of the droplet liquid), and the shear force, which is πr2μdV/dn (where μ is the fluid viscosity and dV/dn is the rate of fluid strain normal to the contact surface), becomes larger than the gravitational force, which is associated with mg
θA) (where r is the contact area radius, θR is the receding (uphill) angle of the droplet, θA is the advancing (downhill) angle of the droplet, and σ is the surface tension of the droplet liquid), and the shear force, which is πr2μdV/dn (where μ is the fluid viscosity and dV/dn is the rate of fluid strain normal to the contact surface), becomes larger than the gravitational force, which is associated with mg![[thin space (1/6-em)]](https://www.rsc.org/images/entities/char_2009.gif) sin
sin![[thin space (1/6-em)]](https://www.rsc.org/images/entities/char_2009.gif) δ (where m is the droplet mass, g is the acceleration due to gravity, and δ is the inclination angle of the surface). When the surface is inclined, a flow field is generated in the droplet and a shear stress is formed at the interface of the contact area, which generates a frictional force at the interface of the droplet and the solid surface. In contrast, when the gravitational force overcomes the adhesion and frictional forces, the droplet movement on the inclined surface is influenced by droplet bulging/puddling due to a gravitational effect (Aussillous & Quéré, 2004). In this case, the dynamic motion of the droplet is governed by the rotational and sliding modes of the droplet movement. However, the droplet size is critical for the bulging and forming of the droplet shape. That is, the capillarity length (
δ (where m is the droplet mass, g is the acceleration due to gravity, and δ is the inclination angle of the surface). When the surface is inclined, a flow field is generated in the droplet and a shear stress is formed at the interface of the contact area, which generates a frictional force at the interface of the droplet and the solid surface. In contrast, when the gravitational force overcomes the adhesion and frictional forces, the droplet movement on the inclined surface is influenced by droplet bulging/puddling due to a gravitational effect (Aussillous & Quéré, 2004). In this case, the dynamic motion of the droplet is governed by the rotational and sliding modes of the droplet movement. However, the droplet size is critical for the bulging and forming of the droplet shape. That is, the capillarity length ( , where κ−1 is the capillarity length, σ is the surface tension, ρ is the density, and g is the acceleration due to gravity) associated with the droplet becomes important. A droplet diameter that is less than the capillarity length will remain as a spherical droplet during its motion on the inclined surface. Droplets with a larger diameter than the capillarity length will undergo bulging and form a puddle. The puddle size may be determined by the force balance between the capillarity and gravitational forces. The droplet puddle thickness (h) is related to
  , where θ is the droplet contact angle.4 If a surface has a low contact angle hysteresis, a droplet with a larger diameter than the capillarity length may roll and slide because of the interfacial friction on the inclined hydrophobic surface. The droplet center of mass changes during rolling on a hydrophobic surface because of the adhesion force at the droplet-solid surface interface, i.e., the droplet's advancing and receding angles change during droplet rolling while droplet volume remains constant. This change in the center of mass gives rise to droplet wobbling, which is a transient change in the droplet height during rolling. Consequently, the wobbling affects the internal fluidity of the droplet via droplet shape variations during rolling, which changes the rotational characteristics of the droplet. Therefore, an investigation of the droplet motion on an inclined hydrophobic surface with low contact angle hysteresis becomes essential.
Considerable research studies were carried out to examine droplet dynamics on hydrophobic surfaces. The rolling and slipping motion of a water droplet between two parallel plates coated with fluoroalkylsilanes was studied by Suzuki et al.5 They demonstrated that the water droplets accelerated by a rolling and slipping motion on fluoroalkylsilane coatings and the acceleration was dominated by the rolling. The shape of the droplet, solid–liquid molecular interaction, and the gravitational force were found to be important factors determining the sliding mode on a solid surface. The relation between advancing, receding, and young contact angles was presented by Tadmor.6 He indicated that different line energies were required, which depend on the three interfacial energies, and the drop's volume in order to keep a certain maximal hysteresis between advancing and receding angles. A new method for the measurement of apparent contact angles at the global energy minimum on real surfaces was developed by Meiron et al.7 They demonstrated that the ideal contact angles of all surfaces, as calculated from the Wenzel equation using the measured apparent contact angles, came out to be practically identical. The role of the line tension in the stability of Cassie wetting-state was investigated by Bormashenko and Whyman.8 The findings revealed that the line tension was regarded as a weak effect, it might be essential for stabilizing (destabilizing) the Cassie wetting. The effect might be crucial to understanding the stability of the Cassie-like wetting of inherently hydrophilic nanoscaled reliefs. A comprehensive review on hydrophilic and superhydrophilic surfaces and materials was presented by Drelich et al.9 They considered major definitions of hydrophilic surfaces used in the past prior to introducing the physics behind the superhydrophilic phenomenon and make recommendation on defining superhydrophilic surfaces and coatings. A study of surface morphology of ZnO nail beds and water droplet roll-off was carried out by Sutha et al.10 They developed an analytical model incorporating the topographical (diameter, density of nanorods and solid area fraction) and droplet parameters (surface tension, mass and volume) to comprehend the mechanism governing the extremely low roll-off angle of ZnO nanorods based superhydrophobic surface. The particle suspension in rolling-sliding soft contacts was examined by Yakubov et al.11 They showed that the suspensions behaved as a continuum in the elastohydrodynamic regime when the film thickness was greater than the particle diameter. A study pertinent to dynamics of water droplets on the line-patterned hydrophobic surfaces was carried out by Song et al.12 They indicated that the total retention force decreased with the decreasing width ratio of silane on the hydrophobic surface. The results showed that the sliding acceleration of water droplets on a hydrophobic surface depended both on chemical composition and patterning structure. The internal fluidity of a sessile droplet on the hydrophilic and the hydrophobic surfaces was studied by Al-Sharafi et al.13 They showed that two counter rotating circulation cells were formed inside the droplet for the case of the hydrophilic surface and this behavior was attributed to the combine effect of the Marangoni and the buoyancy forces on the flow field. The influence of thermalcapillary and buoyant forces on flow characteristics in a droplet on hydrophobic surface was investigated by Al-Sharafi et al.14 They simulated the flow field inside the droplet under the thermal load and indicated that the flow pattern inside the droplet was highly sensitive to the droplet contact angle. A study on the adhesion energy of the liquid droplets on a hydrophobic flat surface was carried out by Kim et al.15 They developed a new method predicting the adhesion energy of a droplet on a flat solid surface and showed that the adhesion energy per unit area remained constant regardless of the droplet volume. The droplet dynamics on the incline surface were studied by Annapragada et al.16 They adopted a pseudo-Lagrangian methodology based on the volume of fluid–continuous surface force (VOF–CSF) model to simulate droplet motion down an inclined hydrophobic surface. Droplet dynamics in terms of rolling and sliding on surfaces were studied by Thampi et al.17 They demonstrated that rolling motion dominated as the droplet shape approached a circle, and the viscosity contrast between the droplet and the ambient fluid became large. Sliding behavior of oil droplets on the textured surface was examined by Hsieh et al.18 They indicated that a linear relation between the sliding angle and the work of adhesion controls the sliding behavior of the droplets. Mass dependence of rolling/sliding ratio of water droplet on smooth surface was investigated by Suzuki et al.19 They showed that the contribution of rolling motion was large in the sliding acceleration of large droplets and the smaller droplets were sliding down mainly with a slipping mechanism. Investigation of internal fluidity in a water droplet during sliding on the hydrophobic surfaces was carried out by Sakai et al.20 The findings revealed that on the superhydrophobic surface, the droplet moved at high velocity by slipping; however, on a hydrophobic surface, both slipping and rolling controlled the droplet velocity during sliding. Sliding of water droplets on smooth hydrophobic surfaces with presence of the triangle hydrophilic regions were studied by Nakajima et al.21 They demonstrated that control of the sliding velocity while sustaining the static contact angle was feasible via designing the shape and alignment of chemical heterogeneity. The droplet rolling on the tilted non-wettable solid surface was investigated by Richard and Quere.22 They showed that rolling off the droplets dominates over the sliding on non-wettable surfaces and smaller droplet diameters resulted in higher rolling velocity. A study on droplets rolling was carried out by Mahadevan & Pomeau.23 They introduced the scale law analysis for a uniform speed of a droplet rolling on the inclined surface and showed that the classical stress singularity at the contact line was alleviated for a rolling droplet. Influence of surface roughness on rolling of droplets on inclined hydrophobic surface was investigated by Miwa et al.24 They analyzed the relation between sliding angles and contact angles on hydrophobic surfaces with roughness. The droplet mobility on lubricant-impregnated surfaces was examined by Smith et al.25 The findings revealed that contact line morphology comprising a finite annular ridge of the lubricant pulled above the surface texture and subsequently as many as three distinct contact lines. In addition, these distinct morphologies not only govern the contact line pinning that controlled droplets initial resistance to the movement, but also the level of viscous dissipation and hence their sliding velocity once the droplet began to move. Water droplet movement on viscoelastic surfaces was studied by Karpitschka et al.26 They quantitatively presented dynamic contact angle and provided a mechanism for stick–slip motion when a droplet was forced strongly. In this case, the contact line allowed the droplet sliding down the wetting ridge. A motion of viscous drops on superhydrophobic surfaces due to magnetic gradients was studied by Schneider et al.27 They demonstrated that the paramagnetic particle chain orientation compensated for the viscosity increase to maintain the droplet movement.
Although the internal fluidity of a sessile droplet and droplet adhesion on hydrophobic surfaces were previously studied,13,14,28 those studies mainly sought to examine the heat transfer and flow field in a sessile droplet13,14 and the droplet adhesion on a hydrophobic surface due to high-contact angle hysteresis.28 The dynamics of a droplet rolling off an inclined hydrophobic surface were set aside for future study. Consequently, in the present study, the droplet dynamics on an inclined surface was examined for various droplet sizes and inclination angles. An experimental rig was designed to monitor droplets rolling on an inclined surface, and a high-speed camera was used to determine the droplet rotational and translational velocities during rolling. The force balance of the droplet along the contact line was considered, and the droplet rotational velocity was formulated. The internal fluidity of the droplet was simulated during rolling, and theoretical predictions of the rolling and translation velocities were compared to those obtained experimentally. The air drag and shear force along the contact line were predicted and incorporated into the analysis. The flow field inside the droplet and the maximum and minimum droplet puddle heights were numerically predicted and compared with their experimental counterparts. The model study for the internal fluidity of a droplet was validated through particle image velocimetry data.
Modelling of droplet movement on inclined hydrophobic surface and internal fluidity
The internal fluidity of a droplet was simulated in accordance with the experimental conditions of the inclined hydrophobic surface. The geometric features of the droplet used in the numerical simulations resemble the actual droplet geometry corresponding to experiments. COMSOL Multiphysics software29 was used to simulate the flow field inside the droplet. A laminar isothermal two-phase flow, moving mesh interface was used in the simulations. In this case, an Arbitrary Lagrangian–Eulerian (ALE) formulation was incorporated into the computations.30 An isothermal flow was assumed in the simulations because the temperature was held constant during the experiments.In the air and water domains, the incompressible Navier–Stokes equations were solved as
| ρ(∂V/∂t + (V − VM)·∇V) = −∇p + ∇[μ(∇V + (∇V)T)] + F | (1) |
The continuity equation is as follows:
| ∇·V = 0 | (2) |
Initial condition
The flow velocity was set to zero for water in a stagnant condition inside the droplet, and the pressure was set to the Laplace pressure. Temperature equilibrium is assumed between the droplet and its surroundings.Boundary conditions
A constant pressure boundary was assumed for the outside of the droplet, and the external pressure of the droplet was set at atmospheric pressure. In addition, the stagnant air at the droplet outer surface initially yielded a velocity of zero. Then, an air drag force was generated during the droplet movement on the surface. The volume force was applied to the droplet domain in the direction of the inclination angle. A fluid–fluid interface was applied to the free boundary of the water droplet to track the evolution of the water–air interface:| n·(τw − τa) = γ(∇·n)n − ∇γ | (3) |
| τw,a = −pw,aI + μw,a(∇Vw,a + (∇Vw,a)T) | (4) |
This boundary condition can be decomposed into a normal component:
| n·τw·n − n·τa·n = γ(∇·n) | (5) |
| n·τw·t − n·τa·t = ∇γ·t | (6) |
The term on the right-hand side of eqn (5) is the force per unit area due to local curvature of the interface. The term on the right-hand side of equation is a tangential stress associated with the gradients in the surface tension coefficient. A mesh velocity equal to the fluid velocity is imposed on the interface:
| VM = V | (7) |
The free deformation was considered in the fluid flow domain to account for the movement of the water–air interface. The Navier slip boundary condition was considered at the bottom boundary, where it enforced the slip condition (V·nwall = 0) and accounted for a frictional force, (Ffr = −(μ/β)V), where β is the slip length (β = ξ/5) and ξ is the mesh element size.
Open boundary conditions were specified to the left and right edges, whereas symmetric boundary conditions were considered at the top boundary of the computational domain. Because the time taken for the experiment and the simulation of experimental conditions was short, the evaporation from the droplet surface was neglected in the simulations. This situation was verified during the experiment and the sessile droplet images taken after 30 s and 100 s periods, which were compared with the image that was collected at the start of the experiments. Both images showed an identical droplet diameter and height. In the numerical approach, finer meshes were located in the region near the water–air interface (Fig. 1). Mesh independence tests were conducted for each droplet contact angle considered in the simulations.
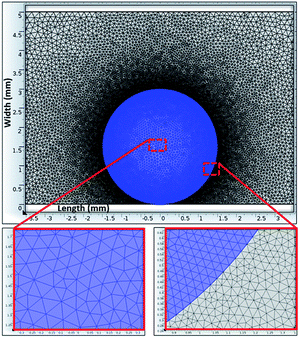 | ||
| Fig. 1 Grid used in the simulations. Finer meshes were located in the region near the water–air interface. | ||
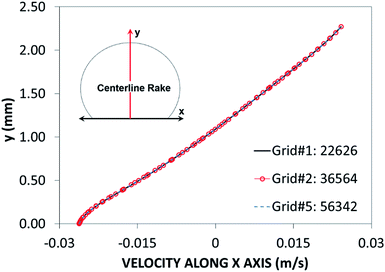
Fig. 2 shows grid independent test results for velocity distribution along the central rake of the with 14 μL volume. In this case, after the mesh independence tests, a mesh size comprising 22![[thin space (1/6-em)]](https://www.rsc.org/images/entities/char_2009.gif) 626 cells was selected for the simulations (for a 14 μL droplet). The governing equations of flow were discretized using the implicit scheme with a backward difference approximation (backward Euler finite-difference method), and unconditionally stable solutions were ensured.31 The selection of a time step at approximately 10−4 s was critical to the accuracy of the scheme. The residuals of flow parameters were set as |ψk − ψk−1| ≤ 10−8.
626 cells was selected for the simulations (for a 14 μL droplet). The governing equations of flow were discretized using the implicit scheme with a backward difference approximation (backward Euler finite-difference method), and unconditionally stable solutions were ensured.31 The selection of a time step at approximately 10−4 s was critical to the accuracy of the scheme. The residuals of flow parameters were set as |ψk − ψk−1| ≤ 10−8.
Experimental and validation study of droplet internal fluidity
A polycarbonate wafer and acetone were used to prepare the hydrophobic surface for crystallization. The hydrophobic solution-crystallized surface was produced and used in the experiments. To texture the surface via surface crystallization, a bare polycarbonate wafer was cleaned and immersed in acetone for 4 min in accordance with the procedure stated in an earlier study.32 The surface of the polycarbonate wafer was crystallized, and the hierarchical surface texture was obtained, which was composed of micro-/nanospherulites and poles. Synthesized silica particles were deposited onto the surface to improve the surface hydrophobicity and reduce the contact angle hysteresis on the solvent-induced crystallized polycarbonate surface. Silica particles were synthesized using a method similar to that reported in the previous study (Yong et al. 2014). The process is briefly described herein. Tetraethyl orthosilicate (TEOS), isobutyl trimethoxysilane (OTES), ethanol and ammonium hydroxide were used in the synthesizing process. In this case, 14.4 mL of ethanol, 1 mL of ultrapure water and 25 mL of ammonium hydroxide were mixed and stirred for 12 min. Then, 1 mL of TEOS diluted in 4 mL of ethanol was added to the mixture. After 30 min, 0.5 mL of TEOS diluted in 4 mL ethanol was added. After 5 min, a silane molecule modifier was added in a molar ratio of 3![[thin space (1/6-em)]](https://www.rsc.org/images/entities/char_2009.gif) :
:![[thin space (1/6-em)]](https://www.rsc.org/images/entities/char_2009.gif) 4 with respect to the second edition of TEOS. The final mixture was stirred for 20 h at room temperature and later centrifuged and washed with ethanol to complete the removal of non-reactants. The solvent casting was applied to deposit the solution on the copied and replicated PDMS surfaces. All solvents were evaporated using vacuum drying, and the resulting surfaces were characterized. It should be noted that the exchange of the solvent (removing of the water) improve the evaporation rate during the coating procedure.33
4 with respect to the second edition of TEOS. The final mixture was stirred for 20 h at room temperature and later centrifuged and washed with ethanol to complete the removal of non-reactants. The solvent casting was applied to deposit the solution on the copied and replicated PDMS surfaces. All solvents were evaporated using vacuum drying, and the resulting surfaces were characterized. It should be noted that the exchange of the solvent (removing of the water) improve the evaporation rate during the coating procedure.33
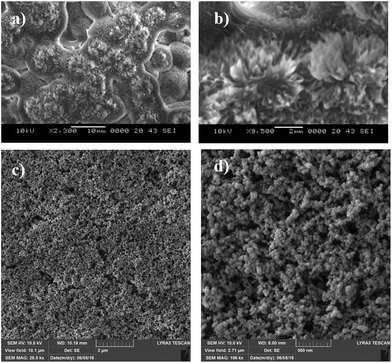
A Jeol 6460 scanning electron microscope (SEM) and atomic force microscope (AFM) in contact mode were used to examine the surface topology and surface texture of the crystallized polycarbonate wafer. The tip consisted of silicon nitride probes (r = 20–60 nm) with a manufacturer-specified force constant (k) of 0.12 N m−1. The SEM micrographs of the solution-crystallized polycarbonate surface are shown in Fig. 3a and b. The surface composed of spherules like (Fig. 3a and whiskers like structures Fig. 3b), which resulted in hydrophobic characteristics. The average surface roughness of the crystallized polycarbonate surface was approximately 2.8 μm. Fig. 3c and d show the deposited functionalized silica particles on the solvent-crystallized polycarbonate surface. On the other hand, Fig. 4a and b show atomic force microscopy (AFM) image and line scan of the solvent crystalized and functionalized silica particles deposited surfaces used in the current experiments of droplet rolling. It is evident that the surface composed of hierarchical texture with micro/nano poles. Since the solvent induced crystalized surface has textures comprise of micro/nano poles, water droplet does not wet the surface completely. In this case, the Wenzel and Cassie–Baxter equations for apparent contact angle, which included surface roughness, provided a more realistic formulation of the liquid contact angle.34 It should be noted that the governing equation for Wenzel state is cos![[thin space (1/6-em)]](https://www.rsc.org/images/entities/char_2009.gif) θ* = r
θ* = r![[thin space (1/6-em)]](https://www.rsc.org/images/entities/char_2009.gif) cos
cos![[thin space (1/6-em)]](https://www.rsc.org/images/entities/char_2009.gif) θ, where θ* is the apparent contact angle which corresponds to the stable equilibrium state. The roughness ratio, r, is a measure of how surface roughness affects a homogeneous surface. The roughness ratio is defined as the ratio of true area of the solid surface to the apparent area. For the heterogeneous surface, the Cassie–Baxter equation is cos
θ, where θ* is the apparent contact angle which corresponds to the stable equilibrium state. The roughness ratio, r, is a measure of how surface roughness affects a homogeneous surface. The roughness ratio is defined as the ratio of true area of the solid surface to the apparent area. For the heterogeneous surface, the Cassie–Baxter equation is cos![[thin space (1/6-em)]](https://www.rsc.org/images/entities/char_2009.gif) θ* = rff
θ* = rff![[thin space (1/6-em)]](https://www.rsc.org/images/entities/char_2009.gif) cos
cos![[thin space (1/6-em)]](https://www.rsc.org/images/entities/char_2009.gif) θ + f − 1, here the rf is the roughness ratio of the wet surface area and f is the fraction of solid surface area wet by the liquid. A liquid droplet has liquid–solid and liquid–vapor interfaces, and the contact angle includes the contributions of two interfaces. Therefore, the equation for the contact angle is as follows:34
θ + f − 1, here the rf is the roughness ratio of the wet surface area and f is the fraction of solid surface area wet by the liquid. A liquid droplet has liquid–solid and liquid–vapor interfaces, and the contact angle includes the contributions of two interfaces. Therefore, the equation for the contact angle is as follows:34
cos![[thin space (1/6-em)]](https://www.rsc.org/images/entities/char_2009.gif) θc = f1 θc = f1![[thin space (1/6-em)]](https://www.rsc.org/images/entities/char_2009.gif) cos cos![[thin space (1/6-em)]](https://www.rsc.org/images/entities/char_2009.gif) θ1 + f2 θ1 + f2![[thin space (1/6-em)]](https://www.rsc.org/images/entities/char_2009.gif) cos cos![[thin space (1/6-em)]](https://www.rsc.org/images/entities/char_2009.gif) θ2 θ2
| (8) |
 | (9) |
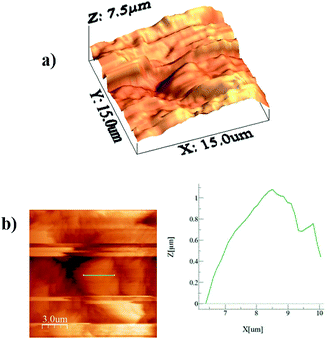 | ||
| Fig. 4 AFM image of crystalized surface: (a) 3-D image of the crystallized surface, (b) line scan over spherules at the surface. | ||
The AFM image of the texture pole heights (Fig. 4a and b) are also analyzed in details. The solid fraction for the solvent-induced crystallized polycarbonate surface was determined to be within the range of 0.4 ≤ f ≤ 0.6. Because the functionalized silica particles created the lotus effect on the solvent-crystallized polycarbonate surface, several tests were carried out for water droplet contact angle measurements on the workpiece surface in line with the previous study.36,37
A goniometer (Kyowa model – DM 501) was used to conduct sessile drop tests to measure the droplet contact angle. In this case, the droplet static contact angle was measured in line with the previous studies36,37 and it is found to be varying from 145° to 150°. High-precision drop shape analysis (HPDSA) was adopted during the measurements in accordance with the previous study.36,37 In order to examine the rolling/sliding behavior of the droplets, a test rig was designed and built in line with the previous study.37 The experimental arrangements enabled to test the dynamic behavior of the droplets on the inclined non-wetting surface.
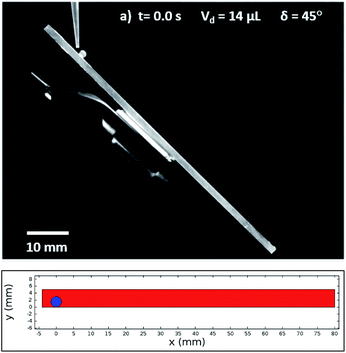
In this case, Dantec Dynamics (SpeedSense 9040) high-speed camera was used to record the rolling and sliding motion of various-sized droplets located on different inclination angles of the hydrophobic surface. Fig. 5 shows an image of the droplet of Vd = 14 μL on a 45° inclined hydrophobic surface and an image obtained from a simulation that incorporated the same boundary conditions as in the experiments.
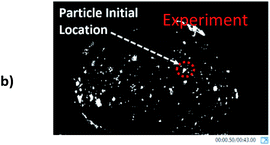
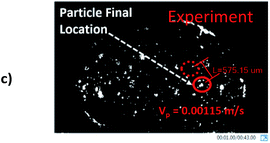
To validate the model study, particle image velocimetry (PIV, Dantec) was used to monitor the particle velocities inside the sessile droplet on the hydrophobic surface with an inclination angle of 0° (horizontal surface). The sample rate was 100 frames per second and the resolution was 960 × 720 pixels. It should be noted that the PIV focusing system has almost negligibly small aberration because of the aberration correction facility. Hence, the hollow glass particles within the focused plane were observed and recorded clearly and others were not. In order to calibrate the focus setting of the PIV for recording the particles motion across the droplet cross-section, initially the laser plane-illumination beam was introduced passing through the droplet cross-section. Later, the focus setting of PIV lens was adjusted to focus at the illuminated plane of the droplet cross-section while simultaneously realizing the PIV measurements. This facilitated to calibrate proper focus setting of the PIV lens. However, the width of the illuminated plane was larger than the width of the focused plane at the droplet cross-section due to the lens aberration correction. Nevertheless, the difference between the width of both planes are negligibly small. In addition, the measurements were repeated 12 times to ensure the repeatability of the data recorded. Since the particle velocities inside the rolling droplet are difficult to monitor with accuracy, a sessile droplet is considered to validate the velocity predictions obtained from the numerical code. This arrangement avoided droplet rolling on the surface; therefore, a sessile droplet with Vd = 40 μL was used to numerically simulate the flow field and monitor the flow velocities using PIV. In validation study, numerical simulations and experimental measurements were carried out after incorporating 1 °C temperature difference between the water droplet and the hydrophobic surface. This arrangement was necessary to generate the flow field inside the droplet under the Marangoni and the buoyancy forces. In the experiments, initially, hydrophobic surface was maintained at 301 K and water temperature was kept at 300 K prior to water droplet formation on the hydrophobic surface. In the simulations, the boundary conditions for energy and momentum equations are set while mimicking the experimental conditions. In addition, hollow glass particles were used in the water droplet to monitor and trace the particle velocities inside the droplet during the heating process. Table 1 gives the properties for hollow glass particles. The governing momentum equation was solved using the discrete phase model after incorporating the hollow glass particles in the solution domain. The energy equation was solved by assuming a slurry-single fluid, which resembled water, and a hollow glass particle mixture. Because the hollow glass particle concentration was low (3%) in the carrier fluid (water), the effective thermal properties were incorporated into the energy equation.
| Property of hollow glass spheres | Value |
|---|---|
| Mean particle size (μm) | 10 |
| Particle shape | Spherical |
| Density (kg m−3) | 1400 |
| Melting point (°C) | 740 |
| Thermal conductivity (W mK−1) | 1.14 |
| Specific heat capacity (kJ kg−1 K−1) | 0.83 |
The incompressible flow field was considered to formulate the governing equations of flow and heat transfer. The field equations were numerically solved in accordance with the experimental conditions. The coupled flow and thermal fields were considered simultaneously in the simulations.
The formulation of the governing equations and numerical discretization is not given herein, but the details can be found in a previous study.38 Experiments were repeated twelve times and based on the distribution of the experimental data, the confidence level of 95% was observed. In this case, the mean of the data distribution was within ±1.75 of the standard deviation of the distribution of a single measurement from that distribution. The experimental uncertainty analysis revealed that the uncertainty less than 4% was obtained for the velocity measurements. The flow velocities that were measured from PIV and predicted from the multi-physics code, and the PIV images of the hollow glass particles inside the droplet are provided in Table 2. The particle velocities predicted from the multi-physics code and the experiments are in good agreement. However, the small discrepancies between both results are related to computational errors, such as round-off errors, and the experimental error based on the measurement uncertainties.
Predictions of droplet maximum height variation and droplet acceleration along 45° inclined hydrophobic surface were validated via high speed camera data (Dantec, HiSense 600 camera) for droplet volume of 14 μL. Experiments were repeated 12 times and the measurement error was estimated based on experimental repeats.
Experimental error estimated was in the order of 5%. Fig. 6a and b show temporal variation of droplet maximum height and acceleration, respectively. Predictions of the droplet maximum height variation and droplet acceleration agree well with the high-speed camera data. The small differences between both results are within the experimental error.
Results and discussion
The droplet movement on an inclined hydrophobic surface was examined for various droplet sizes. The gravitational, adhesion and viscous forces associated with droplets pinned on and rolling off the surfaces were analyzed, and the flow fields developed inside the droplet during rolling were simulated. The droplet rotational velocity and acceleration were measured and predicted from the experiments and numerical simulations. The droplet volumetric shape evolution during the roll off was examined for various droplet sizes.The rolling of a water droplet on a hydrophobic surface can be formulated through the force balance along the contact line in the rolling direction. Because various droplet volumes were considered in the present study (0.52 μL ≤ Vd ≤ 33.5 μL, where Vd is the droplet volume), the contact angle hysteresis due to each droplet size was measured.
Table 3 gives the droplet contact angle and hysteresis for various droplet sizes. The contact angle hysteresis for the various sizes of a sessile droplet prior to rolling varied from 1° to 3°. In general, the contact angle hysteresis varies between 1° and 3° for a pinned droplet on a hydrophobic surface. Consequently, a functionalized silica deposition results in considerably low contact angle hysteresis, which creates a lotus effect.
| 0.52 μL | 4.2 μL | 14 μL | 33.5 μL | |
|---|---|---|---|---|
| Contact angle (degrees) | 160 | 158 | 156 | 156 |
| Contact angle hysteresis (degrees) | 1 | 2 | 2.9 | 2.9 |
In contrast, a previous study demonstrated that the force required to detach and initiate droplet rolling on a surface is identical to the force needed to overcome adhesion forces.39
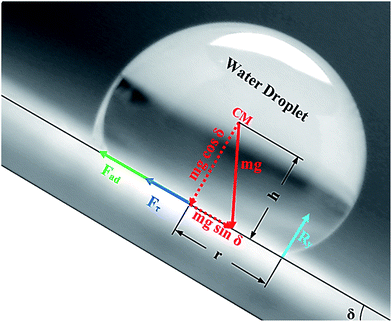
Alternatively, a droplet on an inclined surface undergoes elastic deformation and the total net force depends on the droplet acceleration. Puddling and wobbling effects during the rolling of a droplet on a hydrophobic surface modify the line of action of the net force on the droplet. In addition, it causes a variation in the dynamic droplet hysteresis (θR − θA), where θR is the receding (uphill) angle and θA is the advancing (downhill) angle of the droplet during rolling, which alters the droplet adhesion force. In line with Fig. 7, the force balance for a steadily rolling droplet around the center of mass yields
 | (10) |
 | (11) |
Because the solid surface is textured, the roughness parameter can be incorporated into eqn (10) in line with the Young–Dupre equation.42 In this case, eqn (11) yields:
 | (12) |
A shear force is generated when the droplet rolls on a surface because of the rate of fluid strain formed along the contact line between the water droplet and hydrophobic surface. The shear stress can be written as
 | (13) |
 is obtained from the simulation data.
The drag force due to the air resistance when the droplet rolls on a surface is related to the pressure drag and frictional drag. However, the simplified form of the drag force for a spherical body due to air resistance is the function of flow Reynolds number and shape factor. However, the drag force can be related to D ∼ 1/2CdρaAcUT, where Cd is the drag coefficient,43 which is in the order of unity for rotating sphere,44 ρa is the air density, Ac is the droplet cross-sectional area, and UT is the droplet translational speed along the inclined surface. The transverse speed of the droplet is obtained from the simulations. Rearranging eqn (10) yields
 | (14) |
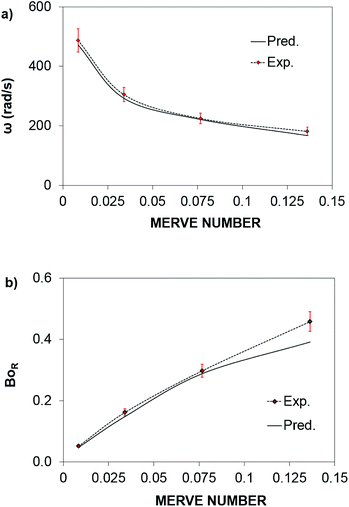
The rotational speed of the droplet obtained from eqn (14), and measured from high-speed camera records and predicted from simulations were compared. The findings revealed that the rotational speed obtained from eqn (14) and measured from the high-speed camera data are in good agreement. Because various droplet sizes were considered in the analysis, the droplet size was presented as a dimensionless number corresponding to the ratio of the droplet weight to the surface tension force prior to the initiation of the droplet rolling, i.e.,  , where MN is the Merve number and γ is the specific weight of water. Fig. 8a shows the droplet rotational speed obtained from the experiments and predicted from the simulations versus MN. Increasing MN reduced the rotational speed, which indicated that an increase in the droplet size lowered the droplet rotational speed. This behavior was attributed to increased adhesion and drag forces as the droplet radius increased, in line with eqn (14), although the body force under the influence of gravity increases with increasing droplet radius. Therefore, the increase in the force magnitude in opposition to droplet rolling becomes larger than the gravitational force driving the droplet to slide and roll on the inclined hydrophobic surface. This situation is also shown in Fig. 8b, where the rotational Bond number
  versus MN is plotted. Because the rotational Bond number is proportional to R3 and ω2, increasing MN gives rise to an increase in the rotational Bond number.
The droplet shape changes under the influence of gravity and surface tension. The exact shape of the sessile droplet depends on the balance between the gravitational force, which favors increasing contact area, and capillarity force, which opposes droplet bulging and reduces the contact area between the droplet and underlying surface.
The gravitational force lowers the location of the droplet center of mass by λ, and the difference in energy from a perfect sphere, which is the tangent to the plane of the solid surface, can be approximated by σλ2 ≅ ρgR3λ,23 where R is the droplet radius and σ is the surface tension of the droplet liquid.
The contact length (l) between the droplet and the solid surface due to droplet bulging is related to  . The minimization of the energy difference was estimated using the contact length results from ρgλ ∼ σl2/R3. This led to the contact length in the form of
  , which is similar to the reported estimation in the previous study.23 The term
  represents the capillary length. Moreover, after mathematical arrangements, the shift in the droplet center of mass (λ) can be reduced to –
  .
.
Consequently, for a droplet of radius R that is larger than the capillarity length, the gravitational force flattens the droplet into a puddle. However, a droplet of radius R that is smaller than the capillary length  , remains quasi-spherical. For the large size droplets, the puddle thickness (h) can be expressed as
  , where θ is the droplet contact angle.4
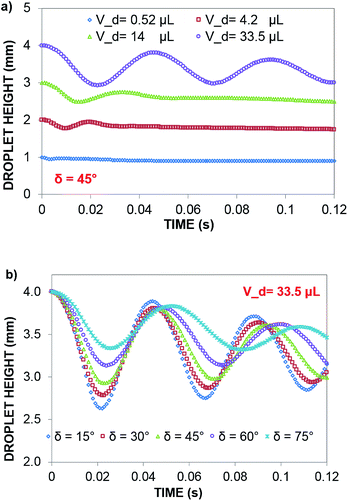
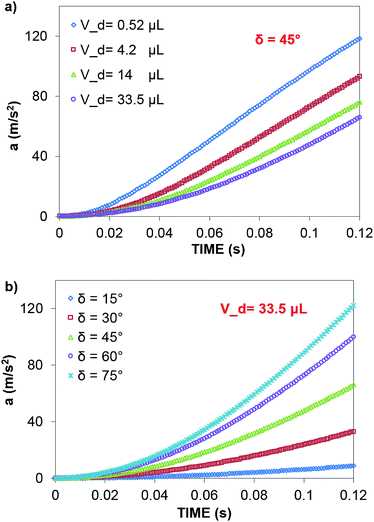
In contrast, in a rolling droplet, the puddle thickness varies because of the elastic response of the droplet, which modifies the droplet internal fluidity. In this case, the contact line dynamics modify the receding (uphill) and advancing (downhill) contact angles of the droplet while altering the adhesion force  between the droplet and surface, which changes the force balance at the droplet–solid interface and gives rise to droplet wobbling on the solid surface during rolling. Fig. 9a shows the temporal variation in the droplet height obtained from simulations for various droplet volumes. Fig. 9b shows the droplet height variation with time for various angles of inclination during rolling of the droplets on the inclined surface. The droplet height changes with time and is more pronounced for the large-volume droplets. The change is approximately 24% of the total height of the droplet during the early rolling period of the droplet. As rolling progressed, the radial acceleration (Fig. 10a and b) and thus rotational speed of the droplet increased.
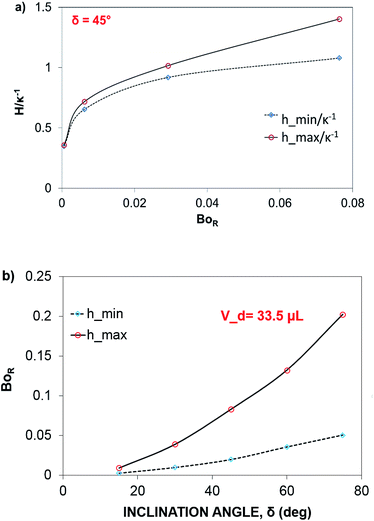
The dynamic contact angle hysteresis (θR − θA), (where θR and θA are the receding (uphill) and advancing (downhill) droplet contact angles, respectively, during rolling) was reduced, whereas the adhesion force (Fad) on the inclined surface decreased. This reduction lessened the droplet wobbling on the inclined surface. The small-volume droplets with a diameter in the range of the capillarity length behaved as a quasi-solid sphere; that is, the maximum and minimum heights of the droplet remained similar during rolling. This situation is shown in Fig. 11a, where the dimensionless maximum and minimum heights of the droplet with rotational Bond number  are given. The maximum and minimum droplet heights were nondimensionalized with the capillarity length
  . The difference between the maximum and minimum heights remained small for small values of the rotational Bond number (BoR < 0.02). The rotational Bond number is proportional to the cubic power of the radius (R3); therefore, the droplet wobbling ceased for small-sized droplets. However, the rotational Bond number for large-size droplets enhanced the difference between the maximum and minimum droplet heights during droplet rolling. The relationship between the dimensionless droplet height and Bond number is parabolic for small rotational Bond number values (BoR < 0.02); however, the relationship becomes approximately linear as the Bond number increases (Bo > 0.02). For example, for a water droplet with a volume Vd = 0.52 μL (BoR = 0.005), the difference between the maximum and minimum droplet heights is approximately 1%; however, it is approximately 40% for a droplet volume of Vd = 33.5 μL (BoR = 0.075).
Therefore, for a small-diameter droplet, the effect of the droplet rotation and radius on the droplet geometric symmetry becomes non-linear even though the deviation from the droplet geometric symmetry is small. In contrast, the difference between the maximum and minimum droplet heights remains large as the inclination angle of the surface changes. It should be noted that Fig. 11b demonstrates the variation of rotational Bond number ( , where ρ is the water density, R is the droplet radius, ω is the angle of rotation and σ is the surface tension) for maximum and minimum values of droplet height during the droplet wobbling. In the early rolling period, the droplet rotational speed remains low regardless of the inclination angle of the hydrophobic surface. This low speed gives rise to a large wobbling of the droplet.
The difference between the maximum and minimum heights of the droplet decreases as the droplet rotational speed increases with time. Hence, an increase in the inclination angle reduces both droplet wobbling and the difference between the maximum and minimum heights of the droplet. In this case, the rotational speed of the droplet increases, whereas the droplet height difference reduces. This situation is shown in Fig. 10b. Because the rotational Bond number is related to ω2, the difference between the maximum and minimum droplet heights remained low for large values of the rotational Bond number. However, the ratio of the translational speed (UT) to the rotational speed (ωR) influenced the droplet wobbling during rolling;45 in the current study, the rotational and translational speeds have similar orders, i.e., ωR/UT ∼ 0.9. In addition, the ratio of the rotational speed over the translational speed is critical to the relative magnitude of the dynamic pressure generated between the droplet center and droplet ambient pressure.38 In this case, for the condition  (where Δρ is the density difference between the droplet liquid and droplet ambient gas and ρa is the droplet ambient gas density), the dynamic pressure associated with the translation speed did not have a significant effect on droplet wobbling, consistent with the previous finding,38 i.e., φ is approximately 900; therefore, the dynamic pressure did not significantly affect droplet wobbling.
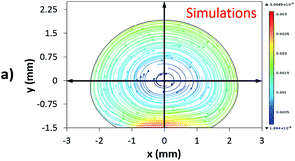
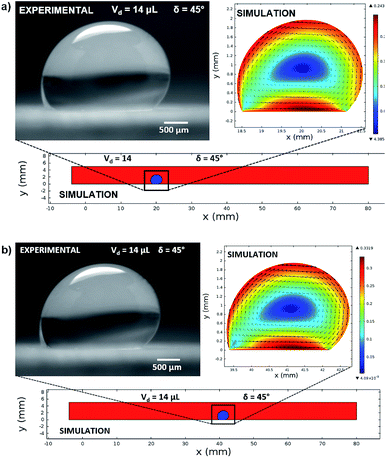
Fig. 12 shows the velocity contours for a droplet of volume Vd = 14 μL for two locations on an inclined surface, and Fig. 13 shows the locations for droplets of various sizes on the inclined surface for same time period (t = 0.12 s). The inclination angle of the hydrophobic surface was 45° to demonstrate the flow field. In general, a single circulation cell is developed inside the droplet during rolling. The center of the circulation cell nearly coincides with the droplet mass center. The presence of a regular flow pattern indicates a laminar flow inside the droplet. The flow Reynolds number, which is based on the average velocity and contact length (l), ranged from 32 to 400 and changed at different droplet locations on the hydrophobic surface. The fluid velocity in the contact region of the rolling droplet varied on the inclined hydrophobic surface. This was particularly true in the region of the first and last contact points of the droplet on the hydrophobic surface, which are shown by the velocity contours in Fig. 12. For example, for a droplet volume (Vd = 14 μL and R = 1.5 mm) and a droplet location of 40 mm on the inclined surface (rotational speed, ω = 225 rad s−1), the maximum fluid velocity was approximately 0.31 m s−1, whereas the fluid velocities in the region of the first and last contact points on the surface were approximately 0.2 and 0.1 m s−1, respectively. Therefore, viscous dissipation occurred in this region. Moreover, the flow field inside the droplet did not follow the velocity field of a solid body rotation despite the small diameter of the droplet. Consequently, the elasto-viscous behavior of the fluid during the droplet rolling resulted in viscous dissipation inside the droplet.
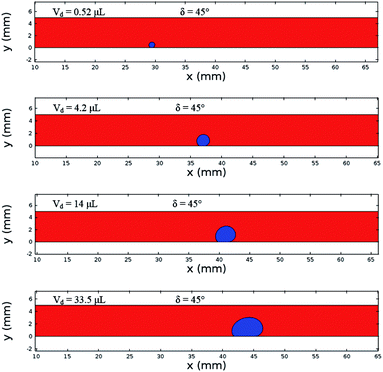 | ||
| Fig. 13 Locations of different sized droplets after 0.12 s at an inclination angle of δ = 45°. The red color represents the air domain, and the blue color represents the water domain. | ||
The local capillary number  of the fluid varied between 0.002 and 0.0027. In this case, an increase in the rotational Bond number
  increased the flow velocity and thus the viscous dissipation inside the droplet according to
  , where V is the velocity vector in the droplet fluid and Vd is the volume.
The progression of the rolling droplet shape was evident at different locations on the hydrophobic surface. For example, the round flow shape of the droplet evolved into a shape with puddle, which is consistent with that reported in the previous study.38 The fluid strain rate in the close region of the first and second droplet contact points on the surface was high, which resulted in shear stress along the contact line. However, the shear stress and shear force decreased due to the low rate of fluid strain and its localized effect. Specifically, the shear stress was approximately 0.03 N m−2, and the shear force acting on the contact surface was approximately 5 × 10⁻⁸ N.
Although the distance travelled by the small-sized droplet (Vd = 0.52 μL) appeared to be shorter than the other droplet sizes for a given time, the rotational speed of the droplet remained higher than those of the large-sized droplets, as shown in Fig. 13. This finding reveals that small-sized droplets attained a higher rotational acceleration than the large-sized droplets (Fig. 10). This behavior was attributed to the reduced wobbling of the small-sized droplet, which gave rise to a smaller contact length (l ≅ 0.0003 m) than the large droplets (Vd = 33.5 μL and l ≅ 0.002 m); i.e., the adhesion and shear forces remained smaller for the small-sized droplets than for the large-sized droplets. Consequently, the high rolling and small sliding velocities resulted in a lower dissipative droplet energy, which caused small adhesion and frictional forces due to the low fluid shear rate.
Conclusion
Water droplet rolling on an inclined hydrophobic surface was examined, and the internal fluidity of the rolling droplet was simulated in accordance with the experimental conditions. An increase in the inclination angle and a reduction in the droplet size increased the droplet rotational speed. An increase in droplet size produced increases in the adhesion force along the contact line and the drag and shear forces. However, the pinning force, composed of adhesion, drag and shear forces, increased slightly with increasing droplet volume; the increase in the pinning force per unit inclination angle remained slightly larger than that of the droplet inertial force because of the growth in droplet volume during droplet rolling. This increase in droplet radius reduced the rotational speed. The change in the force balance at the droplet–solid interface resulted in droplet wobbling on the inclined surface during rolling. In this case, the droplet height changed and became approximately 24% of the averaged height of the droplet during the early rolling period. As rolling progressed, the change in the droplet height remained small. The small-diameter droplets with a similar range of capillarity lengths behaved as a quasi-solid sphere, and the difference between the maximum and minimum heights of the droplet decreased during rolling. In addition, the difference between the maximum and minimum heights remained small for small rotational Bond numbers (BoR < 0.02). The ratio of the rotational speed over the translational speed is critical for the relative magnitude of the dynamic pressure generated between the droplet center and droplet ambient pressure. Because this ratio is approximately unity, the droplet height does not significantly change under the influence of the relative dynamic pressure during droplet rolling. A single circulation cell is formed inside the droplet for various sizes during the rolling, and the circulation cell center nearly coincides with the droplet mass center. The fluid strain rate in the close region of the first and second droplet contact points on the inclined surface remained high, which produced a slightly high shear stress formation along the contact line in this region. Nevertheless, the shear stress and shear force became small due to the low rate of fluid strain and its localized effect. Specifically, the shear force acting on the contact surface was approximately 5 × 10⁻⁸ N. Finally, the present findings provided new information on the characteristics of rolling droplets, the influence of the droplet size on the internal fluidity and the influence of the inclination angle on the water droplet rotational speed and puddling on hydrophobic surfaces, which can be used for self-cleaning surface applications.Conflicts of interest
There are no conflicts to declare.Acknowledgements
The authors acknowledge the financial support of the Deanship of Research at King Fahd University of Petroleum and Minerals (KFUPM) and King Abdulaziz City for Science and Technology (KACST) through project #11-ADV2134-04.Notes and references
- A. Shalaby, B. Rappenglueck and E. Eltahir, Atmos. Chem. Phys. Discuss., 2015, 15, 1523–1571 Search PubMed.
- F. Mejia, J. Kleissl and J. Bosch, Energy Procedia, 2014, 49, 2370–2376 CrossRef.
- E. Tuck and L. Schwartz, J. Fluid Mech., 1991, 223, 313–324 CrossRef CAS.
- F. Brochard-Wyart, H. Hervet, C. Redon and F. Rondelez, J. Colloid Interface Sci., 1991, 142, 518–527 CrossRef CAS.
- S. Suzuki, A. Nakajima, M. Sakai, A. Hashimoto, N. Yoshida, Y. Kameshima and K. Okada, Appl. Surf. Sci., 2008, 255, 3414–3420 CrossRef CAS.
- R. Tadmor, Langmuir, 2004, 20, 7659–7664 CrossRef CAS PubMed.
- T. S. Meiron, A. Marmur and I. S. Saguy, J. Colloid Interface Sci., 2004, 274, 637–644 CrossRef CAS PubMed.
- E. Bormashenko and G. Whyman, Langmuir, 2013, 29, 5515–5519 CrossRef CAS PubMed.
- J. Drelich, E. Chibowski, D. D. Meng and K. Terpilowski, Soft Matter, 2011, 7, 9804–9828 RSC.
- S. Sutha, S. Vanithakumari, R. George, U. K. Mudali, B. Raj and K. Ravi, Appl. Surf. Sci., 2015, 347, 839–848 CrossRef CAS.
- G. Yakubov, T. Branfield, J. Bongaerts and J. Stokes, Biotribology, 2015, 3, 1–10 CrossRef.
- J.-H. Song, M. Sakai, N. Yoshida, S. Suzuki, Y. Kameshima and A. Nakajima, Surf. Sci., 2006, 600, 2711–2717 CrossRef CAS.
- A. Al-Sharafi, B. S. Yilbas, A. Z. Sahin, H. Ali and H. Al-Qahtani, Appl. Therm. Eng., 2016, 108, 628–640 CrossRef.
- A. Al-Sharafi, H. Ali, B. S. Yilbas, A. Z. Sahin, M. Khaled, N. Al-Aqeeli and F. Al-Sulaiman, Int. J. Therm. Sci., 2016, 102, 239–253 CrossRef CAS.
- Y. H. Kim, K. Kim and J. H. Jeong, Int. J. Heat Mass Transfer, 2016, 102, 826–832 CrossRef.
- S. R. Annapragada, J. Y. Murthy and S. V. Garimella, Int. J. Heat Mass Transfer, 2012, 55, 1466–1474 CrossRef.
- S. P. Thampi, R. Adhikari and R. Govindarajan, Langmuir, 2013, 29, 3339–3346 CrossRef CAS PubMed.
- C.-T. Hsieh, F.-L. Wu and W.-Y. Chen, Appl. Surf. Sci., 2010, 256, 7253–7259 CrossRef CAS.
- S. Suzuki, M. Sakai, N. Yoshida, A. Hashimoto, Y. Kameshima, K. Okada and A. Nakajima, Shikizai Kyokaishi, 2010, 83, 499–504 CAS.
- M. Sakai, H. Kono, A. Nakajima, X. Zhang, H. Sakai, M. Abe and A. Fujishima, Langmuir, 2009, 25, 14182–14186 CrossRef CAS PubMed.
- A. Nakajima, Y. Nakagawa, T. Furuta, M. Sakai, T. Isobe and S. Matsushita, Langmuir, 2013, 29, 9269–9275 CrossRef CAS PubMed.
- D. Richard and D. Quere, Europhys. Lett., 1999, 48, 286 CrossRef CAS.
- L. Mahadevan and Y. Pomeau, Phys. Fluids, 1999, 11, 2449–2453 CrossRef CAS.
- M. Miwa, A. Nakajima, A. Fujishima, K. Hashimoto and T. Watanabe, Langmuir, 2000, 16, 5754–5760 CrossRef CAS.
- J. D. Smith, R. Dhiman, S. Anand, E. Reza-Garduno, R. E. Cohen, G. H. McKinley and K. K. Varanasi, Soft Matter, 2013, 9, 1772–1780 RSC.
- S. Karpitschka, S. Das, M. Van Gorcum, H. Perrin, B. Andreotti and J. Snoeijer, Nat. Commun., 2015, 6, 7891 CrossRef CAS PubMed.
- J. Schneider, A. Egatz-Gómez, S. Melle, S. Lindsay, P. Dominguez-Garcia, M. Rubio, M. Marquez and A. A. García, Colloids Surf., A, 2008, 323, 19–27 CrossRef CAS.
- B. Balu, A. D. Berry, K. T. Patel, V. Breedveld and D. W. Hess, J. Adhes. Sci. Technol., 2011, 25, 627–642 CrossRef CAS.
- 25 COMSOL Multiphysics, http://www.comsol.com/comsol-multiphysics, 2017.
- B. Erzincanli and M. Sahin, J. Comput. Phys., 2013, 255, 660–679 CrossRef.
- Q. He, D. Chen and D. Jiao, IEEE Conference Electrical Performance of Electronic Packaging and Systems (EPEPS), 2011 IEEE 20th Conference, 2011, pp. 185–188 Search PubMed.
- B. Yilbas, H. Ali, N. Al-Aqeeli, M. Khaled, N. Abu-Dheir and K. Varanasi, J. Appl. Polym. Sci., 2016, 133 DOI:10.1002/app.43467.
- M. Schmitt, RSC Adv., 2014, 4, 1907–1917 RSC.
- J. Li, L. Shi, Y. Chen, Y. Zhang, Z. Guo, B.-l. Su and W. Liu, J. Mater. Chem., 2012, 22, 9774–9781 RSC.
- Y. C. Jung and B. Bhushan, Scr. Mater., 2007, 57, 1057–1060 CrossRef CAS.
- F. Heib, R. Hempelmann, W. Munief, S. Ingebrandt, F. Fug, W. Possart, K. Groß and M. Schmitt, Appl. Surf. Sci., 2015, 342, 11–25 CrossRef CAS.
- M. Schmitt, K. Groß, J. Grub and F. Heib, J. Colloid Interface Sci., 2015, 447, 229–239 CrossRef CAS PubMed.
- A. Al-Sharafi, A. Z. Sahin and B. S. Yilbas, J. Heat Transfer, 2016, 138, 072401 CrossRef.
- R. Brown and L. Scriven, Proc. R. Soc. London, Ser. A, 1980, 371, 331–357 CrossRef.
- A. ElSherbini and A. Jacobi, J. Colloid Interface Sci., 2006, 299, 841–849 CrossRef CAS PubMed.
- D. Pilat, P. Papadopoulos, D. Schaffel, D. Vollmer, R. Berger and H.-J. Butt, Langmuir, 2012, 28, 16812–16820 CrossRef CAS PubMed.
- A. H. Ayyad, J. Colloid Interface Sci., 2010, 346, 483–485 CrossRef CAS PubMed.
- B. W. McCormick, Aerodynamics, aeronautics, and flight mechanics, Wiley, New York, 1995 Search PubMed.
- A. T. M. R. W. Fox and P. J. Pritchard, Fluid Mechanics, John Wiley & Sons, Hoboken, US, 8th edn, 2012 Search PubMed.
- L. T. Elking-Tanton, P. Aussillous, J. Bico, D. Quere and J. W. Bush, Meteorit. Planet. Sci., 2003, 38, 1331–1340 CrossRef.
| This journal is © The Royal Society of Chemistry 2017 |

