DOI:
10.1039/C7RA09461B
(Paper)
RSC Adv., 2017,
7, 54651-54661
Photocatalytic activity of NiS, NiO and coupled NiS–NiO for degradation of pharmaceutical pollutant cephalexin under visible light†
Received
26th August 2017
, Accepted 30th October 2017
First published on 28th November 2017
Abstract
In this research, a magnetic core–shell catalyst support was prepared by polymerization of pyrrole in the presence of Fe3O4 nanoparticles. The magnetic support was employed for the implementation of NiS, NiO and coupled NiS–NiO. The synthesized photocatalysts were characterized by FTIR, TG, XRD, DRS, BET, TEM and SEM techniques and then used for the degradation of pharmaceutical pollutant cephalexin under visible light irradiation. The results indicated that the efficiency of the coupled photocatalyst (Fe3O4@PPY–NiO–NiS) was considerably higher than that of Fe3O4@PPY–NiO and Fe3O4@PPY–NiS. This can be explained by the lower band gap energy of the photocatalysts, obtained after coupling and immobilization on the support. Magnetization of the photocatalyst evaluated by VSM technique showed that the magnetized photocatalyst properly and quickly separated from the reaction solution with the aid of an external magnetic field. Upon regeneration, the photocatalyst retained most of its initial efficiency. The enhancing effect of H2O2 and the inhibition effects of some reagents on the degradation efficiency were studied. The photodegradation products were identified by GC-MS technique.
1. Introduction
Pharmaceutical compounds, particularly antibiotics, have been detected at concentrations up to ng L−1 levels in wastewater and surface water.1 Cephalexin (Fig. SI1†) is a broad-spectrum antibiotic used to kill a wide variety of bacteria that cause various infections including laryngitis pneumonia, tonsillitis, middle ear infection, acute bronchitis, and urinary tract infections.2 A recent study showed that high concentrations of cephalexin presented in sewage effluents (170–5070 ng L−1) and sea water collected close to the sewage outfall (6.1–493 ng L−1).1 Therefore, aqueous solutions containing cephalexin must be treated so that the pollutant is eliminated. The most commonly used methods for removal of cephalexin are sunlight degradation,3 Fenton oxidation,4–6 adsorption7 and advance oxidation processes.8
In advance oxidation processes, a suitable photocatalyst is activated by incident light with energy higher or equal to the band gap energy of the photocatalyst, and then electron–hole pairs (e−/h+) are generated. If the e−/h+ are not recombined, they have the chance to produce powerful oxidants ˙OH radicals, which in turn react with the pollutant molecules adsorbed on the surface of the photocatalyst and the oxidation reactions is initiated.8 If the e− and h+ recombine on the catalyst surface or in the bulk of the particles the energy will released as heat and degradation is not forwarded. To improve the degradation efficiency, recombination of e−/h+ must be minimized. The band gap energy of some photocatalyst is high and their efficiency is limited to UV irradiation. To increase their efficiency by visible light the band gap must be lowered.
Application of nano-sized photocatalysts can increase the rate of degradation. But nano-sized particles have some drawbacks including hardly and improperly separation from the solutions and tending to aggregate. These drawbacks and limitations can be avoided by use of suitable catalyst support. The polypyrrole (PPY) which magnetized by Fe3O4 is one of the promising supports due to its easy preparation and good environmental stability.9 These supports prevent the aggregation of photocatalysts10 and stabilize them in acidic and basic media and also as an insulator prevent the recombination of electron/hole pair. Moreover applications of magnetic support can create a red shift on the band gap energy of the photocatalysts and make their usage possible under visible light irradiations. As a photocatalyst, nano-sized NiO has the band gap energy of about 3.5 which is only activated by UV irradiation times.11
NiS has been considered as an advantageous photocatalyst because of high activity, photochemical stability, non-toxicity, low cost and having band gap energy within visible regions. However, application of magnetic support for this catalyst prevents its particle aggregation and facilitates its separation from the liquid solutions.
In this research, by taking the advantages of Fe3O4 and PPY, we prepared a PPY@Fe3O4 core–shell support. The NiS and NiO photocatalysts were then impregnated to the catalyst support and Fe3O4@PPY–NiS, Fe3O4@PPY–NiO photocatalysts were prepared. Since coupling of photocatalysts on a common magnetic support may improve the degradation efficiency, the coupled photocatalysts; Fe3O4@PPY–NiO–NiS was prepared by simultaneous immobilization of NiO and NiS on the magnetic support. The photocatalysts were used for degradation of cephalexin under visible light irradiation.
2. Experimental
2.1. Materials and methods
The chemicals, H2O2, ammonium persulphate (APS), thioacetamide, pyrrole (C4H5N), NaOH, Ni2SO4, iron (III) chloride (FeCl3·6H2O), nickel chloride (NiCl2·6H2O), iron (II) chloride (FeCl2·4H2O), HCl, m-cresol, NaCl, NaHCO3, NaNO3, Na2EDTA, Na2C2O4, isopropyl and benzoquinone were prepared from Merck company (Germany). Cephalexin pharmaceutical capsule (500 mg) was purchased from Farabi Pharmaceutical Company, Isfahan, Iran.
Characterization of photocatalysts was performed by Fourier transformation infrared spectroscopy (FTIR). The spectra were prepared on Nicolet single beam Impact 400D, in the region of 4000–400 cm−1 by use of KBr pellet. A XRD, JEOL100CX instrument was used to prepare the XRD patterns of the photocatalysts with CuKα radiation (λ = 1.788 A) operated at 40 kV and 30 mA. Thermal curves (TG-DTG) from 25 to 800 °C with heating rate of 10 °C min−1 and in air atmosphere were prepared by a Perkin-Elmer thermal analyzer (TG-DTA; model SSC-5200). Surface morphology was studied by TEM images taken by a Phillips CM10 instrument (Netherland). Energy dispersive analysis of X-rays (EDAX) and field emission electron microscopy (FESEM) spectra were prepared by use of JSM-6701F instrument, Japan. By use of diffuse reflectance spectroscopy (DRS, UV-VIS model V-670, Japan), the band gap energy of the nanophotocatalyst was determined. Nitrogen adsorption–desorption experiments were conducted by a BET, Belsorp max instrument, BEL Company, Japan. The average particle size of photocatalyst was determined by image processing software (Image J. software), and the magnetic property of the samples was measured by a commercial SQUID magnetometer from Quantum Design, Vibrating Sample Magnetometer (VSM). The concentration of cephalexin was determined by HPLC, Agilent 1200 Series. Degradation products were identified by GC-Mass instrument, 5975C Agilent with a Bpx 30 m × 0.25 mm × 0.25 μm capillary column.
2.2. Preparation of nano-sized Fe3O4 and Fe3O4@PPY core shell
Fe3O4 was prepared by modified procedure given by Wang.12 Details of procedure given in pervious published work.13
The magnetite core–shell (Fe3O4@PPY) was prepared by oxidative polymerization of pyrrole in the presence of aluminum persulphate (APS) solution. In the previous work optimum condition was obtained for synthesis of core–shell.13 Fe3O4@PPY preparation scheme is given in Fig. SI2† and the experimental conditions for core–shell preparation is given in Table SI1.†
2.3. Synthesis of nano-sized NiO and NiS
For preparation of NiO, the procedure advised by Zhao was employed.14 To 12.0 g of NiCl2·6H2O dissolved in 30 mL of deionized water, NaOH solution (0.1 M) was drop wise added until bright green Ni(OH)2 precipitate was formed. The precipitate was collected by centrifugation, dried at 70 °C and calcined at 550 °C for 3 h.
To prepare nano-sized NiS, used procedure was given in previous work.13
2.4. Preparation of Fe3O4@PPY–NiS, Fe3O4@PPY–NiO, Fe3O4@PPY–NiO–NiS photocatalysts
The nano-sized photocatalysts; Fe3O4@PPY–NiO and Fe3O4@PPY–NiS with different NiS or NiO content were prepared by adding appropriate amount of NiO and NiS nanoparticles (10–80%) to known amount of Fe3O4@PPY nanoparticles (10–80%) to known amount of Fe3O4@PPY dispersed in m-cresol solution. The mixture was shaken for 15 h at room temperature and the product was collected magnetically, washed with deionized water and methanol and dried at 70 °C for 6 hours.13 Similar procedure was followed for preparation of Fe3O4@PPY–NiO–NiS nanophotocatalyst. Each photocatalyst contained equal amount (10–80%) of NiO and NiS. Preparation scheme is given in Fig. SI3.†
2.5. Cephalexin degradation process
Degradation process was followed in a photocatalytic reactor consisting of a cylindrical Pyrex-glass cell, a medium pressure Hg lamp (30 W, Philips, II line) and florescent lamp (20 W, III line), located 10 cm above the reactor. Known amount of photocatalyst was transferred into cephalexin solution and the mixture was homogenized by proper mixing. The suspension was shaken for 0.5 h at dark till adsorption/desorption process was at equilibration. After equilibration, the mixture was irradiated by the radiation source for known period while it was agitated to ensure homogeneity. The photocatalyst was then separated from the solution by applying an external magnetic field and the concentration of cephalexin in the remaining solutions was measured by HPLC-UV. The chromatographic separation was conducted by gradient method on the ODS Hypersil C18, 250 mm × 4.7 mm, 5μ (particle size) column as the stationary phase. The mobile phase was a mixture of TBAHS (0.01 M) and methanol in the ratio of 50![[thin space (1/6-em)]](https://www.rsc.org/images/entities/char_2009.gif) :
:![[thin space (1/6-em)]](https://www.rsc.org/images/entities/char_2009.gif) 50 v/v. The flow rate was set at 1.0 mL min−1 and UV detection at 254 nm. The chromatograms of the irradiated samples showed that the retention time of cephalexin 2.5 min (ref. 15) (Fig. 1). The cephalexin peak intensity was significantly decreased after irradiation (Fig. 1b–d) rather than before degradation (Fig. 1a) indicating that the synthesized photocatalyst are effective catalysts for degradation of the pollutant. The calibration curve was plotted over the concentration range of 30–700 mg L−1 by plotting peak areas vs. cephalexin concentration. The regression equation was Y = 16.066X + 1940.6 with correlation coefficient of 0.9902. The statistical parameters of the measurement are given in Table SI2.† The stock solution was prepared by dissolving a 500 mg cephalexin tablet in de-ionized water and diluted to volume in a 100 mL volumetric flask.
50 v/v. The flow rate was set at 1.0 mL min−1 and UV detection at 254 nm. The chromatograms of the irradiated samples showed that the retention time of cephalexin 2.5 min (ref. 15) (Fig. 1). The cephalexin peak intensity was significantly decreased after irradiation (Fig. 1b–d) rather than before degradation (Fig. 1a) indicating that the synthesized photocatalyst are effective catalysts for degradation of the pollutant. The calibration curve was plotted over the concentration range of 30–700 mg L−1 by plotting peak areas vs. cephalexin concentration. The regression equation was Y = 16.066X + 1940.6 with correlation coefficient of 0.9902. The statistical parameters of the measurement are given in Table SI2.† The stock solution was prepared by dissolving a 500 mg cephalexin tablet in de-ionized water and diluted to volume in a 100 mL volumetric flask.
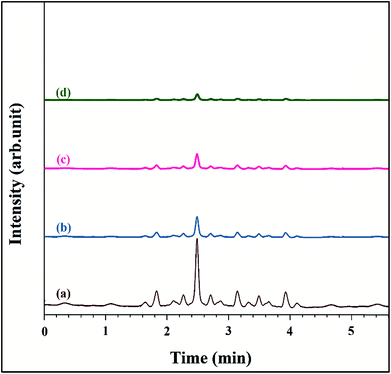 |
| | Fig. 1 Chromatographs of cephalexin before degradation (a), after degradation by Fe3O4@PPY–NiO–NiS (b), Fe3O4@PPY–NiS (c), Fe3O4@PPY–NiO (d). | |
The following equation used to calculate the degradation efficiency.
| | |
D (%) = [(Co − C)/Co] × 100
| (1) |
Co and
C are cephalexin concentration before and after irradiation respectively.
3. Results and discussion
3.1. Effect of magnetization on the separation of the used photocatalyst
From the magnetization curves illustrated in Fig. 2, it was concluded that the saturation magnetization was respectively 79.2, 55.3 and 40.2 emu. g−1 for Fe3O4, Fe3O4@PPY and Fe3O4@PPY–NiO–NiS. The lower saturation magnetization of Fe3O4@PPY, Fe3O4@PPY–NiO–NiS compared to Fe3O4 was due to the coverage of the magnetic core by non-magnetic material, PPY, NiO and NiS. Dominguez et al. who synthesized magnetic TiO2–WO3 photocatalyst to oxidize bisphenol under simulated solar light reported that after incorporation of TiO2 on Fe3O4 surface, the magnetization of core–shell was significantly lowered.16 The saturation magnetization of 40.2 emu g−1 obtained for Fe3O4@PPY–NiO–NiS was sufficient to remove the used catalyst from the solution by putting a magnet bar outside of the vessels (Fig. 2d).
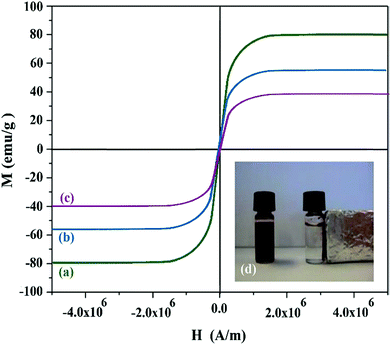 |
| | Fig. 2 Magnetization curves of Fe3O4 (a), Fe3O4@PPY (b), Fe3O4@PPY–NiO–NiS (c). | |
3.2. Characterization of the synthesized photocatalysts
In the FT-IR spectrum of Fe3O4, the adsorption bands appeared at 470, 1600 and 3400 cm−1 belonged to Fe–O and water molecules adsorbed on the surface of the sample. The peak at 1400 cm−1 was attributed to OH in-plane (Fig. 3a). In the Fe3O4@PPY spectrum, the characteristic absorption bands observed as follows; the absorption bands at 1100 and 900 cm−1 observed in Fe3O4@PPY, Fe3O4@PPY–NiS and Fe3O4@PPY–NiO spectra were respectively assigned to the CH in-plane and CH out-of-plane vibration (Fig. 3b and c).17 The peaks around 1500 and 1474 cm−1 are respectively attributed to C–N and C–C asymmetric and symmetric ring-stretching of PPY.18 The stretching band of C![[double bond, length as m-dash]](https://www.rsc.org/images/entities/char_e001.gif) C of PPY ring appeared 1400 cm−1. The weak absorption bands of NH and CH stretching vibration of polypyrrole appeared respectively at 3404 and 2358 cm−1 and the band at 3404 cm−1 related to symmetrical stretch vibration of NH group was buried under board OH peak of water molecules at 3400 cm−1.19 This results confirmed that in situ polymerization in the presence of Fe3O4 was successfully occurred and Fe3O4@PPY nanoparticles were obtained. The F–O bands were slightly shifted from 470 to lower wave number (Fig. 3b). This reflected the effect of coordination interaction between Fe3O4 nanoparticles and polypyrrole chain.18 The broad peak at 562 cm−1 related to NiO and NiS stretching shoulder corresponds to the bending vibration of metal sulfur and metal oxide bonds was observed in (Fig. 3c and d).20 The absorption band at 1600 cm−1 became stronger due to adsorption of water molecules by NiO and NiS nanoparticles.
C of PPY ring appeared 1400 cm−1. The weak absorption bands of NH and CH stretching vibration of polypyrrole appeared respectively at 3404 and 2358 cm−1 and the band at 3404 cm−1 related to symmetrical stretch vibration of NH group was buried under board OH peak of water molecules at 3400 cm−1.19 This results confirmed that in situ polymerization in the presence of Fe3O4 was successfully occurred and Fe3O4@PPY nanoparticles were obtained. The F–O bands were slightly shifted from 470 to lower wave number (Fig. 3b). This reflected the effect of coordination interaction between Fe3O4 nanoparticles and polypyrrole chain.18 The broad peak at 562 cm−1 related to NiO and NiS stretching shoulder corresponds to the bending vibration of metal sulfur and metal oxide bonds was observed in (Fig. 3c and d).20 The absorption band at 1600 cm−1 became stronger due to adsorption of water molecules by NiO and NiS nanoparticles.
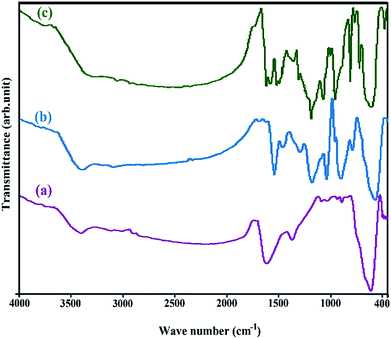 |
| | Fig. 3 FT-IR spectrums of Fe3O4 (a), Fe3O4@PPY (b), Fe3O4@PPY–NiO–NiS (c). | |
The disappearance of the peak at 3400 cm−1 related to Fe3O4 was attributed to the adsorption of moist by NiO and NiS nanocomposite (Fig. 3c and d).
In the XRD patterns of Fe3O4@PPY–NiS and Fe3O4@PPY–NiO samples given in the previously published work.13 The diffraction lines of NiO and NiS were accordingly observed in the photocatalyst patterns. The XRD patterns of newly synthesized photocatalyst (Fe3O4@PPY–NiO–NiS) given in Fig. 4d. Showed the diffraction lines of Fe3O4 appeared at 2θ of 41.5, 50.7, 63, 67, 74.5° which were in accordance with the JCPDS no. 65-107.21 The diffraction lines observed at 2θ of 18, 30, 32, 48, 50, 57 and 60° belonged to NiS and were in good agreement with the standard data (JCPDS 012-0041).22 The diffraction lines of NiO observed at 2θ of 37, 43.5, 63 and 76°.23 No diffraction line observed for PPY because of the amorphous nature of this compound.24 The average particle sizes of Fe3O4, NiO and NiS were calculated by Scherrer's equation.
| |
D = 0.94λ/β![[thin space (1/6-em)]](https://www.rsc.org/images/entities/char_2009.gif) cos cos![[thin space (1/6-em)]](https://www.rsc.org/images/entities/char_2009.gif) θ θ
| (2) |
where
D is the average size and
β stands for the full-width at half-height of the peaks. The calculated average size of Fe
3O
4, NiO and NiS were respectively 14, 25 and 18 nm and lower than the values obtained by SEM technique because PPY due to its amorphous nature was not characterized by XRD method.
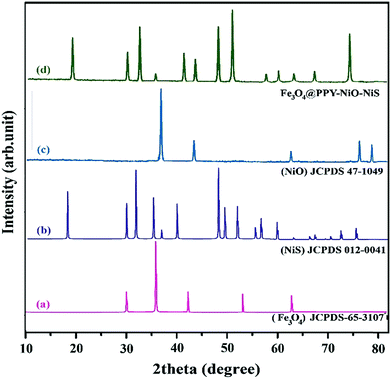 |
| | Fig. 4 XRD spectrum of standard Fe3O4 (a), standard NiS (b), standard NiO (c), Synthesized Fe3O4@PPY–NiO–NiS (d). | |
From the TEM images of Fe3O4@PPY given in the previously published work, it was concluded that the core–shell structure was formed successfully.13 SEM images of Fe3O4@PPY, Fe3O4@PPY–NiO and Fe3O4@PPY–NiO–NiS given in Fig. 5a–c. By comparison of SEM images, showed that NiO and NiS embedded on Fe3O4@PPY successfully. The particle sizes of Fe3O4@PPY–NiO and Fe3O4@PPY–NiO–NiS calculated by Image J software were respectively 60 and 65 nm. The particle size of Fe3O4@PPY and Fe3O4@PPY–NiS was reported as 40 and 50 nm respectively.13
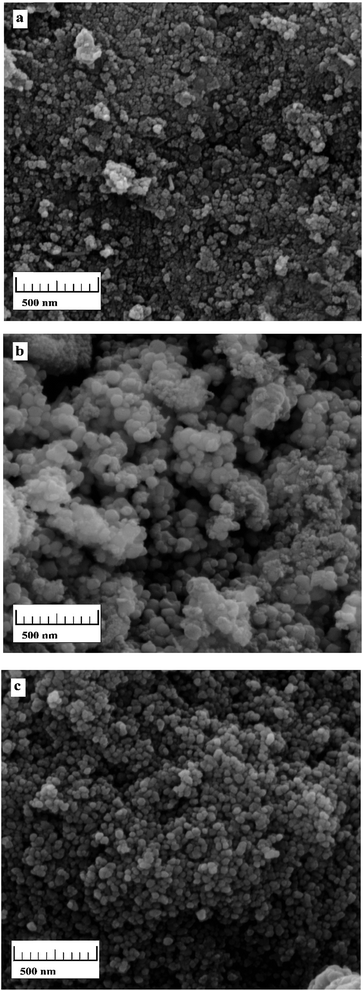 |
| | Fig. 5 SEM images of Fe3O4@PPY (a), Fe3O4@PPY–NiO (b), Fe3O4@PPY–NiO–NiS (c). | |
The increase in the particles size of Fe3O4@PPY–NiO and Fe3O4@PPY–NiO–NiS compare to Fe3O4@PPY indicated the formation of coordination bond between lone-pair electrons of N atoms of PPY and catalyst molecule.2
The elementary analysis obtained by EDAX spectra and the maps of elemental distribution of Fe3O4@PPY–NiO–NiS are given respectively in Fig. SI4 and SI5.† The percentages of the constituent atoms of Fe3O4@PPY–NiO–NiS are given in Table 3S.† The TG-DTG curves of Fe3O4@PPY–NiO–NiS taken from between 25–800 °C showed two distinct weight loss steps (Fig. 6). The first weight loss appeared around 100 °C and was attributed to the elimination of the moisture and unreacted monomers.24 The second weight loss was occurred around 500 °C and was attributed to the decomposition of PPY. In other research Ramesan reported that pure PPY decomposed initiated at 194 °C but when PPY combined with Fe3O4, initial decomposition temperature shifted to higher temperature, 220 °C.25 In this work by advantageous of combination of PPY with Fe3O4 and NiO and NiS, decomposition occur at 500 °C.
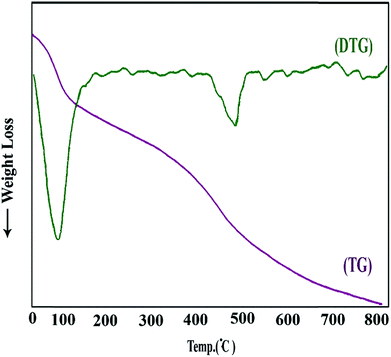 |
| | Fig. 6 Thermal curves of Fe3O4@PPY–NiO–NiS. | |
3.3. Identification of degradation products
To measure the concentration of the degradation products, they were extracted by chloroform from the irradiated solutions. The degradation products were of GC-MS was prepared (Fig. SI6†). The Mass spectra of identified degradation products of cephalexin is shown in Fig. SI7.† The extracted, analyzed by GC-MS technique and the full scan mode degradation products are listed in Table SI4† (the schematic representation given in Fig. SI8†). The peaks observed at RT = 4.6, 5.0, 7.3, 7.4, 7.5, 7.7, 7.8 and 8.0 are respectively belonged to oxime methoxy-phenyl, 3 ethoxy phenyl acetone hydroxyl oxime, 9H pyrrolo[3′,4′:3,4]pyrrolo[2,1-a]phthalazine-9,11(10H)-dione, 10-ethyl-8-phenyl, 2-ethylpyrazine, p hydroxytoluene, acetamide, n-(3-methylphenyl), benzenamine, 3-methyl-, hydrochloride, 1-(3-n-propoxyphenyl)-2-propane oxime respectively and obtained from degradation of cephalexin by the photocatalyst.
3.4. Influence of different parameters on degradation efficiency
3.4.1. Effect of catalyst support and coupling of catalysts. The main goal of this research was to increase the efficiency of the studied photocatalysts and to enhance degradation by the help of visible light. To estimate the effect of catalyst support and coupling on the band gap energy of the photocatalysts, the UV-VIS diffuse reflectance spectra were prepared (Fig. 7) and the following equation was used to calculate of the optical band gap energy of the synthesized photocatalysts| | |
Eoptg (eV) = 1240/λedge (nm)
| (3) |
where Eoptg is the optical band gap energy of photocatalyst. The number 1240 is obtained from the relationship between frequency and wavelength as described by eqn (4)where h is Planck's constant, c is the speed of light in the vacuum (3 × 10⁸ m s−1) e is the electron charge, λ (m) is the wavelength belonged to the intersection point of the vertical and horizontal parts of the spectrum.26 The number 1240 can be calculated from hc/eλ. The adsorption edge and band gap energy calculated for the studied photocatalysts is given in Table 1. The band gap energy obtained for bulk NiS and NiO of this work was close to the values reported respectively by Guo et al.22 and Nalage et al.24
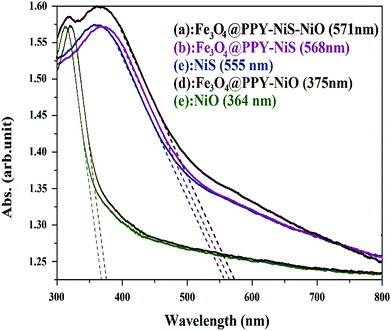 |
| | Fig. 7 DRS curves of Fe3O4@PPY–NiO–NiS, Fe3O4@PPY–NiS, Fe3O4@PPY–NiO, NiO, NiS. | |
Table 1 Absorption edges and band gap energy of photocatalysts
| No. |
Photocatalysts |
Absorption edge (nm) |
Band gap energy (eV) |
% degradation |
| 1 |
NiS |
555 |
2.23 |
54 |
| 2 |
NiO |
364 |
3.40 |
29 |
| 3 |
Fe3O4@PPY–NiS |
568 |
2.18 |
90 |
| 4 |
Fe3O4@PPY–NiO |
406 |
3.05 |
75 |
| 5 |
Fe3O4@PPY–NiO–NiS |
598 |
2.07 |
100 |
The results indicated that after immobilization of NiO on the catalyst support the band gap energy was significantly reduced and shifted from UV region to the visible region which caused higher degradation efficiency of 75%. The band gap energy of bulk NiS was in the visible region and after immobilization on the support the shift to lower energy was insignificant. The considerable increase on the degradation efficiency after immobilization was attributed to the inhibition influence of the support on the electron–hole recombination. The shift to the lower energy was more pronounced when two photocatalysts (NiO and NiS) were simultaneously grafted onto the surface of the catalyst support and the proper degradation of the pollutant was obtained by the visible light irradiation. The enhancing effect of coupled photocatalysts on the degradation efficiency has already been reported. Lucas et al. reported that by coupling of Fe3O4/TiO2 on SiO2 blue shift from 3.02 to 2.58 eV was occurred.27
The surface area of the samples was measured by Brunauer–Emmett–Teller (BET) technique (Table 2). The results indicated that after introduction of NiS and NiO onto the magnetic support, the surface area was significantly decreased. The reduction on the surface area did not influence the degradation efficiency indicating that the surface area was enough large to adsorb sufficient pollutant molecules for degradation step.
Table 2 Surface area of synthesized photocatalysts
| No. |
Catalyst type |
Surface area (m2 g−1) |
| 1 |
Fe3O4@PPY |
62.2 |
| 2 |
NiO |
53.2 |
| 3 |
Fe3O4@PPY–NiO |
34.5 |
| 4 |
NiS |
48.7 |
| 5 |
Fe3O4@PPY–NiS |
29.9 |
| 6 |
Fe3O4@PPY–NiO–NiS |
21.6 |
3.4.2. Comparative performance of photocatalysts in visible light and UV irradiation. To efficiency of the studied photocatalyst was compared under UV and visible light irradiation (Fig. 8). The results indicated that degradation the pollutant by bulk NiO under UV irradiation was more than visible light. This was in agreement with the results of DRS studies which showed that the band gap energy of NiO was in the VU region. But for NiO immobilized on the support similar degradation efficiency was obtained by UV and v light. Degradation by NiS in visible and UV irradiation was equal because of the low band gap energy as indicated in Table 1. Fe3O4@PPY–NiS also showed similar activity in visible and UV regions. The higher degradation efficiency of Fe3O4@PPY–NiS compared to bulk NiS was attributed to the inhibition influence of the support on the electron–hole recombination. Must be consider that higher degradation was done by S2 because immobilization of NiS on support prevent from recombination of e−/h+ pair. In compare study of S1 in UV and visible light similar results with S2 was obtained. In this catalyst by used of advantages of support and coupling, band gap energy is in visible range and excitation by visible light and incident photon with higher energy (UV light) was possible and equal efficiency was observed.
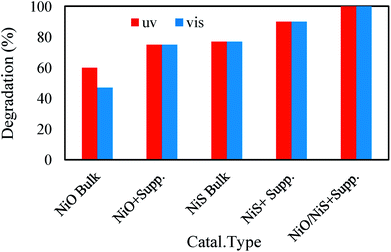 |
| | Fig. 8 Comparative performance of photocatalysts in visible light and UV irradiation. | |
3.4.3. Influence of dissolved oxygen on catalyst activity. Dissolved oxygen can produce extra OH radicals and improve the degradation process.28 Dissolved oxygen as an electron acceptor, trapped the photo induced electrons (eqn (5) and (6)) and according to reactions (eqn (7) and (8)) generated more OH radicals| | |
O2˙− + h+ → H2O2 + O2
| (6) |
| | |
O2˙− + e− → H2O2 + H+
| (7) |
| | |
H2O2 + e− → OH− + OH˙
| (8) |
Since the concentration of dissolved oxygen highly depended to the solution temperature, the activity of the photocatalyst was studied at different temperatures of 30, 40, 50 and 60 °C. The results indicated that by increasing of temperature because of reduction of dissolved oxygen the degradation efficiency was lowered (Fig. 9). The enhancing effect of dissolved oxygen on the catalysts performance has also been reported by Cavicchioli et al.28 The results obtained in this work were in agreement with those reported by Benacherine et al. who studied the photodegradation of amoxicillin by Goethite (α-FeOOH). They reported that dissolved oxygen increased the degradation efficiency.29
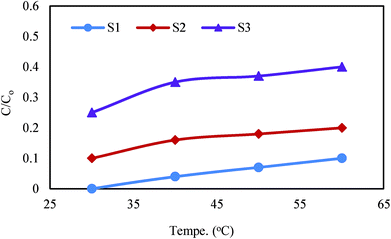 |
| | Fig. 9 Effect of temperature on degradation of cephalexin by Fe3O4@PPY–NiO–NiS (S1), Fe3O4@PPY–NiS (S2), Fe3O4@PPY–NiO (S3). | |
3.4.4. Enhancing effect of H2O2. Addition of H2O2 to the photocatalytic reaction mixture can accelerate the OH radical generation and promote the degradation of the pollutants. To study the effect of H2O2 on the degradation efficiency of Fe3O4@PPY–NiO–NiS, the concentration of hydrogen peroxide was altered between 0.01 to 0.2 M by adding appropriate amount of H2O2 (30%) (Fig. 10). The results indicated that the maximal efficiency was obtained with 0.1 M H2O2. The accelerated cephalexin degradation obtained by addition of H2O2 was attributed to the generation OH radicals through eqn (9) and (10). However the excess amount of H2O2 can trap the OH radicals by formation of weaker HO2˙ radicals (eqn (11) and (12)) which restrained the degradation efficiency.28| | |
H2O2 + e− → OH˙ + OH−
| (9) |
| | |
H2O2 + O2− → OH˙ + OH− + O2
| (10) |
| | |
H2O2 + OH˙ → H2O + OH2˙
| (11) |
| | |
HO2˙ + OH˙ → H2O + O2
| (12) |
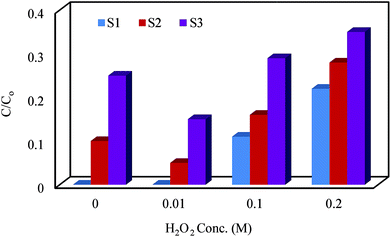 |
| | Fig. 10 Effect of H2O2 addition on degradation of cephalexin by Fe3O4@PPY–NiO–NiS (S1), Fe3O4@PPY–NiS (S2), Fe3O4@PPY–NiO (S3). | |
The effect of H2O2 on the degradation of pollutants has been extensively investigated. Bastami et al. studied the effect of hydrogen peroxide on the photocatalytic degradation of Ibuprofen in the presence of polyoxometalate-γ Fe2O3/SrCO3. They reported that addition of known concentration of H2O2 enhanced the degradation of ibuprofen but increased amount of H2O2 concentration lowered the degradation efficiency.30 Saadati et al. who studied the effect of H2O2 on the degradation of tetracycline by TiO2 reported that when the concentration of H2O2 was between 50 to 100 mg L−1, the rate constant of degradation was increased and at higher concentration the degradation was significantly decreased.31
3.4.5. Addition of organic and inorganic compounds.
3.4.5.1. Influence of organic compounds. The effect of isopropanol and benzoquinone as two organic compounds on the efficiency of the degradation process was studied. The results indicated that by addition of isopropanol to the cephalexin solution, the degradation efficiency was significantly decreased (Fig. 11).
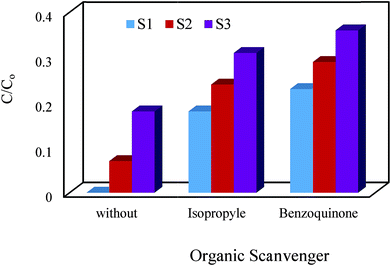 |
| | Fig. 11 Effect of organic scavenger on degradation cephalexin by Fe3O4@PPY–NiO–NiS (S1), Fe3O4@PPY–NiS (S2), Fe3O4@PPY–NiO (S3). | |
The reaction between isopropanol and OH radicals generated more stable ˙iso-prOH radicals which in turn trapped eaq− and produced less active i-prO− (eqn (13) and (14)) causing the significant decrease on ˙OH and eaq− concentration and lowered the degradation efficiency.
| | |
˙OH + i-PrOH → H2O + ˙i-prOH + i-prO˙
| (13) |
| | |
eaq− + ˙i-prOH → H˙ + i-prO−
| (14) |
Benzoquinone is a super oxide radical quencher and according to eqn (5)–(8), lowered the generation of OH radicals. Therefore isopropanol and benzoquinone acting as organic scavenger and considerably lowered the degradation efficiency of cephalexin. The influence of organic scavengers on the photocatalytic reactions has been studied by the other researches. Pelaez et al. also studied the influence of benzoquinone on the degradation of microcystin-LR by NF–TiO2 under visible light irradiation and reported that benzoquinone acting as organic scavenger lowered the activity of the photocatalyst.32 Uresti et al. studied the effect of radical scavengers on degradation of pharmaceutical pollutant and reported that the presence of 2-propanol in the degradation solution, significantly decreased the extent of degradation.33 Yan et al. reported that tert-butyl alcohol act as OH radical scavenger decreased degradation of tetracycline by Ag3PO4–PN photocatalyst.34
3.4.5.2. Influence of inorganic compounds. Many inorganic compounds including NaCl, NaHCO3 and NaNO3 are inherently present in liquid solutions and waste streams and other compound such as Na2EDTA and Na2C2O4 are frequently exist in pharmaceutical liquid wastes. Therefore, it is necessary to study the effect such compounds on the degradation of the target pollutant. In this work as presented in Fig. 12, by addition of 0.1 M of salt solutions, the degradation efficiency was studied. It was concluded that HCO3−, CO32− and Cl− imposed an inhibiting effect on the photodegradation cephalexin by scavenging h+ and OH radicals and producing ionic radicals which had lower activity than h+ and ˙OH (eqn (15)–(17)).35,36| | |
(HCO3− + CO32− + Cl−) + h+ → (HCO3˙ + CO3˙ + Cl˙)
| (15) |
| | |
(HCO3− + CO32− + Cl−) + OH˙ → (HCO3˙ + CO3˙ + Cl˙)
| (16) |
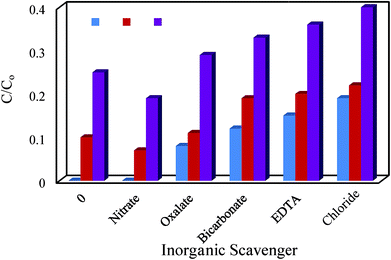 |
| | Fig. 12 Effect of inorganic scavenger on degradation cephalexin by Fe3O4@PPY–NiO–NiS (S1), Fe3O4@PPY–NiS (S2), Fe3O4@PPY–NiO (S3). | |
Similar results was observed in the presence of EDTA and oxalate anions. Theses anions acting as h+ scavenger, lowered the concentration of eliminate h+ in the solution and decreased the pollutant degradation. The results reported by other researchers were in agreement with the results of this work. Mousavi et al. reported that the presence of oxalate limited the degradation of some studied pollutants.37 Mohamed et al. who used manganese ferrite–graphene hybrid photocatalyst for elimination of water organic pollutants observed that the presence of EDTA decreased the activity of the photocatalyst.38 The presence of NO3− in degradation solution had an enhancing effect on the cephalexin degradation. The effect can be explained by the absorption spectra of NO2− and NO3− which contained weak n to π* bands at 360 nm (ε = 22.5 M−1 cm−1) with (ε = 7.4 M−1 cm−1) enabling to absorb visible and UV irradiations. Therefore the incident photons were partially absorbed by the anions and producing excited reactive radicals which lead to the formation of OH˙ and NO2˙ radicals according to the reactions (19)–(22).39 When the energy of the incident photons is not suitable to be absorbed by nitrate, the nitrate anions it acted as OH radical scavenger and limited degradation efficiency.40
| | |
[NO3−]* → NO2˙ + O˙−
| (19) |
| | |
O˙− + H2O → OH˙ + OH−
| (20) |
| | |
NO2˙ + O˙− → NO2˙ + OH˙ + OH−
| (21) |
When the scavengers such as isopropyl exist in the degradation solution, the presence of nitrate can offset the scavenger effect by generation of OH radicals via photolysis of NO3− (eqn (20) and (21)).41
3.4.6. Effect of pH on the degradation efficiency. The pH of the reaction solution can significantly influence the efficiency of the photocatalytic processes by changing the surface charge of the photocatalyst and the state of ionization of the pollutant.42 The photocatalyst preparation route also can change its chemical nature and its point of zero charge (pcz) that in turn changes the surface charge of the photocatalyst.43In this research the influence of pH on degradation efficiency was evaluated between pH = 3–9 (Fig. 13). The photocatalyst particle surfaces become protonated and positively charged at pH value lower than pHpzc and deprotonated and more negatively charged at pH higher than pHpzc. The measured pHpzc of S1, S2 and S3, was 7.3, 6.9 and 7.5 respectively and related figure embedded on top of Fig. 13. Cephalexin has pKa = 6.9 for the amine group and pKa = 2.6 for the carboxyl group. At pH higher than 6.9 it is mainly presents as the anionic form and at pH lower than 2.6, cephalexin is in the cationic form and at the pH range of 2.6–6.9 it mainly stands in zwitterion.8 The isoelectric pH (PI) at which that cephalexin becomes neutral is about 5.5. At pH lower than 2.6 the repulsion force between protonated cephalexin molecules and of catalyst surface limited the adsorption of the pollutant molecules causing lower degradation efficiency. At pH higher than 6.9, the photocatalyst surface and pollutant molecules both carried negative charges and the adsorption of cephalexin became limited.8 Additionally at alkaline solutions according to (eqn (24) and (25)) less reactive O2˙− and O2H˙ radicals are produced causing lower degradation:
| | |
OH˙ + HO2− → H2O + O2˙−
| (24) |
| | |
OH˙ + H2O2 → H2O + O2H˙
| (25) |
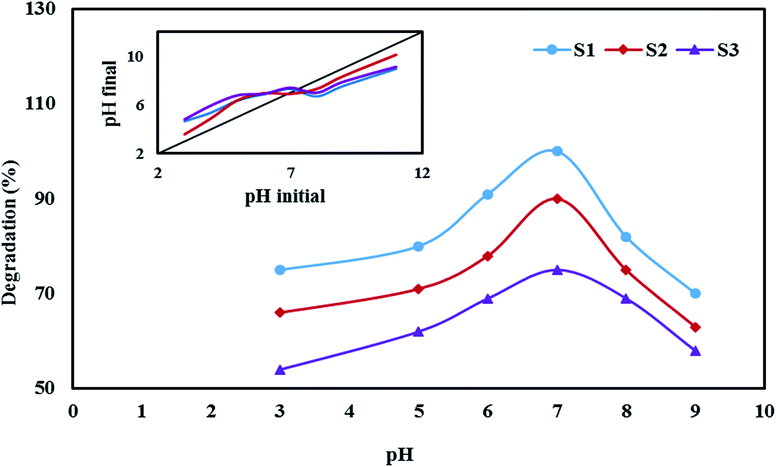 |
| | Fig. 13 Effect of pH on degradation cephalexin by Fe3O4@PPY–NiO–NiS (S1), Fe3O4@PPY–NiS (S2), Fe3O4@PPY–NiO (S3). | |
The van der Waals attraction forces between nonionized cephalexin molecules and the catalyst surface created at pH = 7.0 caused higher adsorption of the pollutant molecules which increased the degradation efficiency.8
3.5. Real sample analysis
Photocatalysts performance may be affected by the matrix of the real samples. To estimate the degradation efficiency of the synthesized photocatalyst for decomposition of cephalexin in real samples, the degradation process was conducted in tap water and the wastewater taken from pharmaceutical factory. The cephalexin concentration in the real sample measured by HPLC-UV method was lower than detection limit of the instrument. Portion of cephalexin solution was added to the real samples until its concentration was 80 mg L−1. The degradation of cephalexin was conducted under optimized conditions. The photocatalyst was separated and the cephalexin concentration was measured in the remaining solution. The results summarized in Table 3 indicated that the matrix of the sample affected the degradation efficiency of the photocatalyst. The effect was more pronounced for the pharmaceutical real sample by S2 and S3 photocatalysts. Existence of carbonate, bicarbonate, chloride and nitrate in tap water were effective factors and inhibitor on degradation of cephalexin that studied in this work. But according to literatures44,45 some organic compounds existence in wastewater which are more degradable by synthesized photocatalyst and decreased efficiency of photocatalyst at degradation of cephalexin.
Table 3 Comparison % degradation of cephalexin in various types of real sample
| No. |
Water type |
Degradation (%) |
| S1 |
S2 |
S3 |
| 1 |
Reference |
100 ± 4.3 |
90 ± 3.2 |
75 ± 4.1 |
| 2 |
Tap water |
87 ± 3.2 |
73 ± 3.9 |
62 ± 4.0 |
| 3 |
Pharmaceutical wastewater |
63 ± 4.1 |
51 ± 4.3 |
45 ± 4.8 |
3.6. Regeneration of photocatalysts
On the basis of magnetic separation, the used photocatalyst was readily separated from the solution. This helped the regeneration and reapplication of the used photocatalyst. In this work, the used photocatalyst was regenerated by heat treatment at 150 °C and 400 °C for 4 h. The heat treatment table removed the degradation products deposited on the surface of the photocatalysts (Fig. 14). It was concluded that the sample treated at 400 °C was better regenerated. The regeneration was performed for five cycles and the photocatalyst retained most of their initial activity. But after five cycles, association of degradation products on surface of photocatalysts, which cannot removed by heat treatment again, dispersion of parts of photocatalysts and aggregation of some nano size photocatalysts cause decreasing of degradation efficiency of photocatalysts. According to Fig. 14, in each cycle, S1, S2 and S3 are heat treatment in 400 °C.
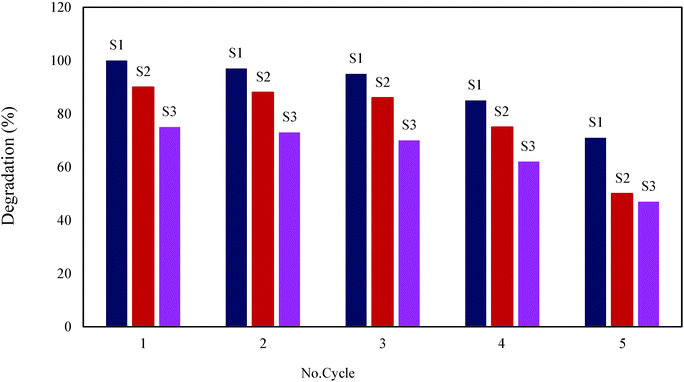 |
| | Fig. 14 Regeneration of photocatalysts: S1, S2, S3 at 400 °C. | |
4. Conclusion
The magnetic core–shell (Fe3O4@PPY) was successfully synthesized by in situ oxidative polymerization. Then the nanophotocatalysts; Fe3O4@PPY–NiS, Fe3O4@PPY–NiO, and Fe3O4@PPY–NiO–NiS were prepared by immobilization of NiO and NiS on the surface of the magnetic core–shell. The VSM measurement proved that the photocatalyst are enabled to be removed by applying appropriate external magnetic field. The synthesized photocatalysts were characterized by different techniques. The DRS studies clarified that band energy gap energy of the photocatalyst was considerably shifted to the lower energy. The shift was more serious in the coupled photocatalyst (Fe3O4@PPY–NiO–NiS). The activity of the synthesized photocatalyst under visible light was improved. The kinetic of degradation process was fast and most of degradation was obtained within 30 min of irradiations. The quality of magnetically synthesized photocatalysts were highly in terms of degradation efficiency, thermal stability and regeneration for degradation of cephalexin. Since the thermal curves indicated that as-prepared nanocomposites was thermally stable, the regeneration was readily performed by heat treatment at 400 °C. The GC-MS analysis identified degradation products obtained from cephalexin. At optimized conditions 100, 90 and 75% of the cephalexin was degraded by Fe3O4@PPY–NiO–NiS, Fe3O4@PPY–NiS and Fe3O4@PPY–NiO under visible light respectively. The coupled photocatalyst was more advantageous in terms of decreased of catalyst dosage, higher shift in band gap energy, faster kinetic of degradation process and higher degradation efficiency in real samples.
Conflicts of interest
There is no conflicts to this work.
Acknowledgements
This research was performed in the department of chemistry, Azad University, Shahreza Branch. The authors wish to acknowledge their valuable co-operations.
References
- B. Lina, J. Lyu, X. Lyu, H. Yud, Z. Hu, J. C. W. Lama and P. K. S. Lama, J. Hazard. Mater., 2015, 282, 158 CrossRef PubMed
 .
. - R. M. Jeswani, P. K. Sinha, K. S. Topagi and M. C. Damle, Int. J. PharmTech Res., 2009, 1, 527 CAS
 .
. - A. Magdziarz, J. C. Colmenares, O. Chernyayev, D. Lomot and K. Sobczak, J. Mol. Catal. A: Chem., 2016, 425, 1 CrossRef CAS
 .
. - Z. Jia, J. Kang, W. C. Zhang, W. M. Wang, C. Yang, H. Sun, D. Habibi and L. C. Zhang, Appl. Catal., B, 2017, 204, 537 CrossRef CAS
 .
. - Z. Jia, X. Duan, P. Qin, W. Zhang, W. Wang, C. Yang, H. Sun, S. Wang and L. C. Zhang, Adv. Funct. Mater., 2017, 1, 1702258 CrossRef
 .
. - Z. Jia, W. C. Zhang, W. M. Wang, D. Habibi and L. C. Zhang, Appl. Catal., B, 2016, 192, 46 CrossRef CAS
 .
. - N. F. A. Beltran, R. M. Marce, P. A. G. Gormack and F. Borrull, J. Sep. Sci., 2009, 32, 3319 CrossRef PubMed
 .
. - W. Guo, H. Wang, Y. Shi and G. Zhang, Water SA, 2010, 36, 651 CrossRef CAS
 .
. - T. Marimuthu, S. Mohamad and Y. Alias, Synth. Met., 2015, 207, 35 CrossRef CAS
 .
. - M. Z. B. Mukhlish, F. Najnin, M. M. Rahman and M. J. Uddin, J. Sci. Res., 2013, 5, 301 CAS
 .
. - M. D. Irwin, D. B. Buchholz, A. W. Hains, R. P. H. Chang and T. J. Marks, Proc. Natl. Acad. Sci. U. S. A., 2008, 105, 2783 CrossRef CAS
 .
. - J. Wang, S. Zheng, Y. Shao, J. Liu, Z. Xu and D. Zhu, J. Colloid Interface Sci., 2010, 349, 293 CrossRef CAS PubMed
 .
. - F. Torki and H. Faghihian, J. Photochem. Photobiol., A, 2017, 338, 49 CrossRef CAS
 .
. - G. Zhao, Z. Mo, P. Zhang, B. Wang, X. Zhu and R. Guo, J. Porous Mater., 2015, 22, 1245 CrossRef CAS
 .
. - S. S. Panda, B. V. V. Ravi Kumar, R. Dash and G. Mohanta, Sci. Pharm., 2013, 81, 1029 CrossRef CAS PubMed
 .
. - S. Dominguez, M. Huebra, C. Han, P. Campo, M. N. Nadagouda, M. J. Rivero, I. Ortiz and D. D. Dionysiou, Environ. Sci. Pollut. Res., 2017, 24, 12589 CrossRef CAS PubMed
 .
. - R. Turcu, O. Pana, A. Nan, I. Craciunescu, O. Chauvet and C. Payen, J. Phys. D: Appl. Phys., 2008, 41, 1 CrossRef
 .
. - S. Lamprakopoulos, D. Yfantis, A. Yfantis, D. Schmeisser, J. Anastassopoulou and T. Theophanides, Synth. Met., 2004, 14, 229 CrossRef
 .
. - S. Y. Zhao, D. K. Lee, C. W. Kim, H. G. Cha, Y. H. Kim and Y. S. Kang, Bull. Korean Chem. Soc., 2006, 27, 237 CrossRef CAS
 .
. - A. Molla, M. Sahu and S. Hussain, Sci. Rep., 2016, 6, 26034 CrossRef CAS PubMed
 .
. - M. Qiao, X. Lei, Y. Ma, L. Tian, K. Su and Q. Zhang, Ind. Eng. Chem. Res., 2016, 55, 6263 CrossRef CAS
 .
. - H. Guo, Y. Ke, D. Wang, K. Lin, R. Shen, J. Chen and W. Weng, J. Nanopart. Res., 2013, 15, 1 Search PubMed
 .
. - X. Sun, Y. Liu, H. Gao, P. X. Gao and Y. Lei, Front. Chem., 2014, 2, 1 CAS
 .
. - S. R. Nalage, S. T. Navale and V. B. Patil, Measurement, 2013, 46, 3268 CrossRef
 .
. - M. T. Ramesan, Int. J. Polym. Mater. Polym. Biomater., 2015, 62, 277 CrossRef
 .
. - J. Guo, H. Gu, H. Wei, Q. Zhang, N. Haldolaarachchige, Y. Li, D. P. Young, S. Wei and Z. Guo, J. Phys. Chem. C, 2013, 117, 10191 CAS
 .
. - M. S. Lucas, P. B. Tavares, J. A. Peres, J. L. Faria, M. Rocha, C. Pereira and C. Freire, Catal. Today, 2013, 209, 116 CrossRef CAS
 .
. - A. Cavicchioli and I. G. R. Gutz, J. Braz. Chem. Soc., 2002, 13, 441 CrossRef CAS
 .
. - M. M. Benacherine, N. Debbache, I. Ghoul and Y. Mameri, J. Photochem. Photobiol., A, 2017, 335, 70 CrossRef CAS
 .
. - T. R. Bastami and A. Ahmadpour, Environ. Sci. Pollut. Res. Int., 2016, 9, 8849 CrossRef PubMed
 .
. - F. Saadati, N. Keramati and M. M. Ghazi, Crit. Rev. Environ. Sci. Technol., 2016, 46, 757 CrossRef CAS
 .
. - M. Pelaez, P. Falaras, V. Likodimos, K. O'Shea, A. A. de la Cruz, P. S. M. Dunlop, J. A. Byrne and D. D. Dionysiou, J. Mol. Catal. A: Chem., 2016, 425, 183 CrossRef CAS
 .
. - D. B. H. Uresti, A. Vazquez, D. S. Martinezc and S. Obregona, J. Photochem. Photobiol., A, 2016, 324, 47 CrossRef
 .
. - Q. Yan, M. M. Xu, C. P. Lin, J. F. Hu, Y. G. Liu and R. Q. Zhang, Environ. Sci. Pollut. Res. Int., 2016, 23, 14422 CrossRef CAS PubMed
 .
. - A. G. Rincon and C. Pulgarin, Appl. Catal., B, 2004, 51, 283 CrossRef CAS
 .
. - D. Hou, R. Goei, X. Wang, P. Wang and T. T. Lim, Appl. Catal., B, 2012, 126, 121 CrossRef CAS
 .
. - M. Mousavi, A. Habibi-Yangjeh and M. Abitorabi, J. Colloid Interface Sci., 2016, 480, 218 CrossRef CAS PubMed
 .
. - M. M. Mohamed, I. Ibrahim and T. M. S. Benh, Appl. Catal., A, 2016, 524, 182–191 CrossRef CAS
 .
. - E. Koumaki, D. Mamais, C. Noutsopoulos, M. C. Nik, A. A. Bletsou, N. S. Thomaidis, A. Eftaxias and G. Stratogianni, Chemosphere, 2015, 138, 675 CrossRef CAS PubMed
 .
. - R. Andreozzi, M. Raffaele and P. Nicklas, Chemosphere, 2003, 50, 1319 CrossRef CAS PubMed
 .
. - J. Mack and J. R. Bolton, J. Photochem. Photobiol., A, 1999, 128, 1 CrossRef CAS
 .
. - O. Dalrymple, D. Yeh and M. Trotz, J. Chem. Technol. Biotechnol., 2007, 82, 121 CrossRef CAS
 .
. - T. Suponik, A. Winiarski and J. Szade, Water, Air, Soil Pollut., 2015, 226, 360 CrossRef PubMed
 .
. - R. H. Stephen, J. W. Rodney, M. J. Jill, D.
C. Jeffery, G. S. Steven and J. R. Barbara, Scientific Investigations Report, 2005, pp. 5055, Version 1.1, 2009 Search PubMed
 .
. - J. Cotruvo, Pharmaceuticals in Drinking-water, World Health Organization, 2011, pp. 1–35 Search PubMed
 .
.
Footnote |
| † Electronic supplementary information (ESI) available. See DOI: 10.1039/c7ra09461b |
|
| This journal is © The Royal Society of Chemistry 2017 |
Click here to see how this site uses Cookies. View our privacy policy here.  Open Access Article
 * and
H. Faghihian
![[thin space (1/6-em)]](https://www.rsc.org/images/entities/char_2009.gif) :
:![[thin space (1/6-em)]](https://www.rsc.org/images/entities/char_2009.gif) 50 v/v. The flow rate was set at 1.0 mL min−1 and UV detection at 254 nm. The chromatograms of the irradiated samples showed that the retention time of cephalexin 2.5 min (ref. 15) (Fig. 1). The cephalexin peak intensity was significantly decreased after irradiation (Fig. 1b–d) rather than before degradation (Fig. 1a) indicating that the synthesized photocatalyst are effective catalysts for degradation of the pollutant. The calibration curve was plotted over the concentration range of 30–700 mg L−1 by plotting peak areas vs. cephalexin concentration. The regression equation was Y = 16.066X + 1940.6 with correlation coefficient of 0.9902. The statistical parameters of the measurement are given in Table SI2.† The stock solution was prepared by dissolving a 500 mg cephalexin tablet in de-ionized water and diluted to volume in a 100 mL volumetric flask.
50 v/v. The flow rate was set at 1.0 mL min−1 and UV detection at 254 nm. The chromatograms of the irradiated samples showed that the retention time of cephalexin 2.5 min (ref. 15) (Fig. 1). The cephalexin peak intensity was significantly decreased after irradiation (Fig. 1b–d) rather than before degradation (Fig. 1a) indicating that the synthesized photocatalyst are effective catalysts for degradation of the pollutant. The calibration curve was plotted over the concentration range of 30–700 mg L−1 by plotting peak areas vs. cephalexin concentration. The regression equation was Y = 16.066X + 1940.6 with correlation coefficient of 0.9902. The statistical parameters of the measurement are given in Table SI2.† The stock solution was prepared by dissolving a 500 mg cephalexin tablet in de-ionized water and diluted to volume in a 100 mL volumetric flask.

![[double bond, length as m-dash]](https://www.rsc.org/images/entities/char_e001.gif) C of PPY ring appeared 1400 cm−1. The weak absorption bands of NH and CH stretching vibration of polypyrrole appeared respectively at 3404 and 2358 cm−1 and the band at 3404 cm−1 related to symmetrical stretch vibration of NH group was buried under board OH peak of water molecules at 3400 cm−1.19 This results confirmed that in situ polymerization in the presence of Fe3O4 was successfully occurred and Fe3O4@PPY nanoparticles were obtained. The F–O bands were slightly shifted from 470 to lower wave number (Fig. 3b). This reflected the effect of coordination interaction between Fe3O4 nanoparticles and polypyrrole chain.18 The broad peak at 562 cm−1 related to NiO and NiS stretching shoulder corresponds to the bending vibration of metal sulfur and metal oxide bonds was observed in (Fig. 3c and d).20 The absorption band at 1600 cm−1 became stronger due to adsorption of water molecules by NiO and NiS nanoparticles.
C of PPY ring appeared 1400 cm−1. The weak absorption bands of NH and CH stretching vibration of polypyrrole appeared respectively at 3404 and 2358 cm−1 and the band at 3404 cm−1 related to symmetrical stretch vibration of NH group was buried under board OH peak of water molecules at 3400 cm−1.19 This results confirmed that in situ polymerization in the presence of Fe3O4 was successfully occurred and Fe3O4@PPY nanoparticles were obtained. The F–O bands were slightly shifted from 470 to lower wave number (Fig. 3b). This reflected the effect of coordination interaction between Fe3O4 nanoparticles and polypyrrole chain.18 The broad peak at 562 cm−1 related to NiO and NiS stretching shoulder corresponds to the bending vibration of metal sulfur and metal oxide bonds was observed in (Fig. 3c and d).20 The absorption band at 1600 cm−1 became stronger due to adsorption of water molecules by NiO and NiS nanoparticles.
![[thin space (1/6-em)]](https://www.rsc.org/images/entities/char_2009.gif) cos
cos![[thin space (1/6-em)]](https://www.rsc.org/images/entities/char_2009.gif) θ
θ


.
.
.
.
.
.
.
.
.
.
.
.
.
.
.
.
.
.
.
.
.
.
.
.
.
.
.
.
.
.
.
.
.
.
.
.
.
.
.
.
.
.
.
.
.


