 Open Access Article
Creative Commons Attribution 3.0 Unported Licence
Efficient conversion of acetate into phloroglucinol by recombinant Escherichia coli
Xin Xu ab,
Mo Xian*a and
Huizhou Liu*a
aCAS Key Laboratory of Biobased Materials, Qingdao Institute of Bioenergy and Bioprocess Technology, Chinese Academy of Sciences, Qingdao 266101, China. E-mail: xianmo@qibebt.ac.cn; Liuhuizhou@qibebt.ac.cn; Fax: +86 532 80662765; Tel: +86 532 80662765
bUniversity of Chinese Academy of Sciences, Beijing, 100049, China
First published on 1st November 2017
Abstract
Phloroglucinol, an important fine chemical, was attempted to be produced by a recombinant Escherichia coli, using acetate, a less costly feedstock, as a alternative carbon source. Phloroglucinol was significantly produced by assembling an acetate assimilation pathway and phloroglucinol biosynthetic pathway in an engineered Escherichia coli strain. Subsequently, the culture conditions were optimized to enhance phloroglucinol production with a maximum titer of 554 mg L−1. Finally, fed-batch fermentation of phloroglucinol was evaluated using the optimized culture conditions, and reached a maximum concentration of 1.20 g L−1. The productivity (0.74 g per g DCW) and yield (0.18 g per g acetate) increased by 3.20-fold and 1.64-fold, respectively, compared with the data using glucose as the carbon source. Therefore, the engineered E. coli cells can be directly emplored for phloroglucinol biosynthesis from acetate with better atom economy and lower cost.
1 Introduction
Phloroglucinol is an important fine chemical for multiple applications. It can be used as a medical intermediate, an antioxidant, and a smooth muscle relaxant.1,2 Recently, the biosynthetic pathway of phloroglucinol from sugar has been constructed in recombinant E. coli.2,3 However, with global food shortages and increasing demand for phloroglucinol, researchers have focused on non-food substrates as alternative feedstocks. Acetate has been considered as a potential low-cost carbon source, since it could be generated in both biological and chemical processes, including acidogenesis, acetogenesis, methanogenesis and syngas fermentation.4–7 Zhang et al. successfully produced phloroglucinol from acetate by in vitro reaction.8 However, the costings and nonrecycling of the enzymes used in vitro were the main obstacles. It is still an attractive avenue to convert acetate into phloroglucinol in vivo.Escherichia coli is one of the most commonly used host in biochemical industry. Acetate metabolism pathway in E. coli has been basically clarified: acetate accumulated due to metabolic overflow of excess glucose, while it also could be used as a carbon source during glucose starvation.9 In E. coli, acetate is converted into acetyl-CoA via two pathway with different efficiency: the higher-efficient pathway, catalyzed by AMP-forming acetyl-CoA synthetase (acs), and the lower-efficient pathway, catalyzed by phosphotransacetylase/acetate kinase (pta-ackA). Subsequently, acetyl-CoA enters the central carbon metabolism (citric acid cycle and glyoxylate bypass), providing energy and precursors for cell growth.9,10 Several chemicals, such as free fatty acids, succinic acid, and mevalonate, have been successfully produced from acetate by engineered E. coli strain.11–13 Previous studies have provided some information of using acetate to generate acetyl-CoA pool. Nevertheless, there are still two tone challenges in the phloroglucinol biosynthesis from acetate. One is the lower energy value of acetate, compared with glucose and other carbohydrates.12 In acetate assimilation, the flux flowing to glycolysis bypass and pentose phosphate pathway nearly shut down. However, some important cofactors, such as ATP and NAD(P)H, were generated in both of the two pathways when E. coli cultivated on glucose.12,14–16 Considering that the transformation of acetyl-CoA to phloroglucinol consumes ATP,2,3 the energy produced by acetate assimilation might be insufficient to maintain cell growth and product synthesis. The other is the toxicity of phloroglucinol to strains. It has been reported that phloroglucinol significantly inhibited E. coli cell growth at a concentration of 500 mg L−1, when added externally into a culture grown in a glucose medium.17
Energy limitation and inhibitory effect of phloroglucinol might also be the reasons of poor carbon conversion. Studies have been performed to improve the energy supply and tolerance of host with glucose as the carbon source. For instance, PEPCK (ATP-forming phosphoenolpyruvate carboxykinase, encoded by pck) was overexpressed to harbor higher ATP concentration in E. coli,18,19 and a multiple antibiotic resistance marA was overexpressed to enhance phloroglucinol resistance and elevate phloroglucinol production.2 However, the effects of these genes have not been verified with acetate as the carbon source. In this study, acetate assimilation pathway and phloroglucinol biosynthetic pathway were assembled in an engineered E. coli strain, and pckA and marA were overexpressed to enhance the production of phloroglucinol from acetate. Then, culture conditions were optimized, and the dual inhibitory effect of acetate and phloroglucinol on cells was investigated. Finally, pH-couple fed fermentation was carried out, reached a titer of 1.2 g L−1, with increased productivity (0.74 g per g DCW) and yield (0.18 g per g acetate), compared with the data using glucose as the carbon source. Therefore, this study provided a strategy with better atom economy and lower cost for phloroglucinol biosynthesis.
2 Materials and methods
2.1 Strains construction
All plasmids and strains used in this study are listed in Table 1. E. coli W3110 genomic DNA was amplified by PCR as a template to obtain the pckA gene using primers pckA-F (5′-CCGGGATCCATGCGCGTTAACAATGGT-3′) and pckA-R (5′-TTGCTGCAGTTACAGTTTCGGACCAGCC-3′). The PCR product was cloned into the pCOLADuet-acs between the BamHI and PstI sites, resulting in pCOLADuet-acs-pckA. The acc and phlD genes were cloned into pACYCDuet-1, resulting in plasmid pAZRB. The marA gene was cloned into plasmid pAZRB, resulting in plasmid pZRB. Subsequently, pCOLADuet-1 and pAZRB were transformed into E. coli BL21 (DE3) to generate E. coli XU150. PCOLADuet-1 and pZRB were transformed into E. coli BL21 (DE3) to generate E. coli XU151. Plasmids pCOLADuet-acs and pZRB were transformed into E. coli BL21 (DE3) to generate E. coli XU152. Plasmids pCOLADuet-acs-pckA and pZRB were transformed into E. coli BL21 (DE3) to generate E. coli XU153.| Strains and plasmids | Characteristic | Reference |
|---|---|---|
| Strains | ||
| E. coli W3110 | DNA template for amplification | TIANGEN |
| E. coli DH5α | Host for general cloning | TIANGEN |
| E. coli BL21 (DE3) | Host for protein expression | Novagen |
| XU150 | E. coli BL21(DE3)/pCOLADuet/pAZRB | This study |
| XU151 | E. coli BL21(DE3)/pCOLADuet/pZRB | This study |
| XU152 | E. coli BL21(DE3)/pCOLADuet-acs/pZRB | This study |
| XU153 | E. coli BL21(DE3)/pCOLADuet-acs-pckA/pZRB | This study |
![[thin space (1/6-em)]](https://www.rsc.org/images/entities/char_2009.gif) |
||
| Plasmids | ||
| pCOLADuet™-1 | ColA origin, Kanr | Novagen |
| pACYCDuet-1 | p15A (pACYC184), Cmr | Novagen |
| pCOLADuet-acs | pCOLADuet-1 carrying acs from E. coli W3110 | X. Xu, et al.12 |
| pCOLADuet-acs-pckA | pCOLADuet-1 carrying acs from E. coli W3110 | This study |
| pAZRB | pACYCDuet-1 carrying acc and phlD | This study |
| pZRB | pACYCDuet-1 carrying acc, marA and phlD | This study |
2.2 Media
Primary seed cultures of XU153 were grown in LB medium containing 10 g L−1 tryptone, 5 g L−1 yeast extract, and 10 g L−1 NaCl. The fermentation minimal medium contained (per liter): 2.5 g of KH2PO4, 3 g of (NH4)2SO4, 1 g of citric acid·H2O, 1.86 g of KCl, 0.08 g of FeSO4·7H2O, 0.24 g of MgSO4·7H2O, 1 g of betaine, 2 g of beef powder, and 1 mL of trace elements solution. As the carbon source, the initial concentrations of sodium acetate in shake-flask and fed-batch fermentation were 8.2 g L−1 and 2 g L−1, respectively. The trace elements stock solution contained (per liter): 2.9 g of ZnSO4·7H2O, 3.7 g of (NH4)6Mo7O24·4H2O, 24.7 g of H3BO3, 2.5 g of CuSO4·5H2O, and 15.8 g of MnCl2·4H2O. Kan (100 μg mL−1) and Cm (34 μg mL−1) were added when necessary.2.3 Analytical methods
Biomass was determined by measuring the optical density of the culture sample at 600 nm (1 OD unit = 0.43 DCW per L). Acetate concentration was determined by performing HPLC with an aminex HPX-87H ion exclusion column (Bio-Rad, USA). The concentration of phloroglucinol in the fermentation supernatant was quantified from the 446 nm value using the colorimetric reaction at between cinnamaldehyde and phloroglucinol.202.4 Optimization of culture conditions
Optimization of culture conditions was performed in shake-flask experiments in triplicate series of 500 mL shake flasks containing 100 mL of culture medium incubated with the strain XU153. E. coli strains were cultured in a shaker incubator at 37 °C and 180 rpm firstly. When the OD600 reached 0.6–0.8, IPTG was added to a final concentration of 150 μM, and the culture was further incubated at 30 °C for 24 h. Then, samples were withdrawn to determine cell mass and metabolite concentrations.2.5 Toxicity of commercial phloroglucinol to E. coli
The shake-flask culture was incubated in 100 mL fermentation medium and cultured at a temperature of 30 °C (180 rpm). When OD600 of the bacterial culture reached 0.6–0.8, IPTG was added. Then the different concentrations of commercial phloroglucinol (0 g L−1, 0.5 g L−1, 1 g L−1 and 2.0 g L−1) were fed respectively to the test samples. The growth of the bacterial was determined by measuring the OD600 with a spectrophotometer (Cary 50 UV-Vis, Varian) at 8 h, 14 h, 20 h, 32 h and 38 h. The inhibition rate (IR) was calculated by the following equation:| IR = (OD600C − OD600s)/OD600C × 100% |
2.6 Fed-batch fermentation
The strain XU153 harboring pCOLADuet-acs-pckA and pZRB was inoculated to 5 mL of LB medium (primary seed culture), and then 100 mL fresh fermentation medium was inoculated with the 5 mL overnight primary seed cultures (second seed culture). The overnight second seed culture were inoculated a 5 L fermentor (BIOSTAT Bplus MO5L, Sartorius, Germany) containing 2 L fermentation medium. The temperature was maintained at 37 °C firstly, and then 30 °C after induced. During the fermentation process, pH was automatically maintained at 7.0 with ammonia and sulfuric acid, and stirring speed was first set at 400 rpm and then linked to the dissolved oxygen (DO) concentration to maintain a 20% saturation of DO (air flow velocity of 1.5 L min−1). To initiate heterogenous genes expression, IPTG was added, at a final concentration of 50 μM, as OD600 was around 0.75. When initial carbon source was depleted, feeding medium (3 M sodium acetate) was fed continuously to maintain an acetate concentration below 1.5 g L−1 in fermentation broth. Samples were withdrawn to determine cell mass and concentration of acetate and phloroglucinol. The productivity of phloroglucinol to dry cell weight was calculated by the following equation:| Qp = Gp/GDCW |
Conversion efficiency (gram to gram) of acetate to phloroglucinol was calculated by the following equation:
| Yp = Gp/Gs |
3 Results and discussion
3.1 Pathway construction for phloroglucinol production from acetate
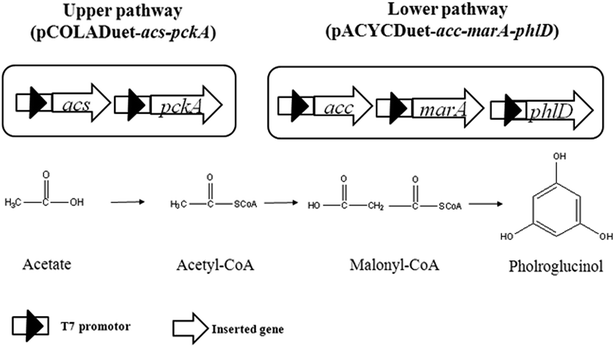
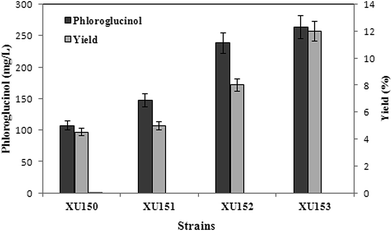
As shown in Fig. 1, acetate can be converted to acetyl-CoA through acetyl-CoA synthase (encoded by acs) pathway, which is driven by ATP (upper pathway).10 Four acetyl-CoA carboxylase subunits (encoded by accADBC) catalyze acetyl-CoA to form malonyl-CoA, and then to phloroglucinol by polyketide synthase (encoded by phlD) (lower pathway).2,3 To construct lower pathway, accADBC from Escherichia coli, and phlD from Pseudomonas fluorescens, were chosen, as these genes were verified to be key genes of phloroglucinol biosynthesis. The engineered strain was named XU150. Since marA gene might improve the resistance of E. coli to phloroglucinol,2 it was also overexpressed in XU150, resulting in XU151. To strengthen the upper pathway, the gene acs from Escherichia coli, which was widely used in previous studies, was introduced into XU151, resulting in the engineered strain XU152. Further, gene pckA was also overexpressed in XU152, causing it previously shown to be more efficient for ATP generation.17,18 The engineered strain XU153 was constructed with assembly in of acs, pckA, accADBC, marA from Escherichia coli, and phlD from Pseudomonas fluorescens.All of the engineered strains showed phloroglucinol titers in flask cultivation using acetate as the sole carbon source. Due to overexpressing marA, 147 mg L−1 phloroglucinol was obtained from E. coli strain XU151, while the data of the control strain XU150 was only 106 mg L−1 after 48 h cultivation. And overexpression of acs and pckA in XU153 increased the phloroglucinol titer to 263 mg L−1. The phloroglucinol production efficiency in XU153 was approximately 2.5-fold greater than that of XU150. The strain XU153 also exhibited a drastic increase in phloroglucinol yield compared to XU150: the yield reached 0.12 g per g acetate, a 2.4-fold increase (Fig. 2). These results provided that overexpressing marA was beneficial for phloroglucinol synthesis from acetate. This may be due to that MarA, a general resistance transcriptional activator, might improve the resistance of E. coli to phloroglucinol – the positive effect has been verified when cultured in a glucose medium.2 The results also indicated co-expression of acs and pckA causing an apparent increase in acetate-derived phloroglucinol biosynthesis. The importance of acs gene in acetate assimilation has been verified in previous studies.9,11 The positive effect of overexpression of pckA gene may be described to two reasons. First, the reaction catalyzed by PEPCK generates ATP,17,18 and ATP is essential for phloroglucinol biosynthesis from acetate. Second, the increased level of PEPCK improved the activity of anaplerotic pathway.16,17 Such a response seems to benefit ATP regeneration and PEP utilization – and is also favorable to phloroglucinol production.
3.2 Investigating the theoretical phloroglucinol yields
The stoichiometry of phloroglucinol synthesis (lower pathway) is calculated with eqn (1).2,3| 3C2H3O-CoA + 2ATP → C6H6O3 + 3CoASH + 2ADP + 2Pi | (1) |
We assume that 2 mole of ATP are required for producing 1 mole of acetyl-CoA from acetate,10 thus eqn (2) was deduced.
| 3C2H4O2 + 8ATP → C6H6O3 + 3H2O + 8ADP + 8Pi | (2) |
1 mole of phloroglucinol synthesis requires 8 moles of ATP that can be produced by oxidizing 0.8 moles of acetate.10 Thereby, 1 mole of phloroglucinol production consumes 3.8 moles of acetate, resulting in the theoretical phloroglucinol yield of 0.55 g per g acetate, which is higher than the data of glucose as the carbon source (0.46 g per g glucose).2 That is due to the metabolism difference between glucose and acetate. Glucose is converted into pyruvic acid via glycolysis. Subsequently, pyruvic acid combines with CoASH to form acetyl-CoA, leading to loss of carbon dioxide. However, the metabolic flux through the above pathways, as well as the carbon loss, could be negligible in acetate assimilation.12,14,15 According to the result, it is expected to achieve better atom economy and higher productivity of phloroglucinol biosynthesis from acetate.
3.3 Optimization of culture conditions
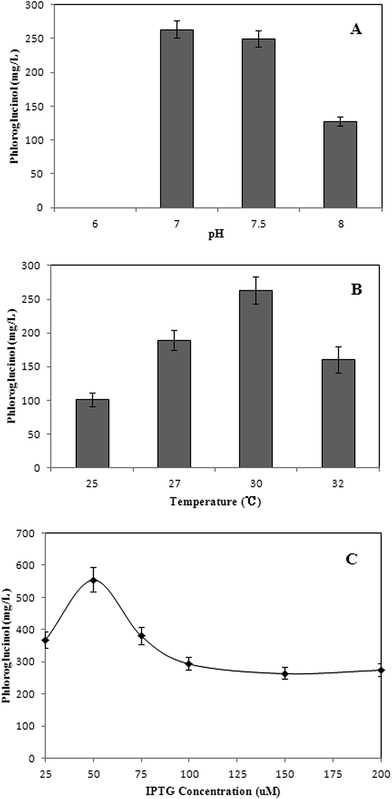
Fermentation culture conditions have a vital effect on the formation, concentration and yield of the end-product.21–23 In this study, the three most important factors, pH, induction temperature, and inducer concentration were optimized to improve phloroglucinol production from acetate through single factor test.
CH3COO− + H2O ![[left over right harpoons]](https://www.rsc.org/images/entities/char_21cb.gif) CH3COOH + OH− CH3COOH + OH−
| (3) |
pH of 6, 7, 7.5, and 8 were assessed to investigate the effect of pH on phloroglucinol production (Fig. 3A). pH of the medium is important as it couples transmembrane pH gradient. It also could induce complex regulatory responses of E. coli, including gene expression pattern, enzymes activities and metabolic flux shift. Strain XU153 did not grow with the initial pH of 6.0, possibly because the acidic environments negatively affected internal osmotic pressure.9,10 Therefore, the optimal pH for phloroglucinol production from acetate was around 7.0.
Therefore, the optimal culture condition for phloroglucinol production was pH of 7.0 and temperature of 30 °C at the concentration of 50 μM IPTG using the engineered strain XU153.
3.4 Inhibitory effect of phloroglucinol to E. coli in the acetate medium
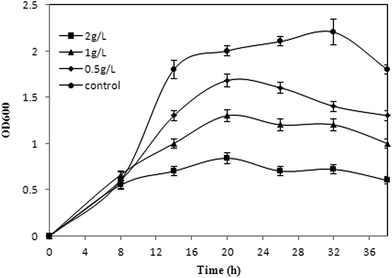
Inhibitory effect of products to the hosts is common in biosynthesis of chemicals.30,31 The toxicity of phloroglucinol to E. coli cell growth in a glucose medium has been verified.17 Considering the stresses on cells caused by acetate, the potential dual inhibition of substrate and product needs to be investigated. The commercial phloroglucinol imparts toxicity to E. coli when added exogenously to the acetate medium after induction (Fig. 4). E. coli cell growth was comparable at 0 g L−1 and up to 2 g L−1 of exogenously added phloroglucinol. The strain can grow in 2 g L−1 phloroglucinol with inhibiting rates of 58% after inoculation and cultured for 36 hours (Fig. 4). The results indicated that phloroglucinol resistance of XU153 might be enhanced by overexpressed marA gene, compared with the reported inhibition concentration in a glucose medium (500 mg L−1 phloroglucinol).17 However, toxicity of phloroglucinol still cannot be neglected, especially at high concentrations. There have been several effective efforts on the fermentation process to get high titers, including membrane technology and in situ product removal.25 Furthermore, construction of end-product export systems, activation of general stress response genes, and expression of heat shock proteins, also can be used to improve the tolerance of the hosts.31–333.5 Phloroglucinol production by XU153 using acetate as the sole carbon source in fed-batch fermentation
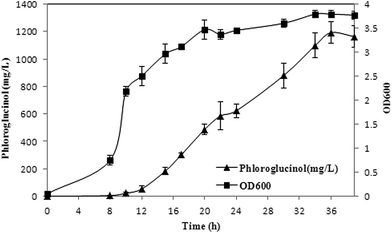
pH-coupled fed-batch fermentation was carried out with XU153 using acetate as the sole carbon source in the optimized culture conditions. Sodium acetate was added continuously when the initial carbon source was exhausted which was indicated by the sharp rise of DO. Biomass, phloroglucinol accumulation and acetate consumption were monitored over the course of fermentation. As is shown in Fig. 5, phloroglucinol production increased rapidly from 2 h to 28 h after induction. After the cultures were induced for 28 h, phloroglucinol reached a maximum concentration of 1.20 g L−1. Simultaneously, the yield of 0.18 g per g acetate was 1.64-fold of the corresponding data using glucose as a carbon source. Phloroglucinol production from acetate was also much higher (0.74 g per g DCW) than that achieved with glucose (0.23 g per g DCW), a 3.2-fold increased (Table 2).3 The results consisted with the calculation of theoretical phloroglucinol yield discussed above. Therefore, with increased atom economy and higher productivity, it is a significant pathway of phloroglucinol biosynthesis from acetate by XU153.| Carbon source | DCWmax (g L−1) | Phloroglucinol (g L−1) | Qp (g per g DCW) | Yp (g per g substrate) | Reference |
|---|---|---|---|---|---|
| Acetate | 1.63 ± 0.05 | 1.20 ± 0.08 | 0.74 ± 0.03 | 0.18 ± 0.04 | This study |
| Glucose | ∼16.5 | ∼3.8 | ∼0.23 | ∼0.11 | Y. Cao, et al.2 |
The maximum cell density of the engineered strain was only about 3.79 (OD600), with a phloroglucinol concentration of 1.20 g L−1. Both of the biomass and the titer were rather low for the fed-batch fermentation of E. coli strains. The main reason might lie in the dual inhibition of the substrate and product, which was proved by the experiment of inhibitory effect. Meanwhile, the burden of cell metabolism caused by overexpression of heterologous genes may be another reason. Several possible improvements can be achieved to enhance cell growth and phloroglucinol production. One approach is to optimize the fermentation process by reducing the toxicity of substrate and product, such as in situ product removal, membrane technology and a two-stage fermentation using different substrates.12,34,35 Genetic modification of the host is another possible approach: chromosome integration technique to decrease burden of cell metabolism,36 construction of end-product export systems, activation of general stress response genes, and expression of heat shock proteins to improve the tolerance of the host.30–32
4 Conclusions
In this study, phloroglucinol was produced by assembling acetate assimilation pathway and phloroglucinol biosynthetic pathway in an engineered E. coli strain, using acetate as the sole carbon source. Subsequently, the culture process conditions were optimized to enhance phloroglucinol production. Finally, we also evaluated the fed-batch fermentation of phloroglucinol using the optimized culture process conditions, and phloroglucinol reached a maximum concentration of 1.20 g L−1. The productivity (0.74 g per g DCW) and yield (0.18 g per g acetate) increased by 3.20-fold and 1.64-fold, respectively, compared with the data using glucose as the carbon source. In summary, this study provided a strategy to enhance atom economy of phloroglucinol biosynthesis in E. coli with low-cost acetate as the feedstock.Conflicts of interest
There are no conflicts to declare.Acknowledgements
This work was supported by National Natural Science Foundation of China (21572242 and 21376255), and Taishan Scholars Climbing Program of Shandong (No. tspd20150210).References
- I. P. Singh and S. B. Bharate, Nat. Prod. Rep., 2006, 23, 558–591 RSC.
- Y. Cao, X. Jiang, R. Zhang and M. Xian, Appl. Microbiol. Biotechnol., 2011, 91, 1545–1552 CrossRef CAS PubMed.
- J. Achkar, M. Xian, H. Zhao and J. W. Frost, J. Am. Chem. Soc., 2005, 127, 5332–5333 CrossRef CAS PubMed.
- R. A. Periana, O. Mironov, D. Taube, G. Bhalla and C. J. Jones, Science, 2003, 301, 814–818 CrossRef CAS PubMed.
- C. Ni, X. Wu, J. Dan and D. Du, Sep. Purif. Technol., 2014, 132, 23–26 CrossRef CAS.
- Z. Zhu, N. Sathitsuksanoh, T. Vinzant, D. J. Schell, J. D. McMillan and Y. H. P. Zhang, Biotechnol. Bioeng., 2009, 103, 715–724 CrossRef CAS PubMed.
- C. M. Pradeep and K. Samir, Bioresour. Technol., 2010, 101, 5013–5022 CrossRef PubMed.
- R. Zhang, W. Liu, Y. Cao, X. Xu, M. Xian and H. Liu, BMC Biotechnol., 2017, 66 DOI:10.1186/s12896-017-0376-z.
- H. Lin, N. M. Castro, G. N. Bennett and K. Y. San, Appl. Microbiol. Biotechnol., 2006, 71, 870–874 CrossRef CAS PubMed.
- A. J. Wolfe, Microbiol. Mol. Biol. Rev., 2005, 69, 12–50 CrossRef CAS PubMed.
- Y. Xiao, Z. Ruan, Z. Liu, S. Wu, A. Varman, Y. Liu and Y. Tang, Biochem. Eng. J., 2013, 76, 60–69 CrossRef CAS.
- X. Xu, M. Xie, Q. Zhao, M. Xian and H. Liu, Bioengineered, 2017 DOI:10.1080/21655979.2017.1323592.
- Y. Li, B. Huang, H. Wu, Z. Li, Q. Ye and Y. H. P. Zhang, ACS Synth. Biol., 2016, 5, 1299–1307 CAS.
- M. K. Oh, L. Rohlin, K. C. Kao and J. C. Liao, J. Biol. Chem., 2002, 277, 13175–13183 CrossRef CAS PubMed.
- J. Zhao and K. Shimizu, J. Biotechnol., 2003, 101, 101–117 CrossRef CAS PubMed.
- G. Zhu, B. Golding and A. M. Dean, Science, 2005, 307, 1279–1282 CrossRef CAS PubMed.
- F. Yang and Y. Cao, Appl. Microbiol. Biotechnol., 2012, 93, 487–495 CrossRef CAS PubMed.
- Y. D. Kwon, S. Y. Lee and P. Kim, Biosci., Biotechnol., Biochem., 2008, 72, 1138–1141 CrossRef CAS PubMed.
- H. J. Kim, Y. D. Kwon, S. Y. Lee and P. Kim, Appl. Microbiol. Biotechnol., 2012, 94, 1079–1086 CrossRef CAS PubMed.
- W. Zha, S. B. Rubin-Pitel and H. Zhao, Mol. BioSyst., 2008, 4, 246–248 RSC.
- F. R. Schmidt, Appl. Microbiol. Biotechnol., 2005, 68, 425–435 CrossRef CAS PubMed.
- M. Ahamad, B. Panda, S. Javed and M. Ali, Res. J. Microbiol., 2006, 1, 443–447 CrossRef CAS.
- Y. V. Alexeeva, E. P. Ivanova, I. Y. Bakunina, T. N. Zvaygintseva and V. V. Mikhailov, Lett. Appl. Microbiol., 2002, 35, 343–346 CrossRef CAS PubMed.
- S. Hunke and J. M. Betton, Mol. Microbiol., 2003, 50, 1579–1589 CrossRef CAS PubMed.
- N. S. Groota and S. Ventura, FEBS Lett., 2006, 580, 6471–6476 CrossRef PubMed.
- F. C. Alfred, E. V. Claire, C. Glòria and L. Josep, J. Biotechnol., 2012, 157, 391–398 CrossRef PubMed.
- R. Donovan, C. Robinson and B. Glick, J. Ind. Microbiol. Biotechnol., 1996, 16, 145–154 CrossRef CAS PubMed.
- W. E. Bentley, N. Mirjalili, D. C. Andersen, R. H. Davis and D. S. Kompala, Biotechnol. Bioeng., 1990, 35, 668–681 CrossRef CAS PubMed.
- B. R. Glick, Biotechnol. Adv., 1995, 13, 247–261 CrossRef CAS PubMed.
- X. Jiang, H. Zhang, J. Yang, M. Liu, H. Feng, X. Liu, Y. Cao, D. Feng and M. Xian, Appl. Microbiol. Biotechnol., 2013, 97, 5423–5431 CrossRef CAS PubMed.
- M. J. Dunlop, Biotechnol. Biofuels, 2011, 4, 32 CrossRef CAS PubMed.
- P. W. Piper, FEMS Microbiol. Lett., 1995, 134, 121–127 CrossRef CAS PubMed.
- S. A. Ataei and E. Vasheghani-Farahani, J. Ind. Microbiol. Biotechnol., 2008, 35, 1229–1233 CrossRef CAS PubMed.
- D. Wang, Q. Li, Z. Song, W. Zhou, Z. Su and J. Xing, J. Chem. Technol. Biotechnol., 2011, 86, 512–518 CrossRef CAS.
- N. Chen, J. Huang, Z. Feng, L. Yu, Q. Xu and T. Wen, Appl. Biochem. Biotechnol., 2009, 158, 595–604 CrossRef CAS PubMed.
- H. Chen, M. Lin and S. Hou, Korean J. Chem. Eng., 2008, 25, 1082–1087 CrossRef CAS.
| This journal is © The Royal Society of Chemistry 2017 |

