 Open Access Article
Creative Commons Attribution 3.0 Unported Licence
Dissected carbon nanotubes functionalized by 1-hydroxyanthraquinone for high-performance asymmetric supercapacitors†
Xia Yang,
Yuying Yang*,
Quancai Zhang,
Xiaotong Wang,
Yufeng An,
Bingshu Guo,
Zhongai Hu * and
Hongying Wu
Key Laboratory of Eco-Environment-Related Polymer Materials of Ministry of Education, Key Laboratory of Polymer Materials of Gansu Province, College of Chemistry and Chemical Engineering, Northwest Normal University, Lanzhou, Gansu 730070, China. E-mail: zhongai@nwnu.edu.cn; Fax: +86 931 8859764; Tel: +86 931 7973255
First published on 16th October 2017
Abstract
In the present paper, 1-hydroxyanthraquinone (HAQ) has been adsorbed onto dissected carbon nanotubes (rDCNTs) with reduced graphene oxide layers through noncovalent interaction. As a result, we realized the functionalization of rDCNTs, which means multi-electron electrochemical active groups have been transplanted to the carbon-based materials to further improve the pseudocapacitance. The surface area of dissected carbon nanotubes is increased by several times compared to MWCNTs by an oxidative unzipping process while the conductive backbones of MWCNTs are preserved. The special structure and electrical conductivity of the composites guarantee an outstanding super-capacitive performance for the as-prepared material. In the three-electrode configuration, the HAQ-functionalized rDCNTs (HAQ-rDCNTs) electrode exhibits a higher specific capacitance value (as high as 324 F g−1 at 1 A g−1, two times higher than bare DCNTs) and an ultrahigh rate capability (77.7% capacitance retention at 50 A g−1) in aqueous electrolyte solutions. For further practical application, a novel asymmetric supercapacitor (ASC) has been assembled by using DCNTs as the positive electrode and HAQ-rDCNTs as the negative electrode in a H2SO4 electrolyte. As the result, the device shows an excellent energy storage performance. At a voltage of 1.4 V, the as-fabricated ASC exhibits a high energy density of 12.3 W h kg−1 at a power density of 700 W kg−1.
1. Introduction
Supercapacitors, with fast power delivery, predominant reversibility, low maintenance costs, a fast charge–discharge rate and long cycle life, are playing an important role in complementing batteries in many applications.1–3 One such application is regenerative braking, used to recover power in cars and electric mass transit vehicles that would otherwise lose braking energy as heat.4 In comparison to conventional capacitors, supercapacitors have several orders of magnitude higher specific energy density.5 However, they suffer from a lower energy density as compared to conventional batteries. Great efforts have been devoted towards increasing the energy density as they already exhibit high power density.6 Asymmetric supercapacitors (ASCs) have been extensively explored by combining a battery-like faradaic electrode (as energy source) and a capacitive electrode (as power source) to increase the cell voltage.7 Unfortunately, the energy density of electrode assembly cannot be increased substantially due to their low device capacitance or narrow useful match cell voltage.8,9 In essential, the use of high-capacitance materials is a key factor for the optimization of energy density.10 Electrode materials for supercapacitors have significant effects on electrochemical performance and capacity of energy storage devices.11The traditional materials used for electrical energy storage systems are metal-based inorganic compounds. One type of these materials is conventional battery materials in their bulk state, which involves a crystallographic phase transformation during electrochemical cycling process thus usually limits the rate capability.12,13 The other class transition metal oxide, such as RuO2 and Nb2O5, exhibit pseudocapacitance, which arises when reversible redox reactions are not limited by solid-state ion diffusion. In the case of RuO2-based materials, although they have high capacitances, their costliness prevents their practical application in electrochemical supercapacitor.14 Practically, there are additional challenges for inorganic electrode materials: one is that they are nonrenewable materials from limited mineral resources, especially for Co and Ni; the other is to produce or recycle inorganic compounds requiring extraction and synthesis techniques, which is harmful to the environment.15,16 Extraction can release toxic materials, and synthesis can create large amounts of heavy metal waste and often requires energy intensive processing. Supercapacitors are expected to play an important role in green production and utilization of energy, in other words, they are organizational units of green energy storage system. So it is essential for manufacturing supercapacitors by using ‘green chemistry’ from natural resources.17–20
Organic materials are abundant and relatively low-cost. They also benign to the environment because their synthesis can be green designed so that it is not energy-intensive and produces minimal waste.21 More importantly, organic compounds are structurally diverse, able to be functionalized with relatively ease synthetic methods.12 Therefore, their electrochemical properties can be rationally tuned through the special organic functional groups and molecular structures on the basis of well-established principles in organic chemistry, which is absent for most of inorganic electrode materials.22 Besides, organic molecule electrodes are capable of high potential energy density23 because the multi-electron faradaic reactions in a low mass charge storage units can be realized.21,24 The charge storage capacities of redox-active organic molecules may even outperform those of conventional metal oxides.22 In fact, these attributes make organic materials are not mere alternatives to more traditional energy storage materials, rather, they have the potential to lead to disruptive technologies.12,24 However, poor electrical conductivity of redox-active organic molecular is serious shortcoming for collection or release of the charges involved in faradaic reactions. For this reason, some researchers coupled the organic molecules with fast redox kinetics to high-surface-area conductive substrates to access high energy and power densities for devices.25 Relative strong interactions between organic molecules and conductive substrates are required to immobilize organic molecules on the carbon backbone, or else the active species will migrate between the positive and negative electrode and generate shuttle effect, which always leads to internal loss of energy. Both covalent and noncovalent interactions can be used to anchor organic molecules on carbon backbone. The noncovalent interactions, specially, π–π interactions are very important for most applications because the sp2 system of carbon backbone is not interrupted, which means that important properties such as electric conductivity or mechanical strength are not affected. It is necessary that an overlap exists between the two aromatic components to have a noticeable interaction, and usually this is strongly favored by the planarity of the two components. Generally, a rich extended aromatic system with almost planar geometry prefers to interact strongly with small aromatic molecules.26 Aromatic quinone molecules with electrochemically reversible redox couples have been recently fixed onto the surfaces of carbon-based materials through π–π interaction between electron donor and acceptor aromatic molecules with carbon backbone. In this case, the surface confined redox reactions with a good reversibility and fast charge transfer are implanted into carbon backbone that usually exhibits electric double layer capacitance. Accordingly, the functionalized carbon-based materials are obtained as a new organic electrode with considerable charge storage capacities.27
For instance, Wang et al. applied hierarchically porous graphitic carbon fibers (HPGCFs) and selected anthraquinone (AQ) molecules to functionalize HPGCFs via π–π stacking interactions. Asymmetric supercapacitors have been assembled using HPGCFs as the positive electrode and AQ-HPGCFs as the negative electrode in aqueous H2SO4 solution. The device presents a large energy density (19.3 W h kg−1 in the applied potential range between 0 and 1.2 V) and ultrahigh power capability.22 The group of Muhammad Boota et al. decorated reduced graphene oxide (rGO) sheets with a active xerogel composed of 2,5-dimethoxy-1,4-benzoquinone (DMQ) as a high capacitance and long cycle life pseudocapacitive electrode. It exhibited an excellent capacitance of 650 F g−1 at 5 mV s−1 (780 F cm−3) in 1 M H2SO4, and optimized electrodes showed an excellent capacitance retention of 99% after 25![[thin space (1/6-em)]](https://www.rsc.org/images/entities/char_2009.gif) 000 cycles at 50 mV s−1.18 In addition, our research group has also reported some interesting works. For example, we synthesized a nitrogen-doped porous carbon materials (NPCs) by direct thermolysis of zinc-based MOFs (ZIF-8). Then we selected anthraquinone (AQ), 1,4-naphthoquinone (NQ) and tetrachlorobenzoquinone (TCBQ) to functionalize NPCs via noncovalent interactions, respectively. The functionalized NPCs revealed an enhanced overall capacitance, and the assembled asymmetric supercapacitor exhibited excellent energy storage performance.28
000 cycles at 50 mV s−1.18 In addition, our research group has also reported some interesting works. For example, we synthesized a nitrogen-doped porous carbon materials (NPCs) by direct thermolysis of zinc-based MOFs (ZIF-8). Then we selected anthraquinone (AQ), 1,4-naphthoquinone (NQ) and tetrachlorobenzoquinone (TCBQ) to functionalize NPCs via noncovalent interactions, respectively. The functionalized NPCs revealed an enhanced overall capacitance, and the assembled asymmetric supercapacitor exhibited excellent energy storage performance.28
In the present work, we applied an oxidative unzipping process, which involves the lengthwise cutting and opening the walls of MWCNTs to obtain dissected carbon nanotubes with separated ribbonlike graphene oxide layers casually distributed on the residual tubes. After that, these graphene oxide layers turned into reduced graphene oxide layers under the adsorption process in the reductive medium to achieve a well conductive rDCNTs. Then, we used 1-hydroxyanthraquinone (HAQ) as a redox modifier and rDCNTs as conductive substrate to realize the surface confinement of organic redox centers onto carbon backbones of rDCNTs, and accordingly achieve HAQ-functionalized rDCNTs. It is interesting to note that the surface area of DCNTs is increased by several times than MWCNTs by an oxidative unzipping process while conductive backbones of MWCNTs are preserved. Furthermore, multi-electron redox centers have been implanted into the rDCNTs. All these guarantee an outstanding super-capacitive performance for the as-prepared material. In the three-electrode system, HAQ-rDCNTs shows larger capacitance value (324 F g−1 at 1 A g−1, two times higher than bare DCNTs) and ultrahigh rate capability (77.7% retention rate at 50 A g−1) in the more negative potential ranging from −0.4 to 0.6 V. For further practical application, a novel asymmetric supercapacitor has been assembled by using HAQ-rDCNTs as negative electrode and DCNTs as positive electrode in H2SO4 electrolyte. The test results show that the DCNTs//HAQ-rDCNTs device can achieve energy density (12.3 W h kg−1) along with power density (700 W kg−1) with the operating voltage of 1.4 V.
2. Experimental
2.1 Materials
Sodium hydroxide (NaOH) and sodium boron hydride (NaBH4) were purchased from Sinopharm Chemical Reagent Corp (China). 1-Hydroxyanthraquinone (HAQ) was purchased from Alfa-Aesar. Multi-walled carbon nanotubes (MWCNTs, Chengdu, P.R. China). Concentrated sulfuric acid, concentrated nitric acid, potassium permanganate and hydrogen peroxide (H2SO4, HNO3, KMnO4 and H2O2, Sinopharm Chemical Reagent Corp, China). Double distilled water was used throughout all the experiments. All the chemicals are analytical grade in the experiments.2.2 Sample preparation
![[thin space (1/6-em)]](https://www.rsc.org/images/entities/char_2009.gif) :
:![[thin space (1/6-em)]](https://www.rsc.org/images/entities/char_2009.gif) 1) in a 250 mL beaker under vigorous agitation. Next, 1.5 g KMnO4 was slowly added to the beaker. After ultrasonic treatment for 5 h, 280 mL double distilled water were added to the mixture and then 10 mL of 30% H2O2 was added. The diluted suspension was washed and centrifuged at 12
1) in a 250 mL beaker under vigorous agitation. Next, 1.5 g KMnO4 was slowly added to the beaker. After ultrasonic treatment for 5 h, 280 mL double distilled water were added to the mixture and then 10 mL of 30% H2O2 was added. The diluted suspension was washed and centrifuged at 12![[thin space (1/6-em)]](https://www.rsc.org/images/entities/char_2009.gif) 000 rpm with double distilled water for several times, followed by vacuum-dried at 60 °C for 12 h to obtain the DCNTs material.
000 rpm with double distilled water for several times, followed by vacuum-dried at 60 °C for 12 h to obtain the DCNTs material.![[thin space (1/6-em)]](https://www.rsc.org/images/entities/char_2009.gif) :
:![[thin space (1/6-em)]](https://www.rsc.org/images/entities/char_2009.gif) y) to indicate the mass ratio of HAQ (x) to rDCNTs (y). The mass loading in the optimal sample was determined by electrochemical technique (see details in the ESI†).
y) to indicate the mass ratio of HAQ (x) to rDCNTs (y). The mass loading in the optimal sample was determined by electrochemical technique (see details in the ESI†).2.3 Characterization of samples
The components of materials analysis was performed on a Nicolet Nexus 670 FT-IR spectrometer. Powder X-ray diffraction (XRD) of samples was measured by a diffractometer (D/Max-2400) with Cu Kσ radiation (λ = 1.5418 Å) operating at 40 kV, 150 mA. The Raman spectroscopy analysis were studied by using (Bruker RFS 100/S, Germany). The morphologies of samples was characterized by field emission scanning electron microscopy (FESEM; ULTRA plus, Germany) and transmission electron microscope (TEM; JEOL, JEM-2010, Japan). The Brunauer–Emmett–Teller (BET) measurement was recorded using Micromeritics ASAP 2020 nitrogen adsorption apparatus (USA). X-ray photoelectron spectroscopy (XPS) analysis was performed by monochromatic Al Kα radiation source (ThermoVG Scientific). Thermogravimetric (TG) analysis was conducted by a Perkin-Elmer TG/DTA-6300 instrument in the temperature range of 20–800 °C at heating rate of 5 °C min−1 under nitrogen atmosphere.2.4 Electrochemical measurement
![[thin space (1/6-em)]](https://www.rsc.org/images/entities/char_2009.gif) :
:![[thin space (1/6-em)]](https://www.rsc.org/images/entities/char_2009.gif) 15) were ultrasonically dispersed in 0.4 mL Nafion (0.25 wt%) and then the above homogeneous slurry of 6 mL was dropped onto the glassy carbon electrode using a pipet gun and dried at room temperature.30 The cyclic voltammetry (CV), galvanostatic charge–discharge (GCD), and electrochemical impedance spectroscopy (EIS) tests (CHI 760D, Chenghua, Shanghai, China) were performed in a three-electrode cell, in which platinum foil and saturated calomel electrode (SCE) were used as counter electrode and reference electrode, respectively. The cycle-life stability was performed using computer controlled cycling equipment (LAND CT2001A, Wuhan China).
15) were ultrasonically dispersed in 0.4 mL Nafion (0.25 wt%) and then the above homogeneous slurry of 6 mL was dropped onto the glassy carbon electrode using a pipet gun and dried at room temperature.30 The cyclic voltammetry (CV), galvanostatic charge–discharge (GCD), and electrochemical impedance spectroscopy (EIS) tests (CHI 760D, Chenghua, Shanghai, China) were performed in a three-electrode cell, in which platinum foil and saturated calomel electrode (SCE) were used as counter electrode and reference electrode, respectively. The cycle-life stability was performed using computer controlled cycling equipment (LAND CT2001A, Wuhan China).In the three-electrode system, the specific capacitances (C, F g−1) of the electrodes were calculated from the discharge curves over the potential range based on the following equation:
 | (1) |
In the case of the two-electrode configuration, the expressions for specific capacitance (C, F g−1), energy density (E, W h kg−1) and power density (P, W kg−1) of the supercapacitor can be calculated by using the following equations:31–33
 | (2) |
 | (3) |
 | (4) |
The proper mass ratio (R) of the positive and negative electrochemical active species in the two-electrode configuration using the following equation:34
 | (5) |
3. Results and discussions
3.1 Synthesis process
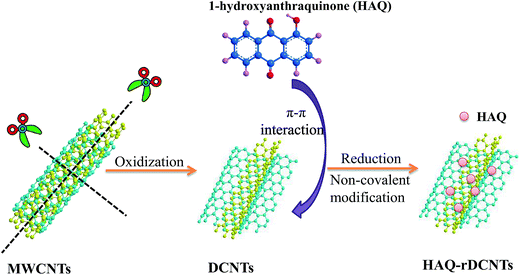
The formation process for HAQ-rDCNTs electrode material is outlined in Fig. 1. In the first step, the MWCNTs were unzipped and cut through chemical oxidation. As a result, the lengthwise cutting and opening the walls leads to the dissected carbon nanotubes (DCNTs) with separated ribbonlike graphene oxide layers casually distributed on the residual tubes. In the second step, the graphene oxide layers turned into reduced graphene oxide layers under the adsorption process in the reductive medium to achieve a well conductive rDCNTs. HAQ molecules were adsorbed onto the surface of rDCNTs with reduced graphene oxide layers by π–π stacking interaction.3.2 Characterization of the samples
The morphologies of the as-achieved samples are characterized by FESEM and TEM, as shown in Fig. 2. From the FESEM image of MWCNTs (Fig. 2a), it can be seen that the sample reveal that fiber-like structure with a smooth surface35 and have relatively uniform diameter distribution with an outer diameter in the range of 30–40 nm.36 After strong acid ultrasonic unzipping, the as-obtained DCNTs (Fig. 2b) remain their tube-like structure with lengths of nanoscale. As a whole, the images of organic molecules functionalized composites (Fig. 2c) keep similar morphology with DCNTs. Thus, non-covalent modification does not have effect on morphology feature of DCNTs. It should be pointed out that the free phase of HAQ is not observed since the washing operation can remove the free organic molecules from the resultant composites.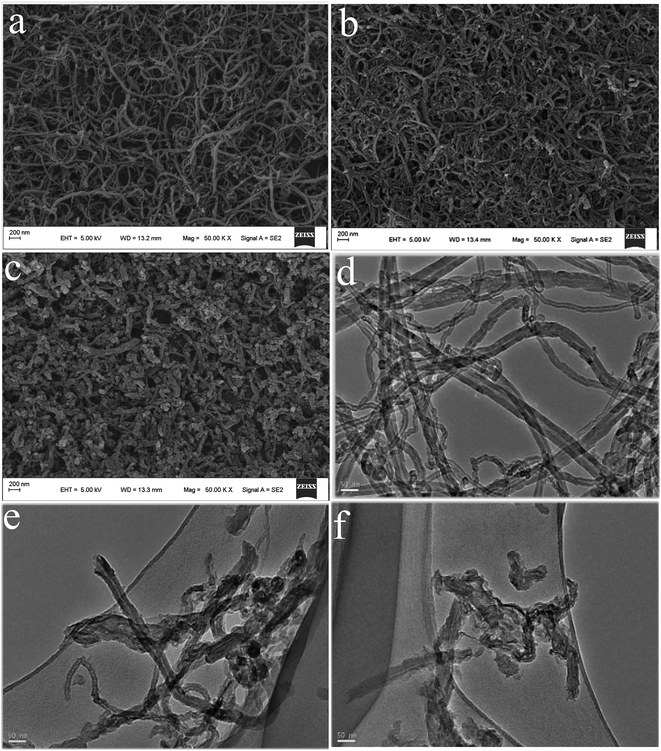 | ||
| Fig. 2 FESEM of MWCNTs (a), DCNTs (b) and HAQ-rDCNTs (c); TEM of MWCNTs (d), DCNTs (e) and HAQ-rDCNTs (f). | ||
In order to further characterize the structure of samples, TEM studies have been also used as shown in Fig. 2. In comparison with MWCNTs (Fig. 2d), the TEM image of DCNTs (Fig. 2e) further evidence that the short nanotubes are obtained by cutting and unzipping in the transverse and longitudinal directions.37 The graphene sheets enter our line of sight and the remanent and incomplete tube structure could still be identified. The curved graphene nanosheets in the MWCNTs are unwrapped into graphene layers. Obviously, DCNTs have larger active surface because of the graphene layers, comparing with the pristine MWCNTs. And then, the organic molecule crystals cannot be observed in the TEM images of composites (Fig. 2f), indicating that the organic compounds were adsorbed on the rDCNTs surface in the form of molecules.
Fig. 3a demonstrates the FT-IR spectra of the three samples. On the FT-IR spectrum of the DCNTs, absorption peaks with strong intensity at around 3414 cm−1, is indicative of the O–H stretching vibration. The C![[double bond, length as m-dash]](https://www.rsc.org/images/entities/char_e001.gif) O stretching of COOH groups is observed at 1717 cm−1 while the other oxygen-containing functional groups are revealed by the bands at 1385 and 1084 cm−1, which correspond to C–O in phenol and primary alcohol, respectively.38,39 The characteristic peaks of HAQ-rDCNTs are observed at 1628, 1223 and 710 cm−1, which are consistent with the adsorptions of pure HAQ, strongly confirming the presence of HAQ onto rDCNTs. The peak revealed at 1628 cm−1 is attributed to the C
O stretching of COOH groups is observed at 1717 cm−1 while the other oxygen-containing functional groups are revealed by the bands at 1385 and 1084 cm−1, which correspond to C–O in phenol and primary alcohol, respectively.38,39 The characteristic peaks of HAQ-rDCNTs are observed at 1628, 1223 and 710 cm−1, which are consistent with the adsorptions of pure HAQ, strongly confirming the presence of HAQ onto rDCNTs. The peak revealed at 1628 cm−1 is attributed to the C![[double bond, length as m-dash]](https://www.rsc.org/images/entities/char_e001.gif) O stretching vibrations of HAQ, while the peaks at 1223 and 710 cm−1 correspond to the aromatic skeleton stretching vibration and C–H out-of-plane deformation vibration, respectively. Notice that, for the pure HAQ sample, the characteristic peaks are observed at 1636, 1229, and 706 cm−1. Apparently, for the HAQ-rDCNTs sample, the C
O stretching vibrations of HAQ, while the peaks at 1223 and 710 cm−1 correspond to the aromatic skeleton stretching vibration and C–H out-of-plane deformation vibration, respectively. Notice that, for the pure HAQ sample, the characteristic peaks are observed at 1636, 1229, and 706 cm−1. Apparently, for the HAQ-rDCNTs sample, the C![[double bond, length as m-dash]](https://www.rsc.org/images/entities/char_e001.gif) O and aromatic skeleton stretching vibration shows red shift, while the C–H out-of-plane deformation mode exhibits a blue shift, suggesting strong π–π stacking interactions between HAQ and rDCNTs.40 In comparison with that of the corresponding small organic molecules, the characteristic absorption peaks are well maintained in the composites. This analysis results confirm that the HAQ has been successfully adsorbed on the surface of rDCNTs.
O and aromatic skeleton stretching vibration shows red shift, while the C–H out-of-plane deformation mode exhibits a blue shift, suggesting strong π–π stacking interactions between HAQ and rDCNTs.40 In comparison with that of the corresponding small organic molecules, the characteristic absorption peaks are well maintained in the composites. This analysis results confirm that the HAQ has been successfully adsorbed on the surface of rDCNTs.
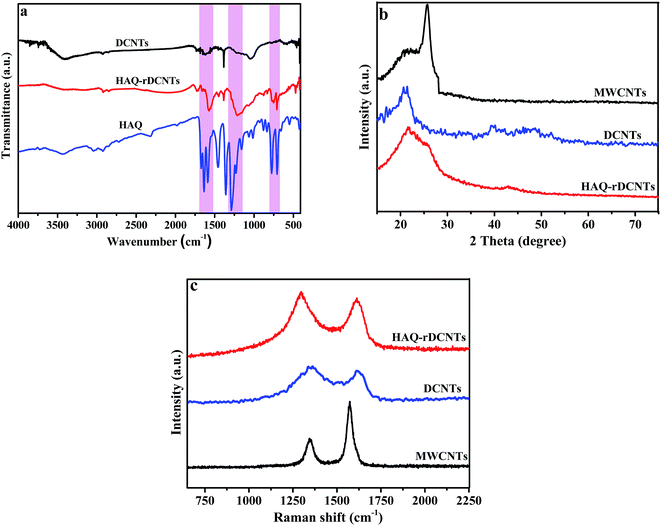 | ||
| Fig. 3 (a) FT-IR spectra of HAQ-rDCNTs, DCNTs and HAQ; (b) XRD patterns of MWCNTs, DCNTs and HAQ-rDCNTs; (c) Raman spectra of MWCNTs, DCNTs and HAQ-rDCNTs. | ||
X-ray diffraction (XRD) analysis is shown in Fig. 3b. The pristine MWCNTs demonstrates an evident graphitic (002) plane at around 2θ = 26° (interlayer spacing = 3.4 Å).35 Compared with pristine MWCNTs, the (002) peak of DCNTs near 21.7° (interlayer spacing = 3.8 Å) shows an obviously left shift and becomes widen due to the increase of basal spacing.37,38 This result suggests that after cutting and unzipping, there are a certain amount of intercalated water molecules bonded to oxygen-containing functional groups on the ribbonlike graphene oxide layers by hydrogen bonds. For HAQ-rDCNTs, the spectra remain the essential feature of the XRD pattern of DCNTs, which indicated that the organic compounds are anchored in the form of molecule. That is to say, the free phase of the HAQ molecules does not exist in the composites.
Electronic properties of carbon materials can be investigated from the Raman spectra, particularly for distinguishing ordered and disordered crystal structures, as illustrated in Fig. 3c. All samples contain two main peaks: D-band and G-band.41 The former derives from the A1g mode of 3D graphitic-like lattice vibrations is attributed to the presence of structure defects or structural disorders in carbon systems, while the latter is assigned to the E2g mode first-order the stretching vibration of any pair of sp2 sites inside the graphitic pattern. The integrated intensity ratio between the D-band and G-band (ID/IG) indicates the extent of microstructural disorder within the samples. That is, the ID/IG ratio is inversely proportional to the crystallite size of graphene.42,43 After the cutting and unzipping process, the ratio of the intensities of the D and G bands (ID/IG) increases from 0.45 to 1.88, with the result that the pristine ordered structure of MWCNTs is partly destroyed. At the same time, the positions of the D and G band demonstrate a slight broaden and subsequent shift, which perhaps attribute to the increase of oxygen-containing functional groups on the edge of nanotubes. The value of ID/IG for HAQ-rDCNTs is 1.76, smaller than DCNTs, which further verify that the noncovalent functionalization strategy can preserve the conjugated structure of carbon backbone effectively. It also causes an increase in the average size of the sp2 domains.
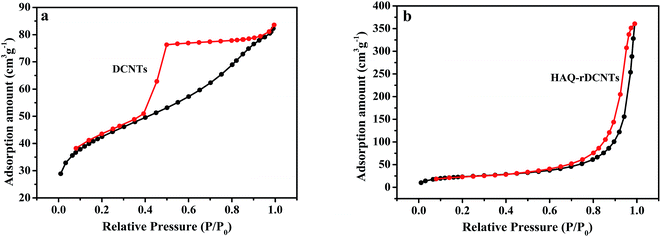
Representative nitrogen adsorption/desorption isotherms of DCNTs and HAQ-rDCNTs are measured, as shown in Fig. 4a and b. According to the IUPAC classification, these two materials display a characteristic type IV adsorption/desorption isotherms with the mesoporous features.44 The adsorption amount of DCNTs increases sharply at the medium relative pressure P/P0 (0.4–0.6), indicating that a large number of mesoporous and a certain amount of macropores were generated.36 Moreover, the isotherm with an almost horizontal plateau in the range of P/P0 = 0.6–0.9 may be contributed to the adsorption in mesopores. These pores enlarge the specific surface and are good for transporting the electrolyte ions into the inner tubes during the rapid charge/discharge process. Additionally, from the N2 adsorption–desorption isotherm of HAQ-rDCNTs, a significant capillary condensation step near the maximum relative pressure (P/P0 = 0.9–0.99), we can conclude the existence of mesoporous and macropores (exceed 50 nm in diameter) in the material. It should be noted that after adsorbing HAQ on the surface of rDCNTs, the specific surface areas of composites decrease to 81.55 m2 g−1. We speculate that the organic molecules should be adsorbed on the surface of rDCNTs through the non-covalent functionalization, which lead to a part of porous were covered by HAQ molecules (pore size distribution curve in Fig. S1†).
X-ray photoelectron spectroscopy (XPS) is an effective method to analyze the elemental composition and chemical state of carbonaceous materials.38,45 The whole patterns as shown in Fig. 5a, two principal peaks are demonstrated in the spectra of DCNTs and HAQ-rDCNTs, which can be explained by a C 1s peak located at 284.3 eV and an O 1s peak at around 531.0 eV. In addition, in the high resolution scan, the C 1s spectra of material can be fitted by four distinct component peaks. For HAQ-rDCNTs (Fig. 5b), the peaks at binding energy of 284.0, 284.7, 285.1 and 286.2 eV are represent C–C, C–O, C![[double bond, length as m-dash]](https://www.rsc.org/images/entities/char_e001.gif) O and O–C
O and O–C![[double bond, length as m-dash]](https://www.rsc.org/images/entities/char_e001.gif) O, respectively. After functionalization, the peak of composite at near 285.1 eV is enhanced slightly, which may be attributed to the C
O, respectively. After functionalization, the peak of composite at near 285.1 eV is enhanced slightly, which may be attributed to the C![[double bond, length as m-dash]](https://www.rsc.org/images/entities/char_e001.gif) O of HAQ molecules (Fig. S2a†). Similarly, the O 1s XPS spectrum of HAQ-rDCNTs (Fig. 5c) can be composed of three individual binding states located at 534.0 eV (C
O of HAQ molecules (Fig. S2a†). Similarly, the O 1s XPS spectrum of HAQ-rDCNTs (Fig. 5c) can be composed of three individual binding states located at 534.0 eV (C![[double bond, length as m-dash]](https://www.rsc.org/images/entities/char_e001.gif) O), 532.8 eV (C–O–H) and 531.7 eV (C–O–C). Compared with DCNTs, the peaks at near 534.0 eV (C
O), 532.8 eV (C–O–H) and 531.7 eV (C–O–C). Compared with DCNTs, the peaks at near 534.0 eV (C![[double bond, length as m-dash]](https://www.rsc.org/images/entities/char_e001.gif) O) for composites become intensive slightly, implying the content of C
O) for composites become intensive slightly, implying the content of C![[double bond, length as m-dash]](https://www.rsc.org/images/entities/char_e001.gif) O increases after adsorbing organic molecules (Fig. S2b†).
O increases after adsorbing organic molecules (Fig. S2b†).
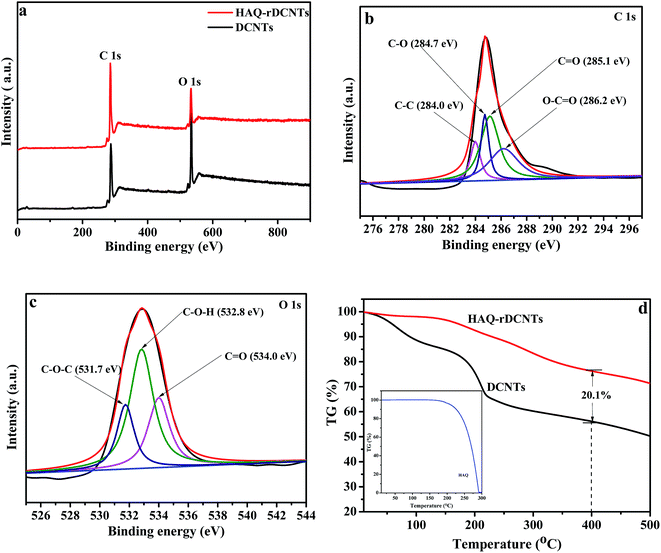 | ||
| Fig. 5 (a) XPS spectra of the samples; C 1s region (b) and O 1s region (c) of HAQ-rDCNTs; (d) TGA curves of DCNTs, HAQ and HAQ-rDCNTs composite. | ||
The weight percentage of HAQ in HAQ-rDCNTs was determined by thermo gravimetric analysis (TGA) was carried out under nitrogen atmosphere in Fig. 5d, in which HAQ occurs rapid total weight loss from 195 to 293 °C due to its sublimation. The first weight loss of HAQ-rDCNTs is observed in the temperature range of 50–150 °C, which can be ascribed to the evaporation of water, while another weight loss between 150 and 400 °C suggests the sublimation of HAQ and removal of residual oxygen-containing functional groups on the rDCNTs. We calculated the overall weight percentages of HAQ in the composite are found to be about 20.1%. The content of components can also be determined by electrochemical techniques, it is 18.9%, as shown in Fig. S3.†
3.3 Electrochemical evaluation of the samples
![[thin space (1/6-em)]](https://www.rsc.org/images/entities/char_2009.gif) :
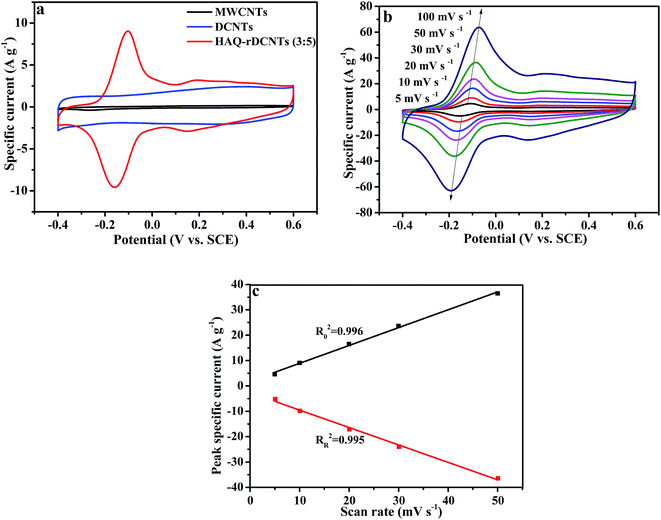
:![[thin space (1/6-em)]](https://www.rsc.org/images/entities/char_2009.gif) 5) electrode at a potential range from −0.4 to 0.6 V at 10 mV s−1 in 1 M H2SO4 electrolyte. For comparing, the CV curves of the substrate are also demonstrated in the meantime. Obviously, the integral area of CV curve for the MWCNTs is much smaller than that of DCNTs and HAQ-rDCNTs (3
5) electrode at a potential range from −0.4 to 0.6 V at 10 mV s−1 in 1 M H2SO4 electrolyte. For comparing, the CV curves of the substrate are also demonstrated in the meantime. Obviously, the integral area of CV curve for the MWCNTs is much smaller than that of DCNTs and HAQ-rDCNTs (3![[thin space (1/6-em)]](https://www.rsc.org/images/entities/char_2009.gif) :
:![[thin space (1/6-em)]](https://www.rsc.org/images/entities/char_2009.gif) 5) composite, implying that the specific capacitance of MWCNTs can be neglected. The CV curve of pure DCNTs shows almost a rectangular-like shape, which indicates electrical double-layer energy storage mechanism. Compared with the DCNTs, after functionalized, the CV shape of the HAQ-rDCNTs (3
5) composite, implying that the specific capacitance of MWCNTs can be neglected. The CV curve of pure DCNTs shows almost a rectangular-like shape, which indicates electrical double-layer energy storage mechanism. Compared with the DCNTs, after functionalized, the CV shape of the HAQ-rDCNTs (3![[thin space (1/6-em)]](https://www.rsc.org/images/entities/char_2009.gif) :
:![[thin space (1/6-em)]](https://www.rsc.org/images/entities/char_2009.gif) 5) electrode in the potential range from −0.4 to 0.6 V illustrates that the overall capacitance derives from the integration of the pseudocapacitance of HAQ and the electric double layer capacitor of DCNTs in the composite. In addition, the HAQ-rDCNTs (3
5) electrode in the potential range from −0.4 to 0.6 V illustrates that the overall capacitance derives from the integration of the pseudocapacitance of HAQ and the electric double layer capacitor of DCNTs in the composite. In addition, the HAQ-rDCNTs (3![[thin space (1/6-em)]](https://www.rsc.org/images/entities/char_2009.gif) :
:![[thin space (1/6-em)]](https://www.rsc.org/images/entities/char_2009.gif) 5) electrode exhibits a larger integral area than that of pure DCNTs electrode, suggesting the dramatically enhanced charge storage capability of composite. The CV curve is characterized by a pair of well-defined and reversible redox peaks with an anodic peak potential at approximately 0.15 V and a cathodic peak potentials at around 0.1 V, respectively. These symmetric waves give a slight peak separation of about 0.19 V by taking into consideration a two electrons and two protons process. The electrochemical performances of the other composites, which has different mass ratio between HAQ and rDCNTs, are shown in Fig. S4.†
5) electrode exhibits a larger integral area than that of pure DCNTs electrode, suggesting the dramatically enhanced charge storage capability of composite. The CV curve is characterized by a pair of well-defined and reversible redox peaks with an anodic peak potential at approximately 0.15 V and a cathodic peak potentials at around 0.1 V, respectively. These symmetric waves give a slight peak separation of about 0.19 V by taking into consideration a two electrons and two protons process. The electrochemical performances of the other composites, which has different mass ratio between HAQ and rDCNTs, are shown in Fig. S4.†
Fig. 6b shows the CV curves of the HAQ-rDCNTs (3![[thin space (1/6-em)]](https://www.rsc.org/images/entities/char_2009.gif) :
:![[thin space (1/6-em)]](https://www.rsc.org/images/entities/char_2009.gif) 5) at scan rates from 5 to 100 mV s−1. It is obviously that when the sweep rate increases, the anodic and cathodic peaks shift to higher and lower potentials due to the uncompensated resistance but the shapes of CV curves are nearly keep unchanged, which reveals an excellent capacitance behavior and rapid diffusion of electrolyte ions into the DCNTs.46,47 In addition, the positive sweep regions of the CV curves are symmetric to their corresponding negative sweeps, which indicates the kinetic reversibility in the redox process. When the scan rate at 10 mV s−1, the CV curve of HAQ-rDCNTs (3
5) at scan rates from 5 to 100 mV s−1. It is obviously that when the sweep rate increases, the anodic and cathodic peaks shift to higher and lower potentials due to the uncompensated resistance but the shapes of CV curves are nearly keep unchanged, which reveals an excellent capacitance behavior and rapid diffusion of electrolyte ions into the DCNTs.46,47 In addition, the positive sweep regions of the CV curves are symmetric to their corresponding negative sweeps, which indicates the kinetic reversibility in the redox process. When the scan rate at 10 mV s−1, the CV curve of HAQ-rDCNTs (3![[thin space (1/6-em)]](https://www.rsc.org/images/entities/char_2009.gif) :
:![[thin space (1/6-em)]](https://www.rsc.org/images/entities/char_2009.gif) 5) has small peak potential separation was up to 59 mV, which may be attributed to the fast charge transfer process between HAQ and rDCNTs. Because of the uncompensated resistance, the peak potential separations (Eps) are enlarged continuously with the scan rate increasing from 5 to 100 mV s−1, as shown in Table 1.
5) has small peak potential separation was up to 59 mV, which may be attributed to the fast charge transfer process between HAQ and rDCNTs. Because of the uncompensated resistance, the peak potential separations (Eps) are enlarged continuously with the scan rate increasing from 5 to 100 mV s−1, as shown in Table 1.
| Scan rate (mV s−1) | 5 | 10 | 20 | 30 | 50 |
| Eps (mV) | 49 | 59 | 66 | 74 | 90 |
The electrochemical process of the conversion by four-electron and four-proton is described as follow:48
Additionally, the variation of peak current (ip) with scan rate (v) will reveal kinetic information of the electrode materials. When the redox reaction is surface controlled (capacitive), the ip varies with v. For a redox reaction is limited by semi-infinite diffusion, the ip varies directly with v1/2.4 It can be seen from Fig. 6c that the ip against v for the HAQ-rDCNTs, suggesting that the redox reaction of which is a capacitive process. A linear relationship is investigated between the ip and the v with Ro2 = 0.996 and RR2 = 0.995.
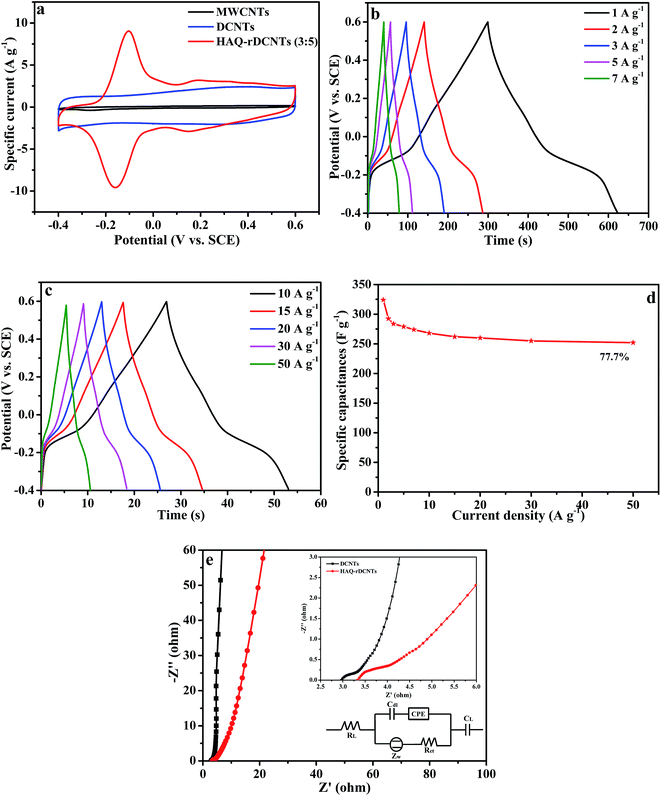
Fig. 7a presents the galvanostatic charge–discharge curves (GCD curves) of MWCNTs, DCNTs and HAQ-rDCNTs (3![[thin space (1/6-em)]](https://www.rsc.org/images/entities/char_2009.gif) :
:![[thin space (1/6-em)]](https://www.rsc.org/images/entities/char_2009.gif) 5) at current density of 1 A g−1 in the potential range of −0.4 to 0.6 V. Compared with MWCNTs and pure DCNTs, the potential–time curve of HAQ-rDCNTs (3
5) at current density of 1 A g−1 in the potential range of −0.4 to 0.6 V. Compared with MWCNTs and pure DCNTs, the potential–time curve of HAQ-rDCNTs (3![[thin space (1/6-em)]](https://www.rsc.org/images/entities/char_2009.gif) :
:![[thin space (1/6-em)]](https://www.rsc.org/images/entities/char_2009.gif) 5) electrode shows an symmetrical charge–discharge voltage plateau, which is in agreement with the results of CV curves and attributable to the quick faradaic reactions of HAQ. The HAQ-rDCNTs (3
5) electrode shows an symmetrical charge–discharge voltage plateau, which is in agreement with the results of CV curves and attributable to the quick faradaic reactions of HAQ. The HAQ-rDCNTs (3![[thin space (1/6-em)]](https://www.rsc.org/images/entities/char_2009.gif) :
:![[thin space (1/6-em)]](https://www.rsc.org/images/entities/char_2009.gif) 5) electrode showed an average specific capacitance of 324 F g−1 at 1 A g−1 between −0.4 and 0.6 V, just as the results of the CV measurement, which is much higher than the specific capacitance of unmodified DCNTs electrode over the same potential range and current density. These remarkable capacitances are probably related to the additional electrochemical capacitance of active organic molecules and the strong positive synergistic effects between the rDCNTs and small organic molecules.
5) electrode showed an average specific capacitance of 324 F g−1 at 1 A g−1 between −0.4 and 0.6 V, just as the results of the CV measurement, which is much higher than the specific capacitance of unmodified DCNTs electrode over the same potential range and current density. These remarkable capacitances are probably related to the additional electrochemical capacitance of active organic molecules and the strong positive synergistic effects between the rDCNTs and small organic molecules.
To accurately evaluate the charge storage ability of HAQ-rDCNTs, the GCD test at different current densities was also measured in 1 M H2SO4. Fig. 7b and c demonstrate galvanostatic charge–discharge curves of HAQ-rDCNTs (3![[thin space (1/6-em)]](https://www.rsc.org/images/entities/char_2009.gif) :
:![[thin space (1/6-em)]](https://www.rsc.org/images/entities/char_2009.gif) 5) at various specific currents. All the charge curves are almost symmetric to the corresponding discharging curves, proving a fast and highly reversible electrochemistry reaction. The specific capacitances are 324, 279, 268, 260, 255 and 252 F g−1 at the current density of 1, 5, 10, 20, 30 and 50 A g−1, respectively.
5) at various specific currents. All the charge curves are almost symmetric to the corresponding discharging curves, proving a fast and highly reversible electrochemistry reaction. The specific capacitances are 324, 279, 268, 260, 255 and 252 F g−1 at the current density of 1, 5, 10, 20, 30 and 50 A g−1, respectively.
The relationship between specific capacitance and current density is illustrated in Fig. 7d. The maximum specific capacitance of HAQ-rDCNTs (3![[thin space (1/6-em)]](https://www.rsc.org/images/entities/char_2009.gif) :
:![[thin space (1/6-em)]](https://www.rsc.org/images/entities/char_2009.gif) 5) is as high as 324 F g−1 at 1 A g−1, it is worthy of mentioning that the specific capacitance can still be retained at 77.7% with the current density increasing to 50 A g−1. Such prominent rate capability is probably related to the HAQ molecules are anchored on the surface of rDCNTs and introduce a fast faradaic reaction. Moreover, the unique structure of composite allows unconstrained electrolyte ions diffusion and electron transport. In specially, the unzipped carbon nanotubes as the core of composites enhance global electrical conductivity of the electrode materials.
5) is as high as 324 F g−1 at 1 A g−1, it is worthy of mentioning that the specific capacitance can still be retained at 77.7% with the current density increasing to 50 A g−1. Such prominent rate capability is probably related to the HAQ molecules are anchored on the surface of rDCNTs and introduce a fast faradaic reaction. Moreover, the unique structure of composite allows unconstrained electrolyte ions diffusion and electron transport. In specially, the unzipped carbon nanotubes as the core of composites enhance global electrical conductivity of the electrode materials.
We also performed electrochemical impedance tests to investigate the kinetic features of the electrodes. Nyquist plots of DCNTs and HAQ-rDCNTs electrode in the frequency range from 0.01 to 105 Hz, the electrode was carried out at a bias potential of −0.1 V vs. SCE reference electrode, are presented in Fig. 7e. It can be seen that the complex-plane impedance plot for HAQ-rDCNTs shows the inconspicuous semicircle of high-frequency region in (the inset).49 The intercept of the semicircle with the real axis stands for the equivalent series resistance (RL) while the diameter of semicircle represents charge-transfer resistance (Rct). The RL represents a sum of the ionic electrolyte resistance, the intrinsic resistance of active material and the contact resistance between the interface active material and current collector interface.50 The equivalent circuit for the impedance analysis was modeled in (the inset) by the software of Zsimpwin. DCNTs is less than HAQ-rDCNTs in the Rct value, which is equal to 0.72 and 1.12 Ω, respectively. The low charge-transfer resistance indicates that electrochemical polarization of electrode is slight. The charge transfer process is relative to only oxygen-containing functional groups for the bare DCNTs. However, the charge transfer of HAQ-rDCNTs is involved with Faraday reactions both oxygen-containing functional groups and HAQ molecular. Perhaps, HAQ molecular adsorbed on the rDCNTs is responsible for the increased Rct value for the HAQ-rDCNTs composite. The equivalent series resistances (RL) of DCNTs and HAQ-rDCNTs are 3.14 and 3.35 Ω, respectively. Apparently, DCNTs is a little smaller than HAQ-rDCNTs in electronic conductivity of electrode system.51 The slope of the 45° portion of the curve at medium frequencies is defined the Warburg resistance, which is described as a diffusive resistance of the H+ ion. These data support the results and discussions in the CV tests and the galvanostatic charge/discharge measurements.
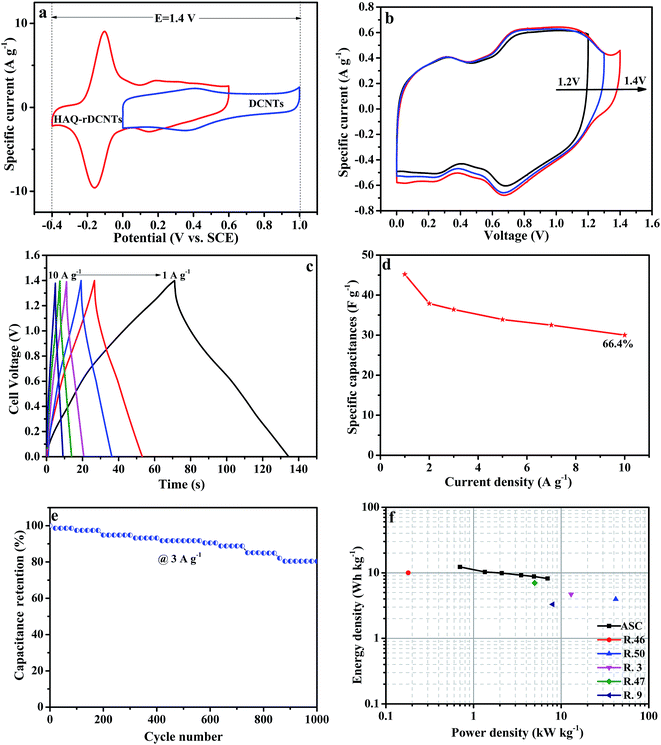
The galvanostatic charge/discharge curves of the asymmetric cell were recorded at various current densities from 1 A g−1 to 10 A g−1 to further evaluate the electrochemical performance. The specific capacitance of the DCNTs//HAQ-rDCNTs ASC is calculated on account of the total mass of positive and negative electrodes. As shown in Fig. 8c, all charging curves are almost symmetric to their corresponding discharging curves indicating an excellent electrochemical reversibility. A plot of current density against specific capacitance is illustrated in Fig. 8d. The gravimetric capacitance of the DCNTs//HAQ-rDCNTs ASC by discharge curve (eqn (2)) is calculated to be 45.2 F g−1 at a current density of 1 A g−1. The specific capacitance still maintains 66.4% when the current density increased by as much as 10 times, shows excellent rate performance. Moreover, the life cycle test was carried out using GCD study at a current density of 3 A g−1 in Fig. 8e. After cycling 1000 cycles, the capacitance retention is 87.5%.
Fig. 8f shows Ragone plot of asymmetric supercapacitor, which relative to the corresponding energy and power densities. It is noteworthy that the energy density is up to 12.3 W h kg−1 at a power density of 700 W kg−1 with a cell voltage of 1.4 V. This energy density outperforms some previous reports such as C-AQ//C-DHB (10 W h kg−1 at 0.18 kW kg−1),52 graphene/MnO2//graphene (7 W h kg−1 at 5 kW kg−1),53 Fe3O4/graphene//Fe3O4/graphene (9 W h kg−1 at 3 kW kg−1),54 graphene/MnO2//activated carbon nanofiber (8.2 W h kg−1 at 16.5 kW kg−1),55 Co(OH)2//Co(OH)2 (3.96 W h kg−1 at 42 kW kg−1).56
4. Conclusion
In a word, we designed and fabricated a novel electrode material (HAQ-rDCNTs) for supercapacitors on the basis of a simple chemical route. The electrochemically reversible HAQ molecules with fast redox kinetic feature were immobilize on the rDCNTs through a π–π stacking interaction. The electric conductivity of carbon backbone is not affected by moderate oxidation. The graphene sheets on the remanent or incomplete tube structure could be observed. The opened end of the nanotubes are good for transporting the electrolyte ions into the inner tubes during the rapid charge/discharge process. The unique structure and electrical conductivity of composites guarantee an outstanding super-capacitive performance for the as-prepared material. These results confirm that non-covalent functionalization strategy through organic molecules with reversible redox can obtain promising electrode materials for green and effective energy storage system.Conflicts of interest
There are no conflicts to declare.Acknowledgements
The authors gratefully acknowledge the financial support offered by the National Natural Science Foundation of China (21773187, 20963009, 21163017 and 21563027) and Specialized Research Fund for the Doctoral Program of Higher Education (No. 20126203110001).References
- G. Xiong, C. Meng, R. G. Reifenberger, P. P. Irazoqui and T. S. Fisher, Electroanalysis, 2014, 26, 30–51 CrossRef CAS.
- H. Wang, Y. Wang, Z. Hu and X. Wang, ACS Appl. Mater. Interfaces, 2012, 4, 6827–6834 CAS.
- P. Cheng, S. Gao, P. Zang, X. Yang, Y. Bai, H. Xu, Z. Liu and Z. Lei, Carbon, 2015, 93, 315–324 CrossRef CAS.
- P. Simon, Y. Gogotsi and B. Dunn, Science, 2014, 343, 1210–1211 CrossRef CAS PubMed.
- G. Wang, Y. Ling, F. Qian, X. Yang, X. X. Liu and Y. Li, J. Power Sources, 2011, 196, 5209–5214 CrossRef CAS.
- N. L. Torad, M. Hu, Y. Kamachi, K. Takai, M. Imura, M. Naito and Y. Yamauchi, Chem. Commun., 2013, 49, 2521–2523 RSC.
- Z. Wu, W. Ren, D. Wang, F. Li, B. Liu and H. Cheng, ACS Nano, 2010, 4, 5835–5842 CrossRef CAS PubMed.
- H. Peng, G. Ma, K. Sun, J. Mu, M. Luo and Z. Lei, Electrochim. Acta, 2014, 147, 54–61 CrossRef CAS.
- C. Long, D. Qi, T. Wei, J. Yan, L. Jiang and Z. Fan, Adv. Funct. Mater., 2014, 24, 3953–3961 CrossRef CAS.
- E. Raymundo-Piñero, F. Leroux and F. Béguin, Adv. Mater., 2006, 18, 1877–1882 CrossRef.
- J. Mu, G. Ma, H. Peng, J. Li, K. Sun and Z. Lei, J. Power Sources, 2013, 242, 797–802 CrossRef CAS.
- T. B. Schon, B. T. McAllister, P. F. Li and D. S. Seferos, Chem. Soc. Rev., 2016, 45, 6345–6404 RSC.
- V. Augustyn, P. Simon and B. Dunn, Energy Environ. Sci., 2014, 7, 1597–1614 CAS.
- S. Sun, Y. Chen and J. Yu, J. Phys. Chem. C, 2015, 119, 25770–25777 CAS.
- Y. Chen, Z. Wu and S. Sun, J. Phys. Chem. C, 2014, 118, 21813–21818 CAS.
- G. Wang, L. Zhang and J. Zhang, Chem. Soc. Rev., 2012, 41, 797–828 RSC.
- U. Patil, S. C. Lee, S. Kulkarni, J. S. Sohn, M. S. Nam, S. Han and S. C. Jun, Nanoscale, 2015, 7, 6999–7021 RSC.
- M. Boota, C. Chen, M. Bécuwe, L. Miao and Y. Gogotsi, Energy Environ. Sci., 2016, 9, 2586–2594 CAS.
- Q. Wu, Y. Sun, H. Bai and G. Shi, Phys. Chem. Chem. Phys., 2011, 13, 11193–11198 RSC.
- D. Larcher and J. M. Tarascon, Nat. Chem., 2015, 7, 19–29 CrossRef CAS PubMed.
- S. K. Kim, J. Cho, J. S. Moore, H. S. Park and P. V. Braun, Adv. Funct. Mater., 2016, 26, 903–910 CrossRef CAS.
- H. Wang, H. Yi, C. Zhu, X. Wang and H. Fan, Nano Energy, 2015, 13, 658–669 CrossRef CAS.
- N. An, Y. An, Z. Hu, B. Guo, Y. Yang and Z. Lei, J. Mater. Chem. A, 2015, 3, 22239–22246 CAS.
- S. E. Burkhardt, M. A. Lowe, S. Conte, W. Zhou, H. Qian, G. G. Rodríguez-Calero, J. Gao, R. G. Hennig and H. D. Abruña, Energy Environ. Sci., 2012, 5, 7176–7187 CAS.
- A. Jaffe, A. S. Valdes and H. I. Karunadasa, Chem. Mater., 2015, 27, 3568–3571 CrossRef CAS.
- V. Georgakilas, J. N. Tiwari, K. C. Kemp, J. A. Perman, A. B. Bourlinos, K. S. Kim and R. Zboril, Chem. Rev., 2016, 116, 5464–5519 CrossRef CAS PubMed.
- V. Georgakilas, M. Otyepka, A. B. Bourlinos, V. Chandra, N. Kim, K. C. Kemp, P. Hobza, R. Zboril and K. S. Kim, Chem. Rev., 2012, 112, 6156–6214 CrossRef CAS PubMed.
- B. Guo, Y. Yang, Z. Hu, Y. An, Q. Zhang, X. Yang, X. Wang and H. Wu, Electrochim. Acta, 2017, 223, 74–84 CrossRef CAS.
- D. Zheng, C. Wu, J. Li and L. Guan, Phys. E, 2013, 53, 155–160 CrossRef CAS.
- B. Xiao, X. Li, X. Li, B. Wang, C. Langford, R. Li and X. Sun, J. Phys. Chem. C, 2014, 118, 881–890 CAS.
- Y. Zhou, H. Xu, N. Lachman, M. Ghaffari, S. Wu, Y. Liu, A. Ugur, K. K. Gleason, B. L. Wardle and Q. M. Zhang, Nano Energy, 2014, 9, 176–185 CrossRef CAS.
- D. K. James and J. M. Tour, Macromol. Chem. Phys., 2012, 213, 1033–1050 CrossRef CAS.
- M. Büschel, C. Stadler, C. Lambert, M. Beck and J. Daub, J. Electroanal. Chem., 2000, 484, 24–32 CrossRef.
- E. Okuyama, K. Sato and K. Yoshihira, Phytochemistry, 1990, 29, 3973–3974 CrossRef CAS.
- L. Xie, H. Wang, C. Jin, X. Wang, L. Jiao, K. Suenaga and H. Dai, J. Am. Chem. Soc., 2011, 133, 10394–10397 CrossRef CAS PubMed.
- E. Asadian, S. Shahrokhian, A. Iraji zad and E. Jokar, Sens. Actuators, B, 2014, 196, 582–588 CrossRef CAS.
- V. Sahu, S. Shekhar, R. K. Sharma and G. Singh, ACS Appl. Mater. Interfaces, 2015, 7, 3110–3116 CAS.
- B. Song, J. Zhao, M. Wang, J. Mullavey, Y. Zhu, Z. Geng, D. Chen, Y. Ding, K. Moon, M. Liu and C. P. Wong, Nano Energy, 2017, 31, 183–193 CrossRef CAS.
- M. Yang, L. Hu, X. Tang, H. Zhang, H. Zhu, T. Fan and D. Zhang, Carbon, 2016, 110, 480–489 CrossRef CAS.
- X. Chen, H. Wang, H. Yi, X. Wang, X. Yan and Z. Guo, J. Phys. Chem. C, 2014, 118, 8260–8270 Search PubMed.
- H. Yue, D. H. Waldeck, K. Schrock, D. Kirby, K. Knorr, S. Switzer, J. Rosmus and R. A. Clark, J. Phys. Chem. C, 2008, 112, 2514–2521 CAS.
- M. Quan, D. Sanchez, M. F. Wasylkiw and D. K. Smith, J. Am. Chem. Soc., 2007, 129, 12847–12856 CrossRef CAS PubMed.
- X. Li, J. Shen, W. Sun, R. Wang, X. Hong, X. Zhao and X. Yan, J. Mater. Chem. A, 2015, 3, 13244–13253 CAS.
- B. Guo, Z. Hu, Y. An, N. An, P. Jia, Y. Zhang, Y. Yang and Z. Li, RSC Adv., 2016, 6, 40602–40614 RSC.
- G. A. Snook, P. Kao and A. S. Best, J. Power Sources, 2011, 196, 1–12 CrossRef CAS.
- Z. Algharaibeh and P. G. Pickup, Electrochem. Commun., 2011, 13, 147–149 CrossRef CAS.
- H. Wang, H. Yi, X. Chen and X. Wang, J. Mater. Chem. A, 2014, 2, 3223–3230 CAS.
- K. Karthikeyan, D. Kalpana, S. Amaresh and Y. S. Lee, RSC Adv., 2012, 2, 12322–12328 RSC.
- Z. Fan, J. Yan, T. Wei, L. Zhi, G. Ning, T. Li and F. Wei, Adv. Funct. Mater., 2011, 21, 2366–2375 CrossRef CAS.
- A. D. Jagadale, V. S. Kumbhar, D. S. Dhawale and C. D. Lokhande, Electrochim. Acta, 2013, 98, 32–38 CrossRef CAS.
- Y. Zhang, Z. Hu, Y. Liang, Y. Yang, N. An, Z. Li and H. Wu, J. Mater. Chem. A, 2015, 3, 15057–15067 CAS.
- J. Yan, Z. Fan, W. Sun, G. Ning, T. Wei, Q. Zhang, R. Zhang, L. Zhi and F. Wei, Adv. Funct. Mater., 2012, 22, 2632–2641 CrossRef CAS.
- X. L. Chen, W. S. Li, C. L. Tan, W. Li and Y. Z. Wu, J. Power Sources, 2008, 184, 668–674 CrossRef CAS.
- S. Giri, D. Ghosh and C. K. Das, Adv. Funct. Mater., 2014, 24, 1312–1324 CrossRef CAS.
- J. Yan, J. Liu, Z. Fan, T. Wei and L. Zhang, Carbon, 2012, 50, 2179–2188 CrossRef CAS.
- H. C. Huang, C. W. Huang, C. T. Hsieh and H. Teng, J. Mater. Chem. A, 2014, 2, 14963–14972 CAS.
Footnote |
| † Electronic supplementary information (ESI) available: Pore size distribution curve of DCNTs and HAQ-rDCNTs, XPS spectra of C 1s and O 1s regions for DCNTs, electrochemical characterization of HAQ, electrochemical characterization of HAQ-rDCNTs with different mass ratios. See DOI: 10.1039/c7ra09534a |
| This journal is © The Royal Society of Chemistry 2017 |

