 Open Access Article
Creative Commons Attribution 3.0 Unported Licence
Cell viability and hydration assay based on metamaterial-enhanced terahertz spectroscopy†
Yu Liu‡
a,
Mingjie Tang‡b,
Liangping Xiab,
Wenjing Yua,
Jia Penga,
Yang Zhanga,
Marc Lamy de la Chapellec,
Ke Yanga,
Hong-Liang Cui*bd and
Weiling Fu *a
*a
aDepartment of Laboratory Medicine, Southwest Hospital, Third Military Medical University, Chongqing 400038, China. E-mail: weiling_fu@126.com
bChongqing Key Laboratory of Multi-Scale Manufacturing Technology, Chongqing Institute of Green and Intelligent Technology, Chinese Academy of Sciences, Chongqing 400714, China. E-mail: hcui@cigit.ac.cn
cUniversité Paris 13, Sorbonne Paris Cité, Laboratoire CSPBAT, CNRS, (UMR 7244), 74 rue Marcel Cachin, F-93017 Bobigny, France
dCollege of Instrumentation Science & Electrical Engineering, Jilin University, Changchun, Jilin 130061, China
First published on 23rd November 2017
Abstract
As a fast-growing technology, terahertz time-domain spectroscopy (THz-TDS) is becoming increasingly pervasive in biological applications, targeting a range of biomaterials from biomolecules to tissues. However, THz-TDS studies at the cellular level are quite limited. Thus, a study to analyze the living state and hydration state of a tumor cell in a label-free manner is carried out and reported here. Combined with a specially designed THz metamaterial, a tumor cell monolayer was detected continuously over a period of time. In addition, in order to explore the possible impact of the metamaterial on tumor cells, the secretion of IL-6, IL-8, GM-CSF and GROα of cell supernatants was detected. The results demonstrated that the technology could characterize the living state by monitoring the extracellular water and investigate the hydration state inside a tumor cell in real time, showing great application potential for the label-free detection of normal cells and tumor cells of diverse malignant degree.
1. Introduction
Biomedical research at the cellular level is deemed important, as cells are considered the basic units of structure and function in forming organisms. A variety of methods for cell detection have been advanced to acquire individual-cell related information, such as microscopy, immunohistochemistry, electrophysiology, and so on.1–3 However, these methods invariably need to mark cells with biotin or fluorochrome that not only act as labels, but unavoidably influence the activity of cells; moreover, they must collect data at predetermined times, so the complete cellular events tend to be ignored, and the detection index cannot show the accurate changes of cell physiology in cellular processes.4,5 Although, to date, label-free detection technologies have achieved rapid development, including atomic force microscopy, Raman spectroscopy, and various biosensors,6–8 clinical pathologic diagnosis based on morphology is still regarded as the golden criterion.9 Therefore, it is critical to further explore other label-free detection methods for fast and accurate diagnosis.Recently, rapid development of terahertz (THz) technology is ushering in a tantalizing possibility for another label-free and non-contact detection approach on biological substances.10 THz radiation ranging from 0.1 to 10 THz (1 THz = 1012 Hz) has very low photon energy (1 THz to 4 meV), effectively avoiding harmful ionization to biological samples, and is highly sensitive to polar substances such as water.11 Of particular interest in biology, the energy of weak intermolecular interactions such as hydrogen bonds, van der Waals force and hydrophobic interaction, and framework vibration and dipole rotation of molecules all lie within the THz region; and as a result, THz technology has been extensively applied to characterize the features of various biological substances.12–16
However, due to the fact that no cells can live without a watery environment, and the strong THz absorption of water restricts the effective information acquisition in an aqueous environment,17 THz research at the cellular level has encountered strong scepticism. Usually the absorption coefficients increased monotonously and continually with frequency.18,19 Thus, it can be achieved to distinguish different cells in aqueous solutions, only through dependence on typical intracellular substances.20 Although THz differential time-domain spectroscopy have been shown to have superior sensitivity in detecting minute structural changes using a cultured cell monolayer, the tremendous absorption of water was still the most serious problem, limiting further applications.21 Currently, in order to avoid the influence of water to the greatest extent possible, THz time-domain attenuated total reflection (THz TD-ATR) makes use of the reflection mode, obtaining the complex dielectric constants, intracellular water dynamics and permeabilization of living cells.17,22,23 Therefore, when the interference of water is overcome, THz technology will hopefully provide an innovative approach to obtain much valuable cellular information and even resolve issues that remain unaddressed to date.
Faced with the current situation, metamaterials, the artificial structures composed of sub-wavelength metallic arrays, have received extensive attention to improve the THz detecting sensitivity,24 owing to its unique electromagnetic resonances sensitive to minute changes in its surrounding environment. Great hopes have been placed on such man-made materials for detecting living cells and microorganisms.25 Among the endless variety of metamaterials, the most widely studied is the split-ring resonator (SRR) in the THz region.26 The SRR is so extraordinarily sensitive to the substance deposited over its surface, that it will provide a feasible approach to detect cell monolayer in aqueous environment with a thin water layer.27 Moreover, the THz radiation response of the SRR not only reflects in the change of resonance frequency, but also in peak attenuation.28
In this study, we combined THz time-domain spectroscopy (THz-TDS) with a particular type of SRR-based metamaterial to measure tumour cell monolayer, for the sake of representing the living state of cells by monitoring the extracellular water and investigating hydration state inside the tumour cell in a label-free manner. The U87 cell cultured on the SRR was continuously detected until the THz response no longer changed. The resulting THz time-domain waveform was transformed by Fast Fourier Transform, and analysed for changes of the resonance frequency and the transmission spectrum. In addition, in order to assess the possible impact of the metamaterial on tumour cells, we detected the secretion of IL-6, IL-8, GM-CSF and GROα of cell supernatants by ELISA, evaluating the function of the SRR comprehensively.
2. Materials and methods
2.1 Fabrication of the metamaterial
The metamaterial composed of metallic square arrays of five square rings with four micro-gaps symmetrically located in each ring was fabricated by a conventional photo-lithography technique on a high-resistance silicon (Si) substrate with a thickness of 400 μm. 20 nm thick chromium (Cr) and 200 nm thick gold (Au) metal films were successively deposited on the Si substrate in order to pattern the SRR structure with a period of 58 μm, gap size of 3 μm, linewidth of 2 μm, and line length of 48 μm, as depicted in Fig. 1.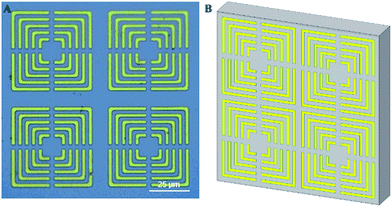 | ||
| Fig. 1 The structure of THz metamaterial. (A) An optical microscope image of THz metamaterial. (B) A schematic presentation of THz metamaterial. | ||
2.2 THz spectroscopic measurement
THz transmission spectra were measured by applying a commercial THz-TDS system (Advanced Photonix, Inc., T-Ray 5000), with the spectral resolution of 12.5 GHz. The femtosecond pulses were produced by a Ti-sapphire laser with a central wavelength of 1064 nm, a repetition rate of 100 MHz, and duration of <100 fs. The pulses were divided into two parts by a polarizing beam splitter, one as the probe beam directly irradiating on the photoconductive antenna (PCA), and the other as the pump light gathering on another PCA that had been biased electrically to generate THz radiation with an average power of 130 nW, which was focused on and penetrated the metamaterial. The THz signals irradiated on the second PCA were sampled discretely by the probe light to acquire the time-domain waveforms.The metamaterial substrates placed and fixed on the sample holder, were perpendicular to the horizontal plane, between the radiation transmitter and detector. Besides, in order to collect the energy of long wave adequately, there was a metal plate with a circular hole with a diameters of 13 mm in front of the sample. THz time-domain waveforms of the metamaterial covered with a cell monolayer were detected in transmission mode periodically with an interval of time (5 s), until no further change under the same experimental conditions was observable, at room temperature of 24 °C and a relative humidity of 3% and 7% respectively, maintained by the purge of nitrogen gas. The time-domain data of samples were converted into frequency domain data through Fourier transform firstly, and then the transmission of the samples are calculated by normalizing the power values with the reference of air. The effective frequency region ranges from 0.1 to 2.0 THz.
2.3 Sample preparation
Human brain glioblastoma U87 cells (CHI Scientific Incorporation, China) were cultured in Dulbecco's Modified Eagle Medium (DMEM) containing 10% fetal bovine serum and 1% penicillin–streptomycin (both from Invitrogen, Grand Island, NY, USA) at 37 °C with 5% CO2 in a humidified atmosphere. Cells at a density of 3 el106 per 3 ml of media were cultured on Petri dishes and cleaned metamaterial substrate completely covered with SRRs, prior to experiments simultaneously. Cells were cultured for around 24 h to fully cover and adhere directly onto the metamaterial surface with the cell monolayer. Before a THz-TDS measurement, the samples were washed with PBS twice, followed by maximal removal of the remaining water from the surface by blotting papers.2.4 Finite element method simulation
Based on the structure parameters mentioned in the part of fabrication of the metamaterial, the resonance behaviour and the surface electric field distribution of the metamaterial were predicted and analysed with the finite element method (FEM) using commercial software (COMSOL). Additionally, the shifts of the resonance frequencies had also been simulated by varying the dielectric constant ε of the model with values ranged from 2.0 to 9.0 at the low-frequency resonance.2.5 Cytokine secretion measurement by ELISA
Cell supernatants on Petri dishes and cleaned SRR were collected and centrifuged at 3000 rpm for 5 min to remove cells. The supernatants were stored at −80 °C prior to assay. Interleukin-6 (IL-6), interleukin-8 (IL-8), human granulocyte-macrophage colony stimulating factor (GM-CSF), and human growth regulated oncogene alpha (GROα) were measured by ELISA. Triplicates were run per sample. The detection results were analysed through independent-samples t test by SPSS.3. Results
3.1 THz-TDS detection of U87 cell monolayer
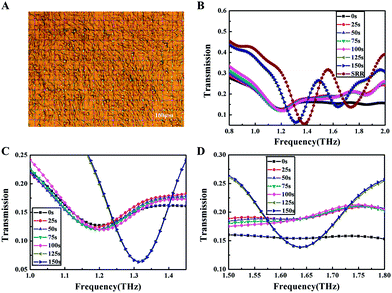
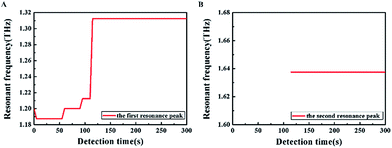
We first performed THz transmission spectroscopy of the metamaterial covered with U87 cell monolayer, as shown in Fig. 2A. Under a relative humidity of 3% and with a measurement time of 5 s, a series of resonance frequencies has been observed, but in order to clearly show the results, a representative result of the whole detection procedure had been presented in Fig. 2B. Two resonance peaks of the blank SRR were obtained, located at 1.375 THz and 1.737 THz, respectively. Fig. 2C and D show the better-visualized results of the first and the second resonance peaks respectively. In order to verify the repeatability of the measurements, parallel experiments had been carried out, and consistent results were achieved (see ESI Fig. S-1 and S-2†). What's more, when the relative humidity was increased to 7%, the resonance frequencies under different detection times were changed regularly (see ESI Fig. S-3 and S-4†).The resonance frequencies of the cells under different detection times have been studied and described in detail, as shown in Fig. 3. The change of the first resonance peak was illustrated in Fig. 3A, with its time evolution divided into five phases to facilitate its understanding. The resonance frequency of the first phase was at 1.2 THz, promptly following the placement of the SRR in the detection box; during the second phase it was located at 1.187 THz, continuing for about 50 s. At 60 s, the resonance frequency shifted to 1.2 THz, and continued for 90 s. After another 5 s, the resonance frequency reached 1.212 THz, which briefly lasted for 15 s; ultimately, the resonance frequency stabilized around 1.312 THz and did not show any noticeable change again with time. The change of the second resonance peak as a function of time was showed in Fig. 3B. Interestingly, here the resonance peak did not appear until 115 s into the experiment, and thereafter it remained at 1.637 THz for the duration of the measurement.
3.2 THz-TDS detection of PBS
Although we have done everything possible to maximally remove the PBS on the surface of the cell monolayer, inevitably there was still minute amount of residual PBS left. Thus we have specially detected the influence of PBS alone on the SRR. In order to roughly estimate the PBS layer thickness, correspond to the thickness of a monolayer cell, an AFM image was taken to acquire the height of a single cell (Fig. 4A), indicating the maximum height of the monolayer of cells is about 5.033 μm. Therefore, we need to control the PBS layer thickness to value above 5.033 μm to match the condition of cell detection as close as possible. To that end, we added 5 μl and 10 μl PBS to the metamaterial, and covered with the polyester film with a thickness of 0.25 mm that is transparent in the THz range to make certain that the PBS cover the whole metamaterial (size: 2.45 × 2.45 cm2). The PBS layer thickness was calculated from the formula: V = S × h, where V is the liquid volume, S the area of the metamaterial, and h the height of the liquid layer. The calculations revealed that the heights were 8.33 μm and 16.66 μm, respectively, corresponding to the two sample volumes, matching the heights of the monolayers of cells.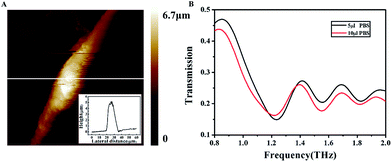 | ||
| Fig. 4 (A) AFM images of the U87 cell. (B) THz transmission spectra of the PBS measured with different volumes. | ||
The PBS layer with different thicknesses had a disparate effect on the resonance frequency of the SRR as shown in Fig. 4B. Obviously, the first resonance peaks were not only different with regard to the resonance frequency, with 1.237 THz for 5 μl PBS and 1.225 THz for 10 μl PBS, but also with regard to transmission, showing that the transmission of the 5 μl PBS sample was lower than that of the 10 μl PBS. Thus, compared to the 10 μl PBS sample, the 5 μl PBS sample seemed to exert a lesser influence on the SRR, both in terms of the resonance frequency and the transmission of the first resonance peak. However, for the second resonance peak, such difference is only discernible in the transmission, with the transmission of the 5 μl PBS sample higher than that of the 10 μl PBS sample, contrary to the first resonance peak. Therefore, it is concluded that the second resonance peak is somehow less sensitive than the first resonance peak to the PBS layer thickness.
3.3 Finite element method simulation
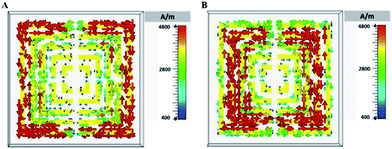
We carried out FEM electromagnetic simulation to analyse the performance of the metamaterial, working at the resonance frequency points (1.375 THz and 1.737 THz) (Fig. 5). The surface current distribution of a metamaterial element respectively concentrated in the outermost ring at the low-frequency resonance point (Fig. 5A), and in the middle ring at the high-frequency resonance point (Fig. 5B). Therefore, the low-frequency resonance was mainly caused by the resonance of the outermost ring, and the high-frequency resonance by the middle ring.In order to analyse the spectral changes, the shifted resonance frequencies had been obtained (Fig. 6). The result indicated that there was a good linear relation between the resonance frequency shifts and the dielectric constant ε. In addition, the minimum change of resonance frequency could reach 2 GHz when the dielectric constant merely changed 0.2, which was much smaller than the change of resonance frequency in the experiment. This meant that the metamaterial had a high sensitivity to the variation of dielectric constants ε.
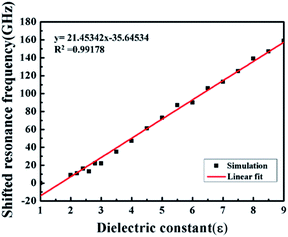 | ||
| Fig. 6 The correlation between the shifted resonance frequency and dielectric constant ε at the 1.375 THz resonance. | ||
3.4 Cytokine secretion
In order to verify whether there was any influence of the metamaterial itself on the cell growth and state, concentrations of IL-6, IL-8, GM-CSF and GROα had been obtained (Fig. 7). Relevant statistical results showed that there were obvious differences (P < 0.05) in cytokine concentrations of cell supernatants between the experimental groups and control groups, with statistical significance. The concentrations of IL-8, GM-CSF and GROα in the experimental groups were significantly lower than those in the control groups, with only the result of IL-6 being the opposite.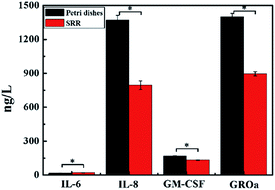 | ||
| Fig. 7 Cytokines secretion (IL-6, IL-8, GM-CSF and GROα) of cell supernatants were determined by ELISA on the Petri dishes and SRR. The data are shown as the mean ± standard deviation. *P < 0.05. | ||
4. Discussion
Based on the experimental results, we attempted to understand the time evolution of the resonance peak generated by the SRR covered with U87 cell monolayer. It is undeniable that the most direct and significant impact on the living cells in the dry sample condition is the changes of water content. In addition, at the tissue level, extensive researches had been conducted among various tissues and demonstrated a marked difference of the real part of the dielectric constant between the paraffin-embedded tissues and freshly excised tissues, indicating that the water contents of the tissues could affect the complex dielectric constants significantly.29,30 Thus, we speculate that the change of cell water content is the most important reason for the variation of the resonance peak in time.4.1 Analysis of the second resonance peak
We first considered the second resonance peak (Fig. 3B), which did not appear until a much later time, but it happened for samples with different heights of the PBS layer. Due to the dry sample conditions, the moisture loss was almost complete, thus we think the cells were in a state of complete water loss when the resonance peak appeared, without any concomitant changes in the transmission and resonance frequency. In other words, the cells containing any water had a strong effect on the second resonance peak. Therefore the second resonance peak can be used as some kind of indicator of the presence of water in the cells, and it can further distinguish effectively the cell state, especially survival status and inactive states.4.2 Analysis of the first resonance peak
Compared to the second resonance peak, there were more complicated changes in the first resonance peak with more nuances (Fig. 3A). The resonance frequency was 1.2 THz when the sample was measured at the beginning, and subsequently the frequency shifted to 1.187 THz. Therefore, large amount of water had contributed to the influence of cells on the SRR, as the resonance frequency of the PBS layer exceeded 1.2 THz, and the surface of the sample inevitably was permeated with water. However, the cells played an increasingly dominant role with the decrease of surface water, leading to the reduction of the resonance frequency. Finally, at 115 s, the resonance frequency reached a stable value of 1.312 THz, indicating that there was no more water inside or outside the cells. Moreover, this time coincided with the initial time of appearance of the second resonance peak, corroborating our hypothesis of the last paragraph.Before the cells were dried out thoroughly in a relative humidity of 3%, the resonance peak evolved in sequential order over three frequencies, 1.187 THz, 1.2 THz, and 1.212 THz, dwelling for 50 s, 30 s and 15 s, respectively at each value. More importantly, when the relative humidity was improved to 7%, the duration of each phase also increased, lasting for 65 s, 35 s and 20 s, respectively. This should be pretty easy to understand, due to the higher humidity. Not surprisingly, with regard to the cell monolayer, there were three different states of water, i.e., extracellular water, and intracellular water that can be further divided into bulk water and hydration water. It is a common knowledge that the extracellular water is not bound by the cell membrane; but conversely the cell membrane can restrict the activity of intracellular water.
Besides, the research has shown that the real and imaginary parts of the complex dielectric constant of bulk water was about 3.5–6.0 and 1.5–6.0, respectively, ranging from 0.3 to 3.0 THz.17 In our experiment, the shifted resonance frequencies were from 63 GHz to 175 GHz at the first resonance peak, requiring a dielectric constant of 4.6–9.8 according to the result of FEM simulations, which can well match with the reported dielectric constant of bulk water. For intracellular water, an increasing number of techniques have been brought to understand.31,32 In particular, using nonlinear optical Kerr effect microscopy, it has been found that under physiological conditions, the structural relaxation of intracellular water inside a whole culture cell was 1.7 times slower than in bulk water.33 Thus it is likely that the hydration water and biological macromolecules within the cells could somehow restrict the mobility of intracellular water.
Therefore, it is speculated that the extracellular water was depleted first, followed by the bulk water and hydration water loss inside the cells, happening in succession. Moreover, since the three frequencies of the resonance peaks were in accordance with the three states of the cellular water, one might be tempted to conjecture whether there was a one-to-one correlation thereof. More specifically, the resonance peak located at 1.187 THz could indicate that there was still extracellular water around the cells, signalling the structural and organizational integrity of the cells. When the extracellular water was depleted and the integrity of the cells began to deteriorate, a loss of the bulk water could cause the blue-shift of the resonance frequency. Eventually, the bonds between water molecules and biological macromolecules broke, and with the decrease of the hydration water, the resonance frequency underwent a further blue-shift. Although this is at best an educated guess, and more evidences are needed in order to fully authenticate it, its plausibility is nonetheless tantalizing.
Apart from the research on the dynamics of water, another important scientific issue concerns the hydration state inside the cells. Research using nuclear magnetic resonance spectroscopy34 had shown that 85% of the water inside cells exhibited bulk-like dynamics, while the remaining 15% was retarded motionally due to the direct interactions with biomolecular surfaces. Recently, THz TD-ATR have been utilized to analyse the hydration state in HeLa cell monolayer, and the calculation revealed that the intracellular water hydrated to biomolecules was accurately 23.8 no7.4% by the extended theory of Onsager.22 This has laid a sound foundation for the research to explore further the characteristic of intracellular water hydration state. However, there is still no definitive conclusions vis-a-vis intracellular water, on account of the lack of a solid theoretical basis and overwhelming experimental evidences.35 In this vein, though the findings here are likely unique to these experimental conditions and cannot, without qualification, be extrapolated to functioning cells under normal environments, our study nevertheless provides a supplemental method to monitor the water content and evaluate the state of cells in real time and without the need for labels.
As the changes of the resonance frequency are closely related to the complex dielectric constants of the samples, SRR can also provide the characteristic complex dielectric constants of cells and tissues, at least in theory. More importantly, there are obvious differences in the water contents of the different cell types, particularly between normal cells and the tumour cells,36 and water contents can serve as an indicator of different malignant degrees of tumour cells.37 Therefore, combined THz SRR spectroscopy ushers in new possibilities to distinguish different kinds normal and tumour cells, as well as malignant degrees of the latter, and this may soon prove practical through improved detection sensitivity by perfecting the design, fabrication, and functional modifications of the metamaterial.
4.3 Cytokine analysis
It is generally known that IL-6 and IL-8 are angiogenesis inducers for tumour cells,38 and in senescent cells IL-6 is a major secreted factor.39 It has been reported that for human brain glioblastoma cells, IL-6 can promote invasiveness, and GM-CSF can enhance cell proliferation.40,41 Although to our knowledge there has been no reference about the effect of GROα on glioblastoma cells, from the research results on other tumour cells, it can be inferred that GROα could also promote tumour development.42 Increasingly, these cytokines have been regarded as novel targets in tumour therapy.43 However, based on consequences of cytokine analysis, we found that the metamaterial did not expedite tumour progression, nor did it increase the malignant degree. Such benign behaviour is obviously heartening, in so far as the metamaterial is at the centre of a promising diagnostic tool when combined with THz spectroscopy, as we showed herein. Needless to say, further study is required to learn how to perfect the metamaterial to completely eliminate its impact on the cells under test.5. Conclusions
In conclusion, we have studied the THz spectroscopic responses of U87 cell monolayer cultured on a specifically designed metamaterial, as a function of time, and observed clear shifts in the resonance frequencies and changes in the transmissions associated with different cellular states. Results showed that there were two resonance peaks, the first could be used to characterize the living state of the cells by monitoring the extracellular water and to investigate the hydration state inside a tumour cell; and the second resonance peak could serve as a supplement and verification to the first one in real time and without the need for labels. However, since significant changes of the cytokine concentrations had been tested, we should further explore the reason and strive to avoid their influence. In the future, researches in this area will undoubtedly benefit from the continuous and never-ending improvement of THz technology and THz metamaterials, which will improve the sensitivity of THz detection to distinguish normal cells and tumour cells of different malignant degree, even to achieve quantitative determination of high sensitivity, thus finally achieving label-free detection of live cells to open up a new avenue of diagnostic approaches.Conflicts of interest
There are no conflicts to declare.Acknowledgements
This work has been supported partially by National Basic Research Program of China (Program 973) (No. 2015CB755400) of China, the National Natural Science Foundation of China (No. 81430054), and the Military Medical Pre-research Funds of The Third Military Medical University (No. SWH2013JS05), and the Physics and Biomedical Cross Laboratory Incubator Funds (No. WSS-2014-08).References
- A. Tomono, T. Itoh, E. Yanagita, N. Imagawa and Y. Kakeji, Medicine, 2015, 94, e501 CrossRef CAS PubMed.
- P. Sergiy, B. Eric, R. David and M. Michel, J. Biophotonics, 2015, 8, 401–407 CrossRef PubMed.
- J. T. Aerts, K. R. Louis, S. R. Crandall, G. Gubbi, C. L. Cox and J. V. Sweedler, Anal. Chem., 2014, 86, 3203–3208 CrossRef CAS PubMed.
- V. Magidson and A. Khodjakov, Methods Cell Biol., 2013, 114, 545–560 Search PubMed.
- M. M. Frigault, L. Judith, J. L. Swift and C. M. Brown, J. Cell Sci., 2009, 122, 753–767 CrossRef CAS PubMed.
- A. Pallaoro, M. R. Hoonejani, G. B. Braun, C. D. Meinhart and M. Moskovits, ACS Nano, 2015, 9, 4328–4336 CrossRef CAS PubMed.
- J. M. Hillger, J. Schoop, D. I. Boomsma, P. E. Slagboom, A. P. Ijzerman and L. H. Heitman, Biosens. Bioelectron., 2015, 74, 233–242 CrossRef CAS PubMed.
- S. Eleftherios, C. E. Hills, M. Y. G. Younis, P. E. Squires and L. Kuo-Kang, FEBS Lett., 2014, 588, 1178–1183 CrossRef PubMed.
- M. Lekka, D. Gil, K. Pogoda, J. Dulinska-Litewka, R. Jach, J. Gostek, O. Klymenko, S. Prauzner-Bechcicki, Z. Stachura, J. Wiltowska-Zuber, K. Okon and P. Laidler, Arch. Biochem. Biophys., 2012, 518, 151–156 CrossRef CAS PubMed.
- X. Yang, X. Zhao, K. Yang, Y. Liu, Y. Liu, W. Fu and Y. Luo, Trends Biotechnol., 2016, 34, 810–824 CrossRef CAS PubMed.
- X. Yang, D. Wei, S. Yan, Y. Liu, S. Yu, M. Zhang, Z. Yang, X. Zhu, Q. Huang and H. L. Cui, J. Biophotonics, 2016, 347–370 Search PubMed.
- M. Tang, Q. Huang, D. Wei, G. Zhao, T. Chang, K. Kou, M. Wang, C. Du, W. L. Fu and H. L. Cui, J. Biomed. Opt., 2015, 20, 095009 CrossRef PubMed.
- L. Xie, Y. Yao and Y. Ying, Appl. Spectrosc. Rev., 2014, 49, 448–461 CrossRef CAS.
- H. Dibo, L. Xian, C. Jinhui, M. Yehao, K. Xusheng, H. Pingjie and Z. Guangxin, Phys. Med. Biol., 2014, 59, 5423–5440 CrossRef PubMed.
- Y. J. Son, D. K. Lee and J. H. Son, Curr. Appl. Phys., 2016, 16, 45–50 CrossRef.
- S. Fan, B. S. Ung, E. P. Parrott, V. P. Wallace and E. Pickwell-Macpherson, J. Biophotonics, 2016, 10, 1143–1151 CrossRef PubMed.
- K. Shiraga, Y. Ogawa, T. Suzuki, N. Kondo, A. Irisawa and M. Imamura, Appl. Phys. Lett., 2013, 102, 053702 CrossRef.
- J. Kiyoung, H. Yong-Min, K. Sang-Hoon, P. Yeonji, S. Joo-Hiuk, O. Seung Jae and S. Jin-Suck, J Biomed Opt, 2013, 18, 312–314 Search PubMed.
- H. Liu, G. Plopper, S. Earley, Y. Chen, B. Ferguson and X.-C. Zhang, Biosens. Bioelectron., 2007, 22, 1075–1080 CrossRef CAS PubMed.
- H. Cheon, H.-J. Yang, S.-H. Lee, Y. A. Kim and J.-H. Son, Sci. Rep., 2016, 6, 37103 CrossRef CAS PubMed.
- H.-B. Liu, G. Plopper, S. Earley, Y. Chen, B. Ferguson and X. C. Zhang, Biosens. Bioelectron., 2007, 22, 1075–1080 CrossRef CAS PubMed.
- K. Shiraga, T. Suzuki, N. Kondo, K. Tanaka and Y. Ogawa, Appl. Phys. Lett., 2015, 106, 253701 CrossRef.
- K. Shiraga, Y. Ogawa, T. Suzuki, N. Kondo, A. Irisawa and M. Imamura, J. Infrared, Millimeter, Terahertz Waves, 2014, 35, 493–502 CrossRef CAS.
- K. Scholten, X. Fan and E. T. Zellers, Lab Chip, 2014, 14, 3873–3880 RSC.
- S. J. Park, J. T. Hong, S. J. Choi, H. S. Kim, W. K. Park, S. T. Han, J. Y. Park, S. Lee, D. S. Kim and Y. H. Ahn, Sci. Rep., 2014, 4, 1–75 Search PubMed.
- C. Drexler, T. V. Shishkanova, C. Lange, S. N. Danilov, D. Weiss, S. D. Ganichev and V. M. Mirsky, Microchim. Acta, 2014, 181, 1857–1862 CrossRef CAS.
- S.-Y. Chiam, R. Singh, J. Gu, J. Han, W. Zhang and A. A. Bettiol, Appl. Phys. Lett., 2009, 94, 064102 CrossRef.
- F. Miyamaru, K. Hattori, K. Shiraga, S. Kawashima, S. Suga, T. Nishida, M. W. Takeda and Y. Ogawa, J. Infrared, Millimeter, Terahertz Waves, 2013, 35, 198–207 CrossRef.
- P. C. Ashworth, E. Pickwell-MacPherson, E. Provenzano, S. E. Pinder, A. D. Purushotham, M. Pepper and V. P. Wallace, Opt. Express, 2009, 17, 12444–12454 CrossRef CAS PubMed.
- K. Meng, T.-N. Chen, T. Chen, L.-G. Zhu, Q. Liu, Z. Li, F. Li, S.-C. Zhong, Z.-R. Li, H. Feng and J.-H. Zhao, J. Biomed. Opt., 2014, 19, 077001 CrossRef PubMed.
- B. F. Moeava Tehei, K. Wood, F. Gabel, E. Fabiani, M. Jasnin, M. Zamponi, D. Oesterhelt, G. Zaccai, M. Ginzburg and B.-Z. Ginzburg, Proc. Natl. Acad. Sci. U. S. A., 2007, 104, 766–771 CrossRef PubMed.
- F. Sebastiani, A. Orecchini, A. Paciaroni, M. Jasnin, G. Zaccai, M. Moulin, M. Haertlein, A. De Francesco, C. Petrillo and F. Sacchetti, Chem. Phys., 2013, 424, 84–88 CrossRef CAS.
- E. O. Potma, W. P. de Boeij and D. A. Wiersma, Biophys. J., 2001, 80, 3019–3024 CrossRef CAS PubMed.
- E. Persson and B. Halle, Proc. Natl. Acad. Sci. U. S. A., 2008, 105, 6266–6271 CrossRef CAS PubMed.
- P. Ball, ChemPhysChem, 2008, 9, 2677–2685 CrossRef CAS PubMed.
- G. M. Png, J. W. Choi, B. W. H. Ng, S. P. Mickan, D. Abbott and X. C. Zhang, Phys. Med. Biol., 2008, 53, 3501–3517 CrossRef CAS PubMed.
- G. I. Mcintyre, Med. Hypotheses, 2006, 66, 518–526 CrossRef CAS PubMed.
- J. P. Coppé, P. Y. Desprez, A. Krtolica and J. Campisi, Annu. Rev. Pathol.: Mech. Dis., 2010, 5, 99–118 CrossRef PubMed.
- T. Kuilman, C. Michaloglou, W. J. Mooi and D. S. Peeper, Genes Dev., 2010, 24, 2463–2479 CrossRef CAS PubMed.
- R. Li, G. Li, L. Deng, Q. Liu, J. Dai, J. Shen and J. Zhang, Oncol. Rep., 2010, 23, 1553–1559 CAS.
- C. S. Curran, M. D. Evans and P. J. Bertics, J. Immunol., 2011, 187, 1254–1263 CrossRef CAS PubMed.
- S. Fimmel, L. Devermann, A. Herrmann and C. Zouboulis, Ann. N. Y. Acad. Sci., 2007, 1119, 176–189 CrossRef CAS PubMed.
- J. Michaud-Levesque, N. Bousquet-Gagnon and R. Béliveau, Exp. Cell Res., 2012, 318, 925–935 CrossRef CAS PubMed.
Footnotes |
| † Electronic supplementary information (ESI) available. See DOI: 10.1039/c7ra09609g |
| ‡ The authors contributed equally to this work. |
| This journal is © The Royal Society of Chemistry 2017 |

