 Open Access Article
Creative Commons Attribution 3.0 Unported Licence
A novel Nb2O5/Bi2WO6 heterojunction photocatalytic oxidative desulfurization catalyst with high visible light-induced photocatalytic activity
Jing Wu,
Jian Li,
Jin Liu,
Jin Bai and
Lina Yang *
*
College of Chemistry, Chemical Engineering and Environmental Engineering, Liaoning Shihua University, 113001, Liaoning, P. R. China. E-mail: yanglnzg@163.com
First published on 2nd November 2017
Abstract
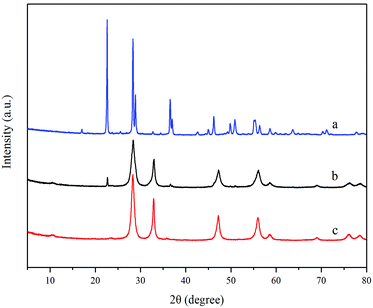
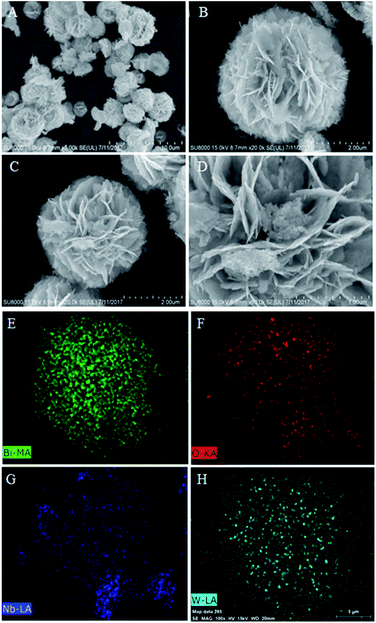
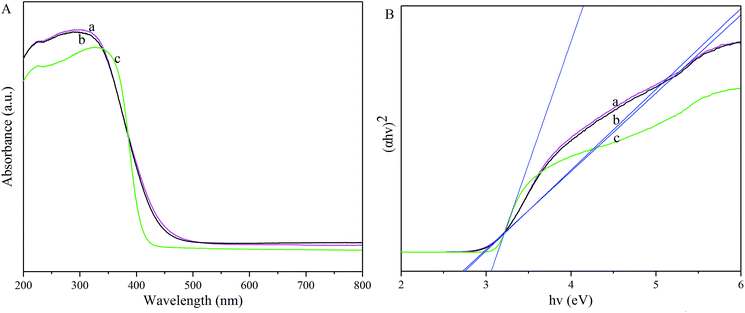
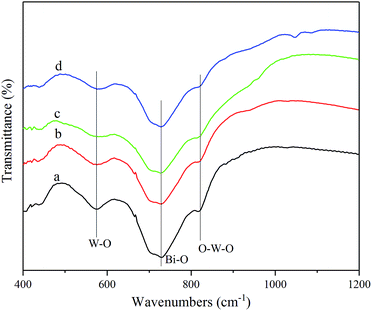
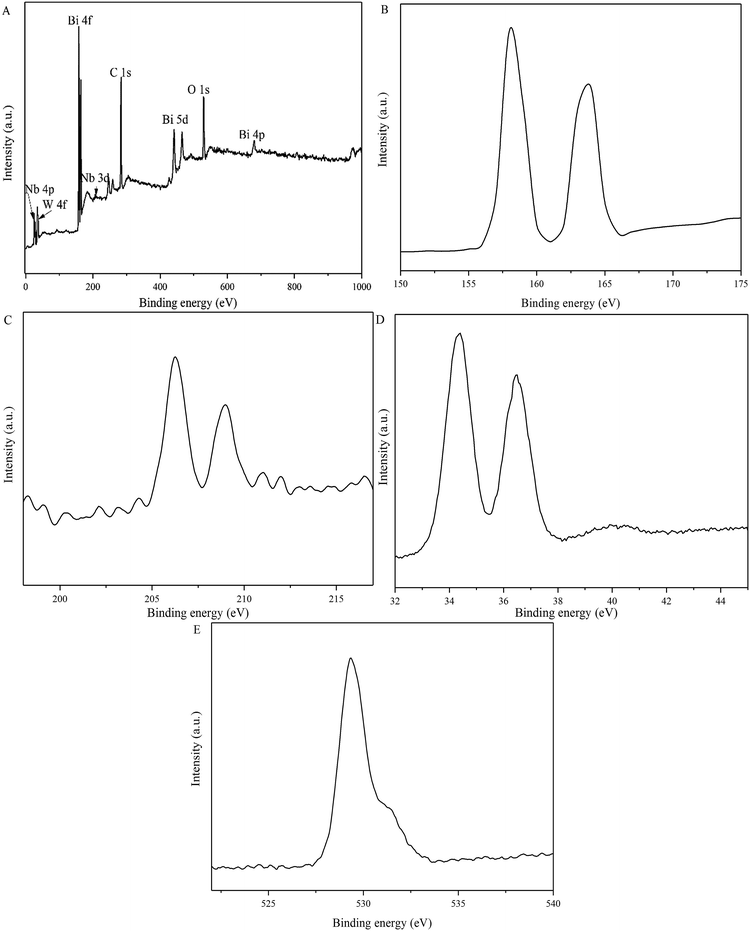
A novel Nb2O5/Bi2WO6 heterojunction catalyst was successfully synthesized via a one-pot solvothermal process. The catalyst was characterized by X-ray diffraction (XRD), scanning electron microscopy (SEM) with the corresponding XEDS energy mapping, UV-vis diffuse reflection spectra (UV-vis DRS), Fourier transform infrared (FTIR) spectroscopy and X-ray photoelectron spectroscopy (XPS). The photocatalytic oxidative desulfurization performances of the prepared samples were studied with DBT as the model sulfur compound under visible light irradiation. Results indicated that the Nb2O5/Bi2WO6 exhibited considerably higher activity than pure Nb2O5 and Bi2WO6 and the desulfurization rate achieved 99% after visible light irradiation for 120 min. The catalyst also possessed good stability so that the desulfurization rate remained about 90% after seven cycle times and then the crystal structure of the catalyst has barely changed. Such enhanced photocatalytic activity is mainly attributed to the effective separation of photogenerated electron–hole pairs on Nb2O5/Bi2WO6 heterojunction. Moreover, the synergistic effects of this photocatalytic oxidation and the extraction with the methanol as the solvent played an indispensable role in the desulfurization.
1. Introduction
Sulfur oxides (SOx) released from the combustion of transportation fuels lead to atmospheric haze, acid rain and many other environmental issues.1–3 Numerous countries have promulgated regulations to restrict the sulfur content in fuels, some of them demanding that the sulfur content of diesel and gasoline must be less than 10 μg g−1 even sulfur-free for regular gasoline.4 Therefore, to meet the demand of liquid fuels with ultra-low sulfur content, the development of deep desulfurization technologies has become a hot subject nowadays.It is well known that applications of visible light in addressing environmental issues have attracted more and more attention.5–8 In the same way photocatalytic oxidative desulfurization (PODS) method, especially the visible light-induced PODS, as one of the promising new method for deep desulfurization of fuels has gained great interest because of its mild operation conditions and resultant low investment and operating costs.9 Various studies on the PODS process have been reported in the past few years.10–12 So many photocatalysts, such as TiO2,13 TiO2/g-C3N4,14 CeO2/TiO2,12 Bi2WO6,15 Bi2W1−xMoxO6/montmorillonite (MMT)16 and so on, have been applied in the PODS process.
Nevertheless, developing more efficient visible light photocatalytic material for the desulfurization is still an imperative challenge for researchers. Niobium oxide (Nb2O5), as n-type transition oxide semiconductor, has been widely used in many fields, such as photocatalytic hydrogen production, photodegradation of organic contaminants and so on.17,18 However, for the single-phase Nb2O5, the low quantum yield caused by the rapid recombination of photogenerated electron and hole limited their application. To address this concern, some researchers loaded some amounts of metal or non-metal to Nb2O5. Some reports on combining Nb2O5 with other semiconductor to synthesize the heterojunction have also been found in the field of photocatalysis.19–22 The heterojunction can inhibit the recombination of photogenerated hole–electron pair consequently the heterojunction which was constructed based on the different Fermi level of Nb2O5 from another semiconductor has been proven more effective than the loaded catalysts. Recently, a few Nb2O5 composited heterojunctions have been reported, such as Ag3PO4/Nb2O5,21 Nb2O5/TiO2,22 Nb2O5/SrNb2O6![[thin space (1/6-em)]](https://www.rsc.org/images/entities/char_2009.gif) 23 and so on. And such catalysts were mostly applied in the degradation of polluted water under visible light irradiation. By now seldom reports on the application of Nb2O5 containing heterojunction catalyst in PODS were found. Hence finding more companions to construct heterojunction catalysts and try to apply it in PODS is extremely urgent.
23 and so on. And such catalysts were mostly applied in the degradation of polluted water under visible light irradiation. By now seldom reports on the application of Nb2O5 containing heterojunction catalyst in PODS were found. Hence finding more companions to construct heterojunction catalysts and try to apply it in PODS is extremely urgent.
In recent years, Bi2WO6 attracted great attention for its excellent visible light induced photocatalytic activity, chemical and thermal stability and non-toxicity.24 Unfortunately, its application is still limited because of the high recombination rate of photogenerated holes and electrons. Many attempts to enhance photocatalytic activities by manufacturing Bi2WO6 composite have also been reported.25–27 To our excitement the band structures of Bi2WO6 and Nb2O5 interlaced,21,25 which is in favour of promoting the separation of the photogenerated carriers, as a result Bi2WO6 will be an appropriate candidate to construct the heterojunction with Nb2O5.28 To the best of our knowledge, the Nb2O5/Bi2WO6 photocatalyst has not been reported.
Herein a novel Nb2O5/Bi2WO6 heterojunction photocatalyst was prepared and applied in PODS with dibenzothiophene (DBT) as a model sulfur compound. Nb2O5/Bi2WO6 owns enhanced photocatalytic activity over both Nb2O5 and Bi2WO6 and it also has fine stability. The mechanism of its photocatalysis was proposed and proved. The synergistic effects of the photocatalytic oxidation and the extraction were also confirmed.
2. Experimental
2.1 Materials
All the chemicals were of analytical grade and they were used directly in our experiments without any further purification. Bismuth nitrate (Bi(NO3)3·5H2O), niobium pentoxide (Nb2O5), ammonium tungstate ((NH4)5H5[H2(WO4)6]·H2O) were purchased from Medicine Group Chemical Reagent Co., Ltd. Nitric acid (HNO3), methyl alcohol (CH3OH) hydrogen peroxide (H2O2), dodecane (C12H16) were purchased from Tianjin regent chemicals Co., Ltd. DBT was purchased from Aladdin Bio-Chem Technology Co., Ltd. The deionized water was used throughout.2.2 Preparation of Nb2O5/Bi2WO6 catalysts
The Nb2O5/Bi2WO6 was prepared with the solvothermal technique. In a typical synthesis procedure, 30 mL nitric acid solution of Bi(NO3)3·5H2O (the molar ratio of Bi(NO3)3·5H2O to HNO3 is 1.00![[thin space (1/6-em)]](https://www.rsc.org/images/entities/char_2009.gif) :
:![[thin space (1/6-em)]](https://www.rsc.org/images/entities/char_2009.gif) 0.17) and 20 mL solution of (NH4)5H5[H2(WO4)6]·H2O (the molar ratio of W to Bi is 1
0.17) and 20 mL solution of (NH4)5H5[H2(WO4)6]·H2O (the molar ratio of W to Bi is 1![[thin space (1/6-em)]](https://www.rsc.org/images/entities/char_2009.gif) :
:![[thin space (1/6-em)]](https://www.rsc.org/images/entities/char_2009.gif) 2 and the dissolving temperature is 60 °C) were prepared respectively. Then the later was added into the former drop by drop to form the suspension. A certain amount of Nb2O5 was added into the resulting suspension after vigorously stirring for 2 h at 40 °C. This mixture was stirred for another 0.5 h and then transferred into a Teflon-lined autoclave for solvothermal treatment at 160 °C for 12 h. Subsequently, the system was cooled to room temperature naturally; the resulting precipitate was filtrated, washed with deionized water until the solution neutral, and then dried at 80 °C for 8 h. The mass percent of Nb2O5 in Nb2O5/Bi2WO6 were controlled to be 1, 5 and 10 wt%, which were designated as x wt% Nb2O5/Bi2WO6 (x = 1, 5, 10). For comparison, the bulk Bi2WO6 was also prepared and the synthetic process followed the above technique without Nb2O5.
2 and the dissolving temperature is 60 °C) were prepared respectively. Then the later was added into the former drop by drop to form the suspension. A certain amount of Nb2O5 was added into the resulting suspension after vigorously stirring for 2 h at 40 °C. This mixture was stirred for another 0.5 h and then transferred into a Teflon-lined autoclave for solvothermal treatment at 160 °C for 12 h. Subsequently, the system was cooled to room temperature naturally; the resulting precipitate was filtrated, washed with deionized water until the solution neutral, and then dried at 80 °C for 8 h. The mass percent of Nb2O5 in Nb2O5/Bi2WO6 were controlled to be 1, 5 and 10 wt%, which were designated as x wt% Nb2O5/Bi2WO6 (x = 1, 5, 10). For comparison, the bulk Bi2WO6 was also prepared and the synthetic process followed the above technique without Nb2O5.
2.3 Characterization of catalysts
X-ray diffraction (XRD) patterns were obtained on a D/max-IIIA X-ray diffractometer (Rigaku, Japan) with Cu-Kα radiation operating at 35 kV and 30 mA. Fourier Translation Infrared Spectra (FTIR) spectra were recorded on a Nicolet 380 spectrometer (Thermo Fisher Scientific) in the range of 4000–400 cm−1. The optical diffuse reflectance spectra were recorded with UV-vis-NIR Spectrophotometer (Agilent, Cary 2450) over a range of 400–800 nm. Surface morphologies were investigated on the scanning electron microscopy (SEM) (Hitachi SU 8000) operated at an acceleration voltage of 15 kV and the elements of the sample were analyzed by corresponding XEDS energy mapping. X-ray photoelectron spectroscopy (XPS) was obtained on an ESCALAB 250 spectrometer at room temperature and Al-Kα irradiation to determine the chemical states of Bi, W, Nb, and O atoms in the prepared samples.2.4 Photocatalytic oxidative desulfurization
Model fuel with the sulfur concentration of 200 μg g−1 was prepared by dissolving DBT in the dodecane. PODS reaction was operated in a beaker with magnetic stirring at ambient temperature. Two 5 W 420 nm LED lamps were used as the visible light sources and the distance from the light sources to the beaker is about 10 cm.Typically, 20 mL model fuel was added firstly into a 100 mL beaker, and then some amount of CH3OH (calculated in the volume ratio to the model fuel of 1![[thin space (1/6-em)]](https://www.rsc.org/images/entities/char_2009.gif) :
:![[thin space (1/6-em)]](https://www.rsc.org/images/entities/char_2009.gif) 1), catalyst (calculated in the mass percent of 1 wt% in the model fuel) and H2O2 (30 wt%, calculated in O/S molar ratio of 10) were also introduced in order. The beaker was placed in the dark with constant magnetic stirring for 30 min firstly to establish adsorption–desorption equilibrium of DBT on catalysts. Then the PODS proceed under the visible light irradiation. The samples were withdrawn periodically every 20 min from the upper phase and detected by WK-2D microcoulometric detector after high speed centrifuge. The operating parameter was followed by integral resistance 400 Ω, bias voltage between 148 and 149 mV, burning furnace temperature 850 °C, evaporation section temperature 750 °C, and stable section temperature 650 °C, the oxygen flow rate 150 mL min−1 and nitrogen flow rate 260 mL min−1. In addition, the model fuel before and after PODS and methanol phase after PODS were analysed by gas chromatography-mass spectrometer (GC-MS, Agilent 7890A). The major measuring conditions were as follows: injection port temperature 250 °C; temperature program of the oven 100 °C and the detector temperature was 300 °C.
1), catalyst (calculated in the mass percent of 1 wt% in the model fuel) and H2O2 (30 wt%, calculated in O/S molar ratio of 10) were also introduced in order. The beaker was placed in the dark with constant magnetic stirring for 30 min firstly to establish adsorption–desorption equilibrium of DBT on catalysts. Then the PODS proceed under the visible light irradiation. The samples were withdrawn periodically every 20 min from the upper phase and detected by WK-2D microcoulometric detector after high speed centrifuge. The operating parameter was followed by integral resistance 400 Ω, bias voltage between 148 and 149 mV, burning furnace temperature 850 °C, evaporation section temperature 750 °C, and stable section temperature 650 °C, the oxygen flow rate 150 mL min−1 and nitrogen flow rate 260 mL min−1. In addition, the model fuel before and after PODS and methanol phase after PODS were analysed by gas chromatography-mass spectrometer (GC-MS, Agilent 7890A). The major measuring conditions were as follows: injection port temperature 250 °C; temperature program of the oven 100 °C and the detector temperature was 300 °C.
The desulfurization rate (η) of model fuel was calculated by eqn (1):
| η = (1 − C/C0) × 100% | (1) |
2.5 Stability test
Catalyst was separated from the reaction mixture by the filtration and washing with the deionized water, dried at 80 °C for 12 h and then directly used for the next run.2.6 Active species trapping experiments
In the typical PODS process the model fuel, CH3OH, 5 wt% Nb2O5/Bi2WO6 photocatalyst and H2O2 were added into the beaker in order, then 1.0 mM isopropanol (IPA), p-benzoquinone (p-BQ) and disodium ethylenediaminetetraacetate (EDTA-2Na) were also added into the beaker respectively for detecting hydroxyl radicals (˙OH), superoxide radicals (˙O2−) and holes (h+).293. Results and discussion
3.1 Characterizations
| αhν = A(hν − Eg)n/2 | (2) |
3.2 Photocatalytic oxidative desulfurization performance
−ln![[thin space (1/6-em)]](https://www.rsc.org/images/entities/char_2009.gif) C/C0 = k × t C/C0 = k × t
| (3) |
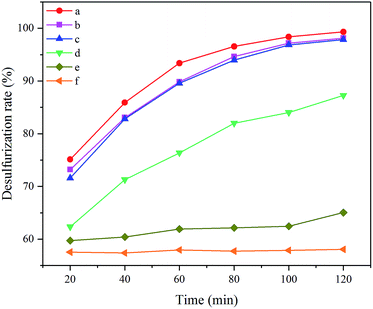
![[thin space (1/6-em)]](https://www.rsc.org/images/entities/char_2009.gif) C/C0 to the reaction time were represented in Fig. 7. Values of −ln
C/C0 to the reaction time were represented in Fig. 7. Values of −ln![[thin space (1/6-em)]](https://www.rsc.org/images/entities/char_2009.gif) C/C0 for all catalysts presented clear linear increases with the reaction time, suggesting the pseudo-first-order, which well proved the former assumption. Meanwhile, the reaction rate constants, the slopes of the straight lines, decrease in such order: 5 wt% Nb2O5/Bi2WO6 > 1 wt% Nb2O5/Bi2WO6 > 10 wt% Nb2O5/Bi2WO6 > Bi2WO6 > Nb2O5 > blank. Therefore, 5 wt% Nb2O5/Bi2WO6 was chosen as the efficient catalyst to make further researches.
C/C0 for all catalysts presented clear linear increases with the reaction time, suggesting the pseudo-first-order, which well proved the former assumption. Meanwhile, the reaction rate constants, the slopes of the straight lines, decrease in such order: 5 wt% Nb2O5/Bi2WO6 > 1 wt% Nb2O5/Bi2WO6 > 10 wt% Nb2O5/Bi2WO6 > Bi2WO6 > Nb2O5 > blank. Therefore, 5 wt% Nb2O5/Bi2WO6 was chosen as the efficient catalyst to make further researches.
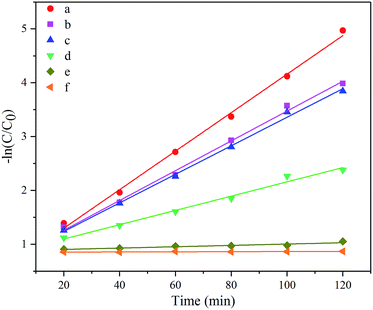 | ||
| Fig. 7 Pseudo-first-order kinetic fitting curves for different catalysts (a) 5 wt% Nb2O5/Bi2WO6; (b) 1 wt% Nb2O5/Bi2WO6; (c) 10 wt% Nb2O5/Bi2WO6; (d) Bi2WO6; (e) Nb2O5; (f) blank. | ||
3.3 Stability studies
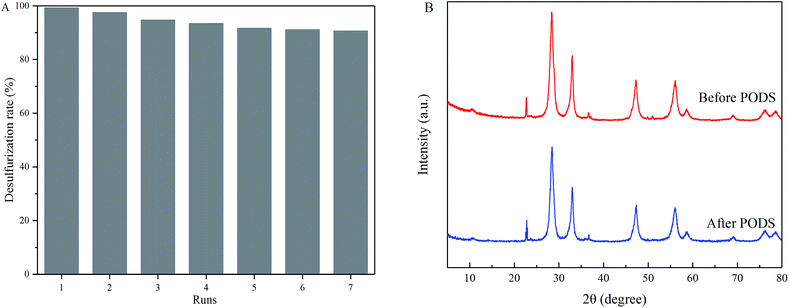
Stability of 5 wt% Nb2O5/Bi2WO6 was studied in terms of its performance in every repeated run of PODS. As shown in Fig. 8A, the desulfurization rate still remains more than 90% after seven cycles of repeated PODS. The slight decrease in its activity can be attributed to the changes of catalysts in the recycle experiment. Furthermore, the XRD patterns of the 5 wt% Nb2O5/Bi2WO6 before and after PODS were displayed in Fig. 8B. It indicated that the used 5 wt% Nb2O5/Bi2WO6 had similar crystalline phase to that of the fresh one except the diffraction peak intensity decreased slightly. In brief, the catalyst does not exhibit significant loss of activity, indicating that the catalyst has good stability for photocatalysis.3.4 Photocatalytic oxidative desulfurization mechanism
The radicals trapping experiment was conducted to well explain the photocatalytic mechanism. Active mediates including hydroxyl radicals (˙OH), superoxide radicals (˙O2−) and holes (h+) were detected by adding isopropanol (IPA), p-benzoquinone (p-BQ) and disodium ethylenediaminetetraacetate (EDTA-2Na) to the reaction system, respectively. It can be observed in Fig. 9 that the desulfurization rates corresponding to four experiments, with no radicals trapping agent or with different radicals trapping agents, follow this order: no scavenger > IPA > p-BQ > EDTA-2Na. It was implied that the ˙OH do not play a predominant role for the desulfurization. While ˙O2− and h+ are the main contributors to the sulfur removal in the catalytic system containing Nb2O5/Bi2WO6 heterojunction photocatalyst. Functions of the members in the PODS system were also investigated in Table 1, experiments were conducted with irradiation. Based on the desulfurization rates for systems with different combinations, the catalytic function of Nb2O5/Bi2WO6 is well proved. CH3OH, acting as the solvent, plays an important role in the desulfurization after the efficient conversion of the DBT to polar sulfur compounds. In this one pot process, CH3OH was added into the system simultaneously with all the other components, the formed polar sulfur compounds can be extracted in time, which is in favour of the proceeding of the reaction. In such PODS system Nb2O5/Bi2WO6, H2O2 and CH3OH have a good synergistic effect and anyone of them is absolutely necessary.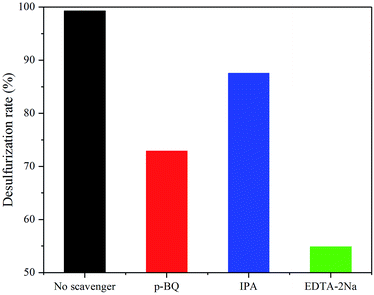 | ||
| Fig. 9 Trapping experiments of active species under visible light irradiation in the presence of 5 wt% Nb2O5/Bi2WO6. | ||
| Items | Conditions | Desulfurization rate (%) |
|---|---|---|
| 1 | H2O2 + DBT | 12.24 |
| 2 | CH3OH + DBT | 39.52 |
| 3 | H2O2 + DBT + CH3OH | 41.14 |
| 4 | H2O2 + DBT + Nb2O5/Bi2WO6 | 25.86 |
| 5 | H2O2 + DBT + Nb2O5/Bi2WO6 + CH3OH | 99.31 |
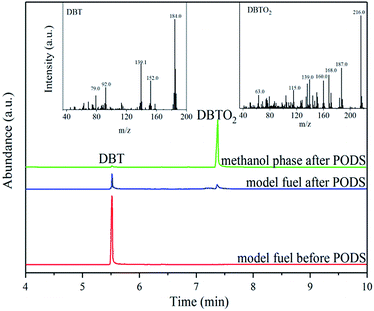
An analysis of the oxidation product is of great importance in investigating the reaction mechanism. The model fuel before and after PODS and the used methanol were analysed with GC-MS, and the results were shown in Fig. 10. Based on the MS results, dibenzothiophene sulfone (DBTO2) is undoubtedly the only oxidation product of DBT. In PODS the extraction can effectively transfer DBTO2 into the methanol phase, which is easily separated from the model fuel, thus the deep desulfurization was achieved.
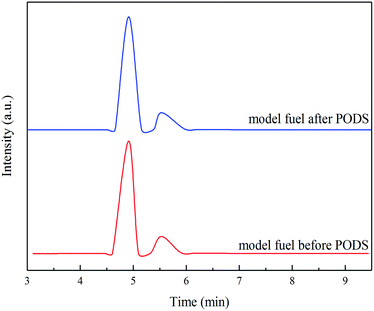
In order to check whether the photocatalytic oxidation process damaged the hydrocarbons in the model fuel except the sulfur compound, the model fuel before and after PODS were detected by GC and the results were shown in the Fig. 11. The peaks were ascribed to the dodecane and its isomer in model fuel. Compared with the model fuel before PODS, the peaks of the model fuel after PODS almost have not changes, which illustrated PODS doesn't bring side effects on the composition of the hydrocarbon. Thus, PODS present a good selectivity for the removal of DBT in the dodecane.
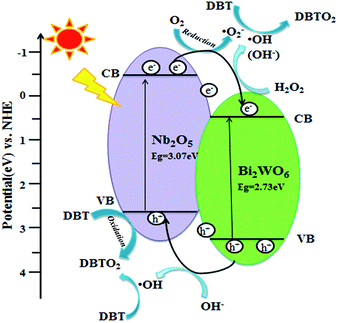
Based on the above founding and the previous reports,5,6,46,48 here we propose a possible mechanism for the PODS reaction on Nb2O5/Bi2WO6, as schematically shown in Fig. 12. For a semiconductor, the valence band (VB) and conduction band (CB) can be calculated according to the empirical equations:
| EVB = χ − Ee + 0.5Eg | (4) |
| ECB = Eg − EVB | (5) |
When the composite material is irradiated under visible light, the photogenerated electron injects to CB, while the hole is left on VB. It has been demonstrated that the CB and VB of Bi2WO6 and Nb2O5 are interlaced. Thus the hole and electron can transfer between the two phases. The photogenerated electrons on the CB of Nb2O5 efficiently transferred to CB of Bi2WO6, simultaneously the photogenerated holes effectively migrated from Bi2WO6 to Nb2O5, which suppresses the recombination process of photogenerated carries. In a reaction process, firstly, the reactant DBT adsorbed on the surface of Nb2O5/Bi2WO6 to form a surface charge transfer complex. Secondly, the photogenerated electron transferred to CB can quickly move and possess strong reducibility, such electron reacts with H2O2 and oxygen (O2) dissolving in solution to form ˙OH and ˙O2− radicals.48,49 DBT molecule was directly oxidized to the DBTO2 by ˙OH and ˙O2− radicals. In addition, the photogenerated holes possess strong oxidizability, which can capture the lone pair electrons belonging to the sulfur atom of DBT molecule to forming C12H8S˙+, and then further forming DBTO2. Finally, the corresponding sulfones were extracted with methanol to achieve the purpose of deep desulfurization.
4. Conclusions
In summary, based on the interlaced CB and VB of Bi2WO6 and Nb2O5, novel Nb2O5/Bi2WO6 heterostructured composites materials were successfully synthesized via one-pot solvothermal route. It has the good stability, and it also exhibited better visible light photocatalytic activity than pure Bi2WO6 and Nb2O5 in PODS. Its synergistic effect with CH3OH and H2O2 in the photocatalytic system accounts for the high desulfurization rates. In PODS, h+ and ˙O2− make more contribute than ˙OH to the sulfur removal in the photocatalytic system containing Nb2O5/Bi2WO6 heterojunction photocatalyst, H2O2 and CH3OH.Conflicts of interest
There are no conflicts to declare.Acknowledgements
This work was supported by Program for Liaoning Excellent Talents in University, abbreviated as ‘LNET’ (LJQ2015062), Program for Science and Technology Agency of Liaoning Province (20170540585), General Scientific Research Project of Liaoning Provincial Department of Education (L2015296, L2016018) and Science and Technology Planning project of Fushun (FSKJHT201376).Notes and references
- Y. Mathieu, L. Tzanis, M. Soulard, J. Patarin, M. Vierling and M. Molière, Fuel Process. Technol., 2013, 114, 81–100 CrossRef CAS.
- M. Masiol and R. M. Harrison, Atmos. Environ., 2014, 95, 409–455 CrossRef CAS.
- J. Han, X. Zheng, L. Zhang, H. Fu and J. Chen, Environ. Sci.: Nano, 2017, 4, 834–842 RSC.
- S. Li, S. Hu, K. Xu, W. Jiang, Y. Liu, Z. Leng and J. Liu, J. Colloid Interface Sci., 2017, 504, 561–569 CrossRef CAS PubMed.
- S. Li, S. Hu, J. Zhang, W. Jiang and J. Liu, J. Colloid Interface Sci., 2017, 497, 93–101 CrossRef CAS PubMed.
- X. Zheng and L. Zhang, Energy Environ. Sci., 2016, 9, 2511–2532 CAS.
- L. Zhang, L. O. Herrmann and J. J. Baumberg, Sci. Rep., 2015, 5, 16660 CrossRef CAS PubMed.
- X. Zeng, X. Xiao, Y. Li, J. Chen and H. Wang, Appl. Catal., B, 2017, 209, 98–109 CrossRef CAS.
- M. Zarrabi, M. H. Entezari and E. K. Goharshadi, RSC Adv., 2015, 5, 34652–34662 RSC.
- L. Yun, Z. Yang, Z. B. Yu, T. Cai and Y. Li, RSC Adv., 2017, 7, 25455–25460 RSC.
- X. Li, Z. Zhang, C. Yao, X. Lu, X. Zhao and C. Ni, Appl. Surf. Sci., 2016, 364, 589–596 CrossRef CAS.
- X. Lu, X. Li, J. Qian, N. Miao, C. Yao and Z. Chen, J. Alloys Compd., 2016, 661, 363–371 CrossRef CAS.
- W. Zhu, Y. Xu, H. Li, B. Dai, H. Xu, C. Wang, Y. Chao and H. Liu, Korean J. Chem. Eng., 2014, 31, 211–217 CrossRef CAS.
- C. Wang, W. Zhu, Y. Xu, H. Xu, M. Zhang, Y. Chao, S. Yin, H. Li and J. Wang, Ceram. Int., 2014, 40, 11627–11635 CrossRef CAS.
- S. Obregón and G. Colón, Appl. Catal., B, 2013, 140–141, 299–305 CrossRef.
- X. Li, F. Li, X. Lu, S. Zuo, C. Yao and C. Ni, J. Alloys Compd., 2017, 709, 285–292 CrossRef CAS.
- X. Chen, T. Yu, X. Fan, H. Zhang, Z. Li, J. Ye and Z. Zou, Appl. Surf. Sci., 2007, 253, 8500–8506 CrossRef CAS.
- R. Shao, Z. Cao, Y. Xiao, H. Dong and W. He, RSC Adv., 2014, 4, 26447–26451 RSC.
- S. Qi, L. Fei, R. Zuo, Y. Wang and Y. Wu, J. Mater. Chem. A, 2014, 2, 8190–8195 CAS.
- S. Furukawa, A. Tamura, T. Shishido, K. Teramura and T. Tanaka, Appl. Catal., B, 2011, 110, 216–220 CrossRef CAS.
- R. Shao, X. Zeng, Z. Cao, H. Dong, L. Wang, F. Wang, J. Liu, Z. Li and Q. Liang, RSC Adv., 2015, 5, 102101–102107 RSC.
- J. Yan, G. Wu, N. Guan and L. Li, Appl. Catal., B, 2014, 152–153, 280–288 CrossRef CAS.
- J. Xing, Z. Shan, K. Li, J. Bian, X. Lin, W. Wang and F. Huang, J. Phys. Chem. Solids, 2008, 69, 23–28 CrossRef CAS.
- C. Mao, M. Li, Z. Fang, F. Meng, X. Qu, Y. Liu, M. Wang, J. Zhang, Z. Shi and X. Guo, RSC Adv., 2013, 3, 6631–6639 RSC.
- X. Fan, X. Yue, J. Luo and C. Wang, J. Nanopart. Res., 2016, 18, 65–73 CrossRef.
- X. Liu, Q. Lu and J. Liu, J. Alloys Compd., 2016, 662, 598–606 CrossRef CAS.
- J. Li, H. Hao, J. Zhou and Z. Zhu, New J. Chem., 2016, 40, 9638–9647 RSC.
- Y. Zhang, L. Pei, Z. Zheng, Y. Yuan, T. Xie, J. Yang, S. Chen, J. Wang, E. R. Waclawik and H. Zhu, J. Mater. Chem. A, 2015, 3, 18045–18052 CAS.
- A. Xu, Y. Peng, Q. Chen, D. Wang and H. Zhou, CrystEngComm, 2015, 17, 569–576 RSC.
- F. Zhang, S. Zou, T. Wang, Y. Shi and P. Liu, Photochem. Photobiol., 2017, 1–25 Search PubMed.
- Z. Liu, Q. Yu, J. Liu, T. Li and F. Huang, Micro Nano Lett., 2017, 12, 95–100 Search PubMed.
- Y. Xu, J. Song, F. Chen, X. Wang and H. Yu, RSC Adv., 2016, 6, 65902–65910 RSC.
- J. Bao, S. Guo, J. Gao, T. Hu and L. Yang, RSC Adv., 2015, 5, 97195–97204 RSC.
- H. Huang, K. Liu, K. Chen, Y. Zhang, Y. Zhang and S. Wang, J. Phys. Chem. C, 2014, 118, 14379–14387 CAS.
- Y. Hong, C. Li, G. Zhang, Y. Meng, B. Yin, Y. Zhao and W. Shi, Chem. Eng. J., 2016, 299, 74–84 CrossRef CAS.
- R. Shao, Z. Cao, Y. Xiao, H. Dong, W. He, Y. Gao and J. Liu, RSC Adv., 2014, 4, 26447–26451 RSC.
- H. Lv, Y. Liu, J. Hu, Z. Li and Y. Lu, RSC Adv., 2014, 4, 63238–63245 RSC.
- Z. Lin, J. Li, Z. Zheng, J. Yan, P. Liu, C. Wang and G. Yang, ACS Nano, 2015, 9, 7256–7265 CrossRef CAS PubMed.
- J. Li, C. Yu, W. Fang, L. Zhu, W. Zhou and Q. Fan, Chin. J. Catal., 2015, 36, 987–993 CrossRef CAS.
- D. C. Castro, R. P. Cavalcante, J. Jorge, M. A. U. Martines, L. C. S. Oliveira, G. A. Casagrande and A. Machulek Jr, J. Braz. Chem. Soc., 2015, 27, 303–313 Search PubMed.
- W. Zhao, W. Zhao, G. Zhu, T. Lin and F. Xu, Dalton Trans., 2016, 45, 3888–3894 RSC.
- Y. Pang, G. Xu, X. Zhang, J. Lv, K. Shi, P. Zhai, Q. Xue, X. Wang and Y. Wu, Dalton Trans., 2015, 44, 17784–17794 RSC.
- W. Yang, B. Ma, W. Wang, Y. Wen and D. Zeng, Phys. Chem. Chem. Phys., 2013, 15, 19387–19394 RSC.
- E. S. Aazam, Ceram. Int., 2014, 40, 6705–6711 CrossRef CAS.
- S. Li, X. Shen, J. Liu and L. Zhang, Environ. Sci.: Nano, 2017, 4, 1155–1167 RSC.
- S. Li, S. Hu, W. Jiang, Y. Liu and J. Liu, J. Colloid Interface Sci., 2017, 501, 156–163 CrossRef CAS PubMed.
- W. Zhu, G. Zhu, H. Li, Y. Chao and Y. Chang, J. Mol. Catal. A: Chem., 2011, 347, 8–14 CrossRef CAS.
- B. Sun, Y. Xue, L. Wang, L. Feng and C. Li, J. Fuel Chem. Technol., 2016, 44, 1074–1081 CrossRef CAS.
- W. Zhu, C. Wang, H. Li, P. Wu and S. Xun, Green Chem., 2015, 17, 2464–2472 RSC.
| This journal is © The Royal Society of Chemistry 2017 |

