 Open Access Article
Creative Commons Attribution 3.0 Unported Licence
Temperature and rhodamine B sensing based on fluorescence intensity ratio of Er3+ upconversion emissions†
Jin L. Wua,
Bao S. Cao *ab,
Luis Rino
 b,
Yang Y. Hea,
Zhi Q. Fenga and
Bin Dong*a
aKey Laboratory of Photosensitive Material and Device of Liaoning Province, Key Laboratory of New Energy and Rare Earth Resource Utilization of State Ethnic Affairs Commission, School of Physics and Materials Engineering, Dalian Minzu University, Dalian 116600, P. R. China. E-mail: bscao@dlnu.edu.cn; dong@dlnu.edu.cn
bDepartment of Physics & I3N, University of Aveiro, Campus Universitário de Santiago, Aveiro 3810-193, Portugal
First published on 16th October 2017
Abstract
In this paper, we report the temperature and rhodamine B (RhB)-concentration sensing behavior of Ag/ZnO/Er3+:YbMoO4 composite films based on the fluorescence intensity ratio (FIR) of two green upconversion (UC) emissions which are ascribed to the 2H11/2/4S3/2 → 4I15/2 transitions of Er3+. Through the strong and non-overlapping green UC emissions, the FIR of the two green emissions is closely related to temperature in the range of 300–650 K, which shows a high sensing accuracy and the maximum sensitivity of 0.01574 K−1. Due to the wavelength-dependent absorption of dye molecules, the FIR of the two green UC emissions exhibits an excellent exponential relationship with the RhB concentration in the range of 0–1000 ppm, which is ascribed to the radiative energy transfer (RET) from the composite film to RhB molecules. It is anticipated that the FIR technique based on the UC luminescence of rare-earth ions is a potential method for multifunctional application both in thermometers and biosensors.
Introduction
Over the past few decades, rare-earth (RE) ion-doped luminescence materials have drawn increasing attention for the efficient lighting, visualization, optical communication and health applications because of their various outstanding features, such as sharp emissions, large Stokes shifts and long luminescence lifetime.1–4 RE ion-doped upconversion (UC) materials, where higher energy photons can be emitted after absorbing lower energy photons through multi-photon processes, have been getting more and more interest due to their wide applications in biomedicine, photocatalysis, solar cells, sensing, etc.5–8 Among these applications, UC luminescence-based sensors, such as optical temperature sensors and biosensors, have attracted growing attention because they are non-contact and non-invasive, capable of fast response, high accurate and spatial resolution characteristics, and suitable to be applied in the biological and medical fields due to the large penetration depth into tissues, less photodamage and photobleaching, and low background noise.9,10In general, UC luminescence-based optical temperature sensors are based on the variation of the UC emission intensity of RE ions with increasing temperature due to the temperature-dependent nonradiative rate at a particular energy level of interest.11,12 Also, the UC luminescence-based biosensors are usually based on the variation of the emission intensity of chromophores resulting from the concentration-dependent energy transfer (ET) from RE ions to target molecules.5,13 However, the fluorescence emission depends on many factors including the host material, the energy level of interest, the dimension of the material doped with RE ion, the excitation condition, etc. The above-mentioned temperature-dependent nonradiative rate and concentration-dependent energy transfer would often be incorrectly interpreted and susceptible to errors due to changes in those factors. One way of avoiding these obstacles is to use the fluorescence intensity ratio (FIR) method, which consists of measuring the intensity of fluorescence from two different emissions that have different temperature dependence or concentration dependence, whose ratio provides a measurand that is essentially independent of other disturbance factors, such as the reduction of the variability induced by the measuring conditions, and helps to improve the sensitivity, accuracy and resolution.11
The FIR measurement technique has already been successfully used in optical temperature sensors based on the ratio of fluorescence intensity originating from two closely spaced energy levels with separations of the order of the thermal energy, which is independent of fluorescence loss and fluctuations in the excitation intensity.11,14,15 Although a variety of RE ions and host materials are adopted for temperature sensing based on the FIR technique, two factors that mainly affect the FIR-based optical temperature sensing behavior are the overlap of the two fluorescence wavelengths from the coupled levels, and the sufficient fluorescence intensity from two coupled energy levels.14 Currently, biological detection using RE-doped UC materials as a biosensor mainly based on the fluorescence of chromophores activated by the ET process from RE ions resulting from the spectral overlap between RE ions (donor) and chromophores (acceptor).5,13,16,17 It is established that ET can be realized by either fluorescence resonance energy transfer (FRET) or radiative energy transfer (RET). FRET is a nonradiative dipole–dipole coupling process with an efficiency inversely proportional to the sixth power of the distance between donor and acceptor.18 FRET is extremely sensitive to small changes in the distance of the donor and acceptor, which are usually separated by a few nanometers.19 Thus, relatively complex methods must be used to combine the RE-doped UC materials with other chromophores. These methods are usually carried out in a solution which is usually unstable, which makes them irreproducible, with poor processability and low UC efficiency.13,20–22 Compared with FRET, RET is a process where the emission from the donor is reabsorbed by the acceptor. The propagation of radiation from donor to acceptor can be remote, which permits the development of solid state UC biosensor with a high UC efficiency, an easy and stable operation, and an excellent recyclability and tailorability. However, the low efficiency of the RET process usually leads to weak fluorescence of chromophores, which results in lower concentration detection sensitivity and a larger error.
The Ag/ZnO/Er3+:YbMoO4 composite film under infrared excitation produces strong and non-overlapping green UC emissions of Er3+ ions. Based on such performance, the temperature sensing behavior of the composite film based on the FIR of two green UC emissions was greatly improved in this work. For instance, the highest temperature sensitivity of 0.01574 K−1 achieved in the temperature range of 300–650 K is better than that of other reported Er3+ based UC sensing materials and most of the other RE based sensing materials. In addition, different from the biodetection methods based on the fluorescence of chromophores,5,13,16 the rhodamine B (RhB) dye concentration sensing behavior of the composite film was investigated based on the FIR of the two green UC emissions of the Er3+ ions. A good exponential relationship was found between the FIR and RhB concentration in the large concentration range of 0–1000 ppm, indicating the excellent biosensing behavior based on the FIR technique of the RE UC emissions.
Experimental
The Ag/ZnO/Er3+:YbMoO4 composite film, consisting of three sublayers of Ag, ZnO nanowires and Er3+-doped YbMoO4, was prepared as reported elsewhere.23 First, Ag sublayer with a thickness of 28 nm was deposited on a glass substrate by direct-current magnetron sputtering. Second, radio-frequency magnetron sputtering was used to deposit ZnO seeds on the Ag sublayer and the hydrothermal method was utilized to grow a sublayer of ZnO nanowires (900 nm in length), based on the ZnO seeds. Third, an Er3+-doped YbMoO4 (molar ratio of Er![[thin space (1/6-em)]](https://www.rsc.org/images/entities/char_2009.gif) :
:![[thin space (1/6-em)]](https://www.rsc.org/images/entities/char_2009.gif) Yb = 1
Yb = 1![[thin space (1/6-em)]](https://www.rsc.org/images/entities/char_2009.gif) :
:![[thin space (1/6-em)]](https://www.rsc.org/images/entities/char_2009.gif) 10) sublayer with a thickness of 500 nm was spin-coated on the ZnO nanowires with a stoichiometric solution of Er(NO3)3·5H2O, Yb(NO3)3·5H2O and (NH4)6Mo7O24·4H2O. Finally, the whole composite film was annealed at the temperature of 773 K for 2 h in a normal atmosphere.
10) sublayer with a thickness of 500 nm was spin-coated on the ZnO nanowires with a stoichiometric solution of Er(NO3)3·5H2O, Yb(NO3)3·5H2O and (NH4)6Mo7O24·4H2O. Finally, the whole composite film was annealed at the temperature of 773 K for 2 h in a normal atmosphere.
The luminescence emission spectra of the composite film were detected by a Jobin Yvon iHR550 monochromator coupled to a CR131 photomultiplier tube under a 980 nm laser diode (LD) excitation. The spectral resolution of the experimental set-up was 0.1 nm. For the temperature-dependent luminescence measurement, a temperature controlling system was used to adjust the temperature from room temperature to 673 K, where the measuring and controlling accuracy were about ±0.5 K. For the dye concentration-dependent luminescence measurement, the aqueous solution with a certain RhB concentration was adopted and the measurement was conducted at room temperature.
Results and discussion
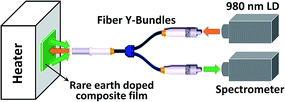
Y-Type fiber optic reflection/backscatter probe bundles were used to introduce the 980 nm excitation light and simultaneously collect the temperature-dependent UC emissions, and a schematic diagram of the luminescence measurement is presented in Fig. 1. The advantages of this measuring system are that the flexible fiber makes the measurement process easier to operate in practical application, the composite film can be easily integrated into the fiber head, and the measuring light path is very simple.The UC emission spectra of the Ag/ZnO/Er3+:YbMoO4 composite film at different temperatures recorded by using the above measuring system are shown in Fig. 2. Intense green and faint red UC emissions are observed from the 2H11/2/4S3/2 → 4I15/2 and 4F9/2 → 4I15/2 transitions of Er3+ in the wavelength range of 500–700 nm for all temperatures, separately. The two green emission bands originating from the 2H11/2/4S3/2 → 4I15/2 transitions show nearly no overlap, which boosts the accuracy of the measurement of the integral intensity. In addition, the variation of temperature does not change the position of the UC emission peaks, whereas the emission intensity clearly changes. The inset in Fig. 2 shows the integral intensity of UC emissions as a function of temperature. The intensity of the green UC emissions of the 2H11/2 → 4I15/2 transition (IH) and 4S3/2 → 4I15/2 transition (IS) undergo complex changes with temperature, whereas the red UC emission intensity of the 4F9/2 → 4I15/2 transition (IRed) is nearly independent of temperature.
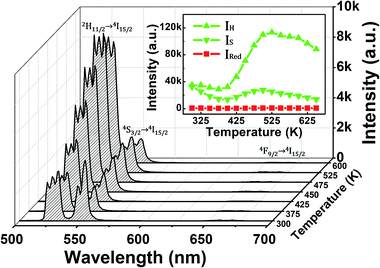 | ||
| Fig. 2 UC emission spectra of the Ag/ZnO/Er3+:YbMoO4 composite film at different temperatures. The inset shows the green and red emissions intensity versus the temperature. | ||
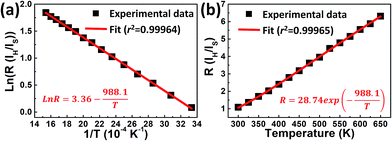
It is well-known that the coupled energy levels of 2H11/2 and 4S3/2 are thermalized, whose population follows the Boltzmann's distribution. The FIR of the two green UC emissions from 2H11/2 → 4I15/2 and 4S3/2 → 4I15/2 transitions can be expressed as:11
 | (1) |
The temperature sensitivity is an important characteristic for evaluating the performance of a thermometer. The relative sensitivity Sr, which allows the comparison between the sensitivities obtained from different thermally coupled energy levels, can be expressed as:11
 | (2) |
| Materials | Transitions | ΔE (cm−1) | Sr (K−1) | C | Smax (10−4 K−1) | Tmax (K) | Ref. |
|---|---|---|---|---|---|---|---|
| Ag/ZnO/Er3+:YbMoO4 composite film | Er3+: 2H11/2, 4S3/2 → 4I15/2 | 687 | 988.1/T2 | 28.74 | 157.4 | 494 | This work |
| Er3+/Yb3+:CaWO4 | Er3+: 2H11/2, 4S3/2 → 4I15/2 | 745 | 1072/T2 | 13.87 | 72.1 | 535 | 24 |
| Er3+/Yb3+/Li+:NaYF4 | Er3+: 2H11/2, 4S3/2 → 4I15/2 | 804 | 1198.2/T2 | 18.54 | 59.2 | 453 | 25 |
| Er3+:KYb2F7 | Er3+: 2H11/2, 4S3/2 → 4I15/2 | 844 | 1224/T2 | 10.29 | 45.4 | 590 | 26 |
| Er3+:Yb2Ti2O7 | Er3+: 2H11/2, 4S3/2 → 4I15/2 | 473 | 679.2/T2 | 9.3 | 74 | 340 | 27 |
| Er3+:PLZT ceramics | Er3+: 2H11/2, 4S3/2 → 4I15/2 | 773 | 1108.3/T2 | 3.88 | 18.9 | 554 | 28 |
| Er3+:PKAZLF glass | Er3+: 2H11/2, 4S3/2 → 4I15/2 | 850 | 1218.6/T2 | 21.5 | 79 | 630 | 29 |
| Er3+/Yb3+:Y2O3 | Er3+: 2H11/2, 4S3/2 → 4I15/2 | 827 | 1185.5/T2 | 19.89 | 91 | 593 | 30 |
| Er3+/Yb3+:SrWO4 | Er3+: 2H11/2, 4S3/2 → 4I15/2 | 602 | 866.1/T2 | 21.12 | 149.8 | 403 | 31 |
| Er3+:BaMoO4 | Er3+: 2H11/2, 4S3/2 → 4I15/2 | 655 | 939/T2 | — | 227 | 463 | 32 |
| Nd3+:P–K–Ba–Al glass | Nd3+: 4F5/2, 4F3/2 → 4I9/2 | 908 | 1301.8/T2 | 5.36 | 22.2 | 651 | 33 |
| Eu3+:(Y0.75Gd0.25)2O3 | Eu3+: 5D1, 5D0 → 7F1 | 1633 | 2350/T2 | 24.84 | 49 | 823 | 34 |
| Dy3+:Y4Al2O9 | Dy3+: 4I5/2, 4F9/2 → 6H15/2 | 1347 | 1937.6/T2 | 11.0 | 30 | 873 | 35 |
| Ho3+/Yb3+:CaWO4 | Ho3+: 5F2,3/3K8, 5G6/5F1 → 5I8 | 1304 | 1890/T2 | 16.67 | 50 | 923 | 36 |
| Tm3+/Yb3+:Y2O3 | Tm3+: 1D2 → 3F4, 3H4 → 3H6 | 394 | 564.9/T2 | 82.76 | 780 | 270 | 37 |
However, the absolute sensitivity Sa is a more important parameter for the practical application of optical thermal sensing, and is given by:11
 | (3) |
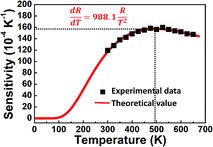
The absolute sensitivity Sa as a function of temperature for the composite film based sensor is depicted in Fig. 4. In the temperature range of our measurement, Sa initially increases and then decreases with elevated temperature, with the maximum value of about 0.01574 K−1 at 494 K. From our previous study,38 the maximum absolute sensitivity Smax is expressed by:
 | (4) |
 | (5) |
A schematic diagram of the luminescence measurement of the RhB concentration-dependent UC emission is presented in Fig. 5. The Ag/ZnO/Er3+:YbMoO4 composite film was attached to the outer wall of a cuvette containing the aqueous solution with different RhB concentration. The composite film was excited by the 980 nm LD and the corresponding luminescent signal was collected at the other side of the cuvette. The advantage of this measuring system is that the amount of RhB solution can be precisely controlled for the measurement of different RhB concentration, and the measuring system can be easily, stably and repeatedly reused in the practical application.
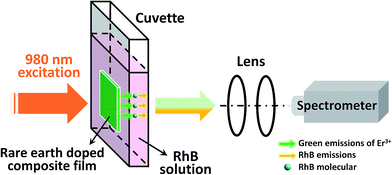 | ||
| Fig. 5 Schematic diagram of the luminescence measurement of the RhB concentration-dependent UC emissions. | ||
Under the above measuring system, the Ag/ZnO/Er3+:YbMoO4 composite film still exhibits strong green UC emissions and weak red UC emissions, and the UC emission spectrum for the RhB concentration of CRhB = 0 (pure water) is shown in Fig. 6. The normalized RhB relative absorption and emission spectra are also presented for comparison.39 The RhB absorption band has a large degree of overlap with the green UC emission band of the composite film, which suggests that ET may be taking place between the composite film (as the donor) and the RhB molecules (as the acceptor).
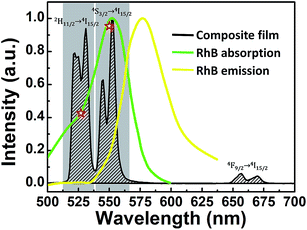 | ||
| Fig. 6 UC emission spectrum of the Ag/ZnO/Er3+:YbMoO4 composite film (black line) under the measurement condition in Fig. 5. The normalized RhB absorption (green line) and emission (yellow line) spectra are presented for comparison. The asterisks calculated by eqn (6) denote the relative RhB absorption coefficients of the two green UC emissions for the 2H11/2/4S3/2 → 4I15/2 transitions. | ||
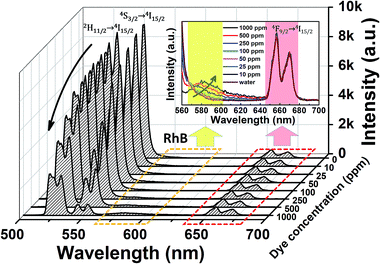
The UC emission spectra of the composite film at different CRhB is shown in Fig. 7. The spectra reveal that with increasing CRhB, the intensity of the green UC emissions gradually decreases and the FIR of two green UC emissions also varies likewise, while a new emission band from RhB appears in the wavelength range of 560–640 nm. The inset of Fig. 7 reveals that the intensity of the RhB emissions increases with RhB concentration, and the RhB emission peak gradually redshifts with increasing CRhB, which could be explained by the reabsorption effect of RhB.40 The red UC emission intensity from the composite film remains almost unchanged with the variation of the RhB concentration, indicating that the red UC emission has no interaction with the RhB dye. Note that the RhB emission at low concentration (<100 ppm) is difficult to observe because of the relatively low intensity.
To clearly detect the influence of the RhB concentration on the fluorescence emission, the integrated intensity of the green UC emissions and RhB emissions as a function of the RhB concentration is given in Fig. 8. The monotonical decrease of the green UC emissions and increase of RhB emissions can be detected. Due to the identical measuring condition, the decrease of the green UC emissions is uniquely caused by the increased absorption resulting from the increasing RhB concentration. Meanwhile, the intensity change of the RhB emissions can be ascribed to the ET process between the composite film and RhB molecules because of no absorption of RhB in the wavelength around 980 nm.
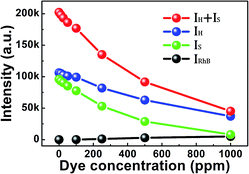 | ||
| Fig. 8 Integral intensity of the green UC emissions and RhB emissions as a function of the RhB concentration. | ||
As mentioned above, FRET only occurs in a nanoscale spacing between the donor and the acceptor, thus, due to the large gap in the cuvette wall between the composite film and the RhB solution, only RET process exists in this work. A plausible schematic diagram is presented in Fig. 9 to illustrate the emission and ET process. Under the 980 nm LD excitation, the well-known processes of absorption and subsequent ETs are ascribed to the green and red UC emissions of the composite film. Then, part of the green UC emissions from the 2H11/2/4S3/2 → 4I15/2 transitions could be reabsorbed by the RhB dye molecules through the RET process, exciting the RhB molecules from the highest occupied molecular orbital (HOMO) to the lowest unoccupied molecular orbital (LUMO). Next, the radiative transition of RhB molecules from LUMO to HOMO produces the RhB emissions as shown in Fig. 7.
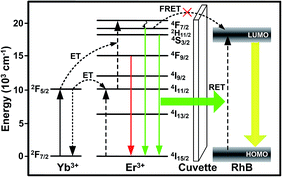 | ||
| Fig. 9 Schematic diagram of a plausible mechanism for the emission and ET processes in the measuring system. | ||
As the decrease of the green UC emission intensity is caused only by the reabsorption of RhB molecules, the relationship between the green UC emissions and RhB concentration satisfies the Beer–Lambert law,
Iλ(C) = Iλ(0) × 10−KλlC = Iλ(0)![[thin space (1/6-em)]](https://www.rsc.org/images/entities/char_2009.gif) exp(−2.303KλlC) exp(−2.303KλlC)
| (6) |
 | (7) |
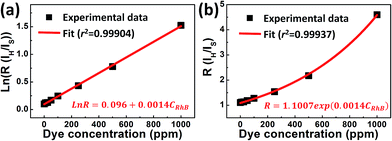
![[thin space (1/6-em)]](https://www.rsc.org/images/entities/char_2009.gif) R is linearly relative to CRhB, and the corresponding plot of FIR as a function of CRhB is displayed in Fig. 10. Within the concentration range from 0 to 1000 ppm, there is a good linear relationship between ln
R is linearly relative to CRhB, and the corresponding plot of FIR as a function of CRhB is displayed in Fig. 10. Within the concentration range from 0 to 1000 ppm, there is a good linear relationship between ln![[thin space (1/6-em)]](https://www.rsc.org/images/entities/char_2009.gif) R and CRhB with an intercept of 0.096 ± 0.006 and a slope of 0.0014 ± 0.000017. The large determination coefficients (r2) in Fig. 10a and b indicate that the FIR technique based on the two green UC emissions from the composite film is suitable for the detection of the RhB concentration.
R and CRhB with an intercept of 0.096 ± 0.006 and a slope of 0.0014 ± 0.000017. The large determination coefficients (r2) in Fig. 10a and b indicate that the FIR technique based on the two green UC emissions from the composite film is suitable for the detection of the RhB concentration.
Eqn (7) also indicates that the FIR is relative to the difference of absorption coefficient for the two green UC emissions (ΔKS−H) and the initial intensity ratio of the two green UC emissions (IH0/IS0). Since the two green UC emissions of Er3+ have different absorption coefficients (the asterisks shown in Fig. 6), the FIR of the two green UC emissions is an efficient measurand that is essentially independent of the fluorescence loss or fluctuations in excitation intensity. Another advantage of using RE UC emissions for RhB sensing is that the UC emissions by infrared excitation are very suitable for biodetection. In addition, there are plenty of monochromatic RE UC emissions which can be used for the FIR technique. For instance, the green UC emissions of the composite film can be divided into five different monochromatic Stark UC emissions (Figs. S1 and S2†), where the FIR of two of them can be suitably used for RhB concentration sensing, as shown in Fig. S3(e–j).†
Like the relative sensitivity of temperature sensing in eqn (2), the relative sensitivity Sr of the RhB concentration sensing can be given by:
 | (8) |
![[thin space (1/6-em)]](https://www.rsc.org/images/entities/char_2009.gif) R–CRhB plot (Fig. 10a), which is strongly relative to ΔK, and large ΔK helps to improve the relative sensitivity Sr. The relative absorption coefficients of the two green UC emissions for the 2H11/2/4S3/2 → 4I15/2 transitions (the asterisks calculated by eqn (6) which are very consistent with the absorption spectrum of RhB, as shown in Fig. 6) have a large difference of about 55%, which is suitable for the FIR technique. It is also found that the two Stark UC emissions with a ΔK larger than 37% (Fig. S3(i)†) can be used for the FIR technique with high accuracy (Fig. S3(e–j)†), while the small ΔK of the two Stark UC emissions will cause a large error, which deviates from the linear relationship (Fig. S3(a–d)†).
R–CRhB plot (Fig. 10a), which is strongly relative to ΔK, and large ΔK helps to improve the relative sensitivity Sr. The relative absorption coefficients of the two green UC emissions for the 2H11/2/4S3/2 → 4I15/2 transitions (the asterisks calculated by eqn (6) which are very consistent with the absorption spectrum of RhB, as shown in Fig. 6) have a large difference of about 55%, which is suitable for the FIR technique. It is also found that the two Stark UC emissions with a ΔK larger than 37% (Fig. S3(i)†) can be used for the FIR technique with high accuracy (Fig. S3(e–j)†), while the small ΔK of the two Stark UC emissions will cause a large error, which deviates from the linear relationship (Fig. S3(a–d)†).
Note that the RhB emissions at the wavelength range of 560–620 nm are also relative to the RhB concentration (Fig. 7). Accordingly, we also study the relationship between the RhB emission intensity (IRhB) and CRhB. It is found that IRhB is exponentially related to the CRhB but has a very large fitting error (Fig. S4†). Due to the low RhB fluorescence efficiency (only about 2.82% calculated from Fig. S4†), the RhB fluorescence emissions was very weak and even undetectable at lower concentration (Fig. 7 and S2†), indicating that it is unsuitable for RhB sensing based on the RhB emissions in this work. Thus, compared with the RhB sensing based on the RhB emissions, the FIR technique based on the two green UC emissions of Er3+ is proved to be an effective and excellent approach for RhB sensing with high detection accuracy. Moreover, the FIR technique is simpler than other methods, such as the lifetime measurement, because of the easy fluorescence detection and the low cost of measurement. Compared with conventional absorption measurements, the use of FIR technique would be beneficial in microfluidic devices where short optical paths prevent the use of the conventional attenuated transmission technique for optical measurements.
Conclusions
In summary, both the temperature and RhB-concentration sensing properties of the Ag/ZnO/Er3+:YbMoO4 composite film were investigated using the FIR technique. The FIR of the two green UC emissions of Er3+ was studied as a function of temperature. The maximum sensitivity was approximately 0.01574 K−1, which is higher than that of other Er3+-based sensing materials and most of the other RE ions-based sensing materials. The FIR of the two green UC emissions of Er3+ was also found to be exponentially dependent on the RhB concentration with high measurement accuracy. It is suggested that the FIR technique is an effective method in the multifunctional temperature and dye concentration sensors.Conflicts of interest
There are no conflicts to declare.Acknowledgements
This work was supported by the National Natural Science Foundation of China (Grant No. 11474046), the Program for Liaoning Excellent Talents in University, the Fundamental Research Funds for the Central Universities (Grant Nos. DC201502080202 and DC201502080406), and the China Scholarship Council.Notes and references
- H. Yu, D. Kim, J. Lee, S. Baek, J. Lee, R. Singh and F. So, Nat. Photonics, 2016, 10, 129–134 CrossRef CAS.
- S. L. Gai, C. X. Li, P. P. Yang and J. Lin, Chem. Rev., 2014, 114, 2343–2389 CrossRef CAS PubMed.
- H. Lin, G. Meredith, S. B. Jiang, X. Peng, T. Luo, N. Peyghambarian and E. Y. B. Pun, J. Appl. Phys., 2003, 93, 186–191 CrossRef CAS.
- F. Auzel, Chem. Rev., 2004, 104, 139–173 CrossRef CAS PubMed.
- S. Xu, S. H. Xu, Y. S. Zhu, W. Xu, P. W. Zhou, C. Y. Zhou, B. Dong and H. W. Song, Nanoscale, 2014, 6, 12573–12579 RSC.
- Y. N. Tang, W. H. Di, X. S. Zhai, R. Y. Yang and W. P. Qin, ACS Catal., 2013, 3, 405–412 CrossRef CAS.
- J. Wang, Y. Niu, M. Hojamberdiev, F. M. Alamgir, Y. Cai and K. Jacob, Sol. Energy Mater. Sol. Cells, 2017, 160, 361–371 CrossRef CAS.
- B. Dong, B. S. Cao, Y. Y. He, Z. Liu, Z. P. Li and Z. Q. Feng, Adv. Mater., 2012, 24, 1987–1993 CrossRef CAS PubMed.
- F. Wang and X. G. Liu, Chem. Soc. Rev., 2009, 38, 976–989 RSC.
- J. Zhou, Z. Liu and F. Y. Li, Chem. Soc. Rev., 2012, 41, 1323–1349 RSC.
- S. A. Wade, S. F. Collins and G. W. Baxter, J. Appl. Phys., 2003, 94, 4743–4756 CrossRef CAS.
- S. W. Allison and G. T. Gillies, Rev. Sci. Instrum., 1997, 68, 2615–2650 CrossRef CAS.
- S. Xu, W. Xu, Y. F. Wang, S. Zhang, Y. S. Zhu, L. Tao, L. Xia, P. W. Zhou and H. W. Song, Nanoscale, 2014, 6, 5859–5870 RSC.
- X. F. Wang, Q. Liu, Y. Y. Bu, C. S. Liu, T. Liu and X. H. Yan, RSC Adv., 2015, 5, 86219–86236 RSC.
- M. D. Dramicanin, Methods Appl. Fluoresc., 2016, 4, 042001 CrossRef PubMed.
- K. C. Liu, Z. Y. Zhang, C. X. Shan, Z. Q. Feng, J. S. Li, C. L. Song, Y. N. Bao, X. H. Qi and B. Dong, Light: Sci. Appl., 2016, 5, e16136 CrossRef CAS.
- R. Chen, V. D. Ta, F. Xiao, Q. Y. Zhang and H. D. Sun, Small, 2013, 9, 1052–1057 CrossRef CAS PubMed.
- H. Edelhoch, L. Brand and M. Wilchek, Biochemistry, 1967, 6, 547–559 CrossRef CAS PubMed.
- R. Gill, M. Zayats and I. Willner, Angew. Chem., Int. Ed., 2008, 47, 7602–7625 CrossRef CAS PubMed.
- J. L. Liu, Y. Liu, Q. Liu, C. Y. Li, L. N. Sun and F. Y. Li, J. Am. Chem. Soc., 2011, 133, 15276–15279 CrossRef CAS PubMed.
- D. T. Tu, L. Q. Liu, Q. Ju, Y. S. Liu, H. M. Zhu, R. F. Li and X. Y. Chen, Angew. Chem., Int. Ed., 2011, 50, 6306–6310 CrossRef CAS PubMed.
- K. Kuningas, T. Rantanen, T. Ukonaho, T. Lovgren and T. Soukka, Anal. Chem., 2005, 77, 7348–7355 CrossRef CAS PubMed.
- J. L. Wu, B. S. Cao, L. Rino, Y. R. Fang, L. Hu, Z. Y. Zhang, Y. Z. Huang and B. Dong, Nanoscale, 2017 Search PubMed , submitted.
- S. Sinha, M. K. Mahata, K. Kumar, S. P. Tiwari and V. K. Rai, Spectrochim. Acta, Part A, 2017, 173, 369–375 CrossRef CAS PubMed.
- A. Dubey, A. K. Soni, A. Kumari, R. Dey and V. K. Rai, J. Alloys Compd., 2017, 693, 194–200 CrossRef CAS.
- J. K. Cao, F. F. Hu, L. P. Chen, H. Guo, C. K. Duan and M. Yin, J. Alloys Compd., 2017, 693, 326–331 CrossRef CAS.
- B. S. Cao, Y. Y. He, Z. Q. Feng, Y. S. Li and B. Dong, Sens. Actuators, B, 2011, 159, 8–11 CrossRef CAS.
- A. S. S. de Camargo, J. F. Possatto, L. A. d. O. Nunes, É. R. Botero, É. R. M. Andreeta, D. Garcia and J. A. Eiras, Solid State Commun., 2006, 137, 1–5 CrossRef CAS.
- N. Vijaya, P. Babu, V. Venkatramu, C. K. Jayasankar, S. F. León-Luis, U. R. Rodríguez-Mendoza, I. R. Martín and V. Lavín, Sens. Actuators, B, 2013, 186, 156–164 CrossRef CAS.
- V. Lojpur, G. Nikolić and M. D. Dramićanin, J. Appl. Phys., 2014, 115, 203106 CrossRef.
- A. Pandey, V. K. Rai, V. Kumar, V. Kumar and H. C. Swart, Sens. Actuators, B, 2015, 209, 352–358 CrossRef CAS.
- A. K. Soni, A. Kumari and V. K. Rai, Sens. Actuators, B, 2015, 216, 64–71 CrossRef CAS.
- C. Perez-Rodriguez, L. L. Martin, S. F. Leon-Luis, I. R. Martin, K. K. Kumar and C. K. Jayasankar, Sens. Actuators, B, 2014, 195, 324–331 CrossRef CAS.
- M. G. Nikolic, V. Lojpur, Z. Antic and M. D. Dramicanin, Phys. Scr., 2013, 87, 055703 CrossRef.
- Z. Boruc, M. Kaczkan, B. Fetlinski, S. Turczynski and M. Malinowski, Opt. Lett., 2012, 37, 5214–5216 CrossRef CAS PubMed.
- W. Xu, H. Zhao, Y. X. Li, L. J. Zheng, Z. G. Zhang and W. W. Cao, Sens. Actuators, B, 2013, 188, 1096–1100 CrossRef CAS.
- V. Lojpur, M. Nikolic, L. Mancic, O. Milosevic and M. D. Dramicanin, Ceram. Int., 2013, 39, 1129–1134 CrossRef CAS.
- B. S. Cao, J. L. Wu, X. H. Wang, Y. Y. He, Z. Q. Feng, B. Dong and L. Rino, AIP Adv., 2015, 5, 087136 CrossRef.
- J. A. Sutton, B. T. Fisher and J. W. Fleming, Exp. Fluids, 2008, 45, 869–881 CrossRef CAS.
- T. C. He, R. Chen, W. W. Lin, F. Huang and H. D. Sun, Appl. Phys. Lett., 2011, 99, 081902 CrossRef.
Footnote |
| † Electronic supplementary information (ESI) available. See DOI: 10.1039/c7ra09977k |
| This journal is © The Royal Society of Chemistry 2017 |

