 Open Access Article
Creative Commons Attribution 3.0 Unported Licence
Molecular dynamic simulation of nanocrystal formation and tensile deformation of TiAl alloy
Peng-tao Lia,
Yan-Qing Yang *a,
Zhenhai Xiab,
Xian Luoa,
Na Jina,
Yong Gaoa and
Gang Liua
aState Key Laboratory of Solidification Processing, Northwestern Polytechnical University, 710072, Xi'an, Shaanxi, China. E-mail: yangyanqing05@163.com; lipengtao_1985@163.com
bDepartment of Materials Science and Engineering, University of North Texas, Denton, Texas 76203, USA. E-mail: Zhenhai.xia@unt.edu
First published on 16th October 2017
Abstract
The formation of nanocrystals from undercooling TiAl melt and deformation behavior of nanocrystalline TiAl alloy under tensile loading conditions are investigated by molecular dynamics simulation. The effects of quenching rate related to the solidification structure evolution during rapid quenching are described by internal energy, radial distribution functions, and common neighbor analysis. The simulation results indicate that the accumulation of atoms with icosahedral configuration and transformation into atomic cluster with BCC configuration in the undercooling melt are the key in crystalline nucleation growth, and eventually liquid TiAl alloy completely crystallizes at the quenching rate of 0.02 K ps−1. In the tensile deformation, grain boundaries sliding and lamellar domain increasing are the two main deformation mechanisms during plastic deformation, and cracks form due to the nucleation, growth and coalescence of void along the grain boundaries, which results in subsequent failure in nanocrystalline TiAl alloy. This paper provides fundamental understanding of the nanocrystalline formation of undercooling TiAl melt and the deformation mechanisms in the nanocrystalline TiAl at the atomic scale.
Introduction
Nanocrystalline (NC) materials, as a class of promising structural materials, have attracted considerable interest owing to their superior mechanical and functional properties.1,2 In comparison to the conventional coarse-grained materials, NC materials exhibit higher strength and hardness, and superior soft and hard magnetic properties.3–6 The superior properties of the NC materials, especially mechanical properties like higher strength and hardness, is mainly attributed to the substantial number of grain boundaries resulted from extremely small grain size according to the Hall–Petch theory.7,8 Compared with traditional microcrystalline materials, the fraction of atoms located at grain boundaries (GBs) increases significantly in the NC materials, which play a crucial role in dislocation formations and movements. In spite of a large amount of work on the NC materials, the detailed deformation mechanisms underlying the observed behaviors are still open due to the challenge in observing the atomic structures directly.9–11In recent decades, Ti–Al alloys have been widely used in automotive and aerospace industries due to their high strength retention, high creep resistance and high specific strength and stiffness at high temperatures.12–14 To further improve the properties of Ti–Al alloy materials, a new method called grain nanocrystallization has been developed. Shimono et al. was the first to study the glass and crystallization solidification of Ti–Al alloys under rapid quenching rates by molecular dynamics (MD) simulation.15 Following this work, several investigations for Ti–Al alloy have been carried out through MD simulation. Pei and his co-authors simulated the solidification processes of Ti3Al alloy with different cooling rates.16,17 Recently, Xie and his partners further investigated the nanocrystal formation and deformation behavior of Ti3Al alloy.18 Li et al. studied the crystallization process of TiAl liquid alloy with different cooling rates.19 Compared with Ti3Al alloy, TiAl alloy has relatively high nanocrystal formation ability.17–19 However, there is lack of work on the TiAl nanocrystal formation process from TiAl liquid. On the other hand, the existing simulations were limited to the formation of nanocrystal structures using a system consisting of 10–30 thousand atoms but the minimum requirement of atoms number for solidification system to simulate aluminum crystal nucleation is no less than 500 thousand.20,21 Therefore, a precise microstructural evaluation of liquid TiAl alloy during rapid quenching and its particular deformation mechanisms at nanocrystal state have not been well established due to the limitation of atoms number. A large system containing 734 thousand atoms is developed in our work, and the nanocrystal formation and tensile deformation processes of TiAl alloy are investigated using the large-scale model at nanometer scale.
Simulation and conditions
The simulation of solidification process is realized by the open code LAMMPS with NPT ensemble at 0 Pa.22 The velocity-Verlet algorithm is used for integrating the Newton's equations of motion, and the Maxwell–Boltzmann distribution is used for the initial velocities of the atoms. The time step Δt is 1 fs (1 fs = 10−15 s). The interaction between atoms is described by Zope and Mishin's embedded-atom-method (EAM) potential.23 Pei et al. simulated the rapid solidification of Ti3Al by using the potential. The effect of different cooling rates on atomistic evolution of liquid alloy is obtained.16 Wang and his co-authors used the potential to investigate the transformations of dipoles of dissociated edge dislocation in γ-TiAl at temperatures ranging from 0 K to near the melting points.24 Thus, this potential has been widely used for MD calculation, and can accurately reproduce the behaviors of TiAl systems.16,24–26 Original configuration of the simulation is a block (45 nm × 6 nm × 45 nm) containing 734![[thin space (1/6-em)]](https://www.rsc.org/images/entities/char_2009.gif) 000 atoms (367
000 atoms (367![[thin space (1/6-em)]](https://www.rsc.org/images/entities/char_2009.gif) 000 Ti atoms and 367
000 Ti atoms and 367![[thin space (1/6-em)]](https://www.rsc.org/images/entities/char_2009.gif) 000 Al atoms denoted by blue balls and red ones, respectively) with periodic boundary conditions in all directions, as shown in Fig. 1. To get an equilibrium liquid state, the atomic system is run at 2300 K, which is much higher than the melting point of TiAl (around 1753 K),27 for 3000 ps. Then, the equilibrium liquid state at 2300 K is set as the starting state during cooling process. The cooling rates are varied in the range of 0.5–0.005 K ps−1 (1 ps = 10−12 s).
000 Al atoms denoted by blue balls and red ones, respectively) with periodic boundary conditions in all directions, as shown in Fig. 1. To get an equilibrium liquid state, the atomic system is run at 2300 K, which is much higher than the melting point of TiAl (around 1753 K),27 for 3000 ps. Then, the equilibrium liquid state at 2300 K is set as the starting state during cooling process. The cooling rates are varied in the range of 0.5–0.005 K ps−1 (1 ps = 10−12 s).
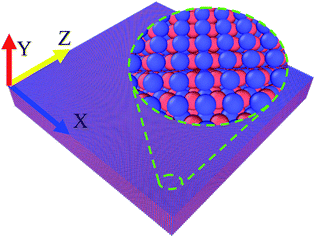 | ||
| Fig. 1 The simulation cell for perfect TiAl crystal at 0 K. Ti atoms and Al atoms are denoted by blue and red balls, respectively. | ||
Before the deformation process, the NC TiAl alloy obtained at the quenching rate of 0.02 K ps−1, 0.01 K ps−1 and 0.005 K ps−1 were subjected to energy minimization using the conjugate gradient method. The system was then relaxed in the Nose/Hoover isobaric-isothermal ensemble (NPT) under a pressure of 0 Pa and a temperature of 300 K for 1000 ps. Subsequently, the NC TiAl alloy obtained at a quenching rate of 0.02 K ps−1 was deformed in tension by straining the simulation box at different strain rates (8 × 10⁸ s−1, 8 × 10⁷ s−1 and 8 × 10⁶ s−1, respectively) along the z axis with canonical (NVT) ensemble.
Microstructure evolution is essential to study both the nanocrystal formation mechanism and deformation behavior of TiAl alloy. In this paper, internal energy and radial distribution function (RDF) are applied to indicate the formation of nanocrystal.28 Common neighbor analysis (CNA) technique is adopted to reveal the microstructural evolution in rapid quenching processes.29–31 In the original CNA method proposed by Honeycutt and his co-authors, structures are represented by different diagrams.29 For a pair of atoms, α and β, the diagrams are classified by a set of four indexes: (i), (ii), (iii) and (iv). The values 1 or 2 for the first index (i) shows that α and β are the nearest neighbors (i = 1) or not (i = 2), the second index (ii) indicates the number of the nearest neighbors shared by the (α, β) pair (common neighbors), the third index is the number of bonds among the common neighbors, and the last index represents the differentiates diagrams with the same (i), (ii) and (iii) indexes and different boding among common neighbors. Tsuzuki et al. described the 1421 diagram for FCC structure, 1422 diagram for HCP structure, and 1441 and 1661 diagrams for bcc structure, respectively,31 and they also give a table to distinguish the CNA diagrams for crystal structure. To further observe the local atomic-level structures in TiAl undercooling melt, the Voronoi tessellation method is employed.32,33 Voronoi polyhedral shows the three-dimensional space atomic configuration between the centered and the surrounding atoms. Voronoi index <n3, n4, n5, n6> is used for designate and differentiate the type of the Voronoi polyhedron surrounding a centered solute atom, where ni represents the number of i-edged faces of the Voronoi polyhedron.33 For example, an index <0, 0, 12, 0> indicates that the polyhedron has only 12 pentagonal faces, which is the characteristic of a 13-atom icosahedra cluster. In addition, the structure change and atomic potential energy in the system are visualized by the Open Visualization Tool (OVITO).34,35
Results and discussion
Quenching structures and properties of TiAl alloy
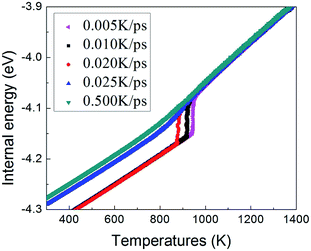
To understand the structural evolution during rapid quenching process, several microstructural characterization methods are adopted in this section. Fig. 2 illustrates the internal energy as a function of temperature during the cooling process at five different quenching rates, 0.500 K ps−1, 0.025 K ps−1, 0.020 K ps−1, 0.010 K ps−1 and 0.005 K ps−1, respectively. According to the feature, the curves can be classified into two types. When the cooling rate is not less than 0.025 K ps−1, internal energies persistently decrease with the drop of temperature, showing the characteristics of liquid-to-glass phase transformation. When the cooling rate is less than 0.025 K ps−1, there is a remarkable drop of internal energy, which indicates that the crystallization occurs. The glass transition temperature strongly depends on the quenching rate. As the temperature decreases, the inter energy-temperature curve for quenching rate of 0.5 K ps−1 shows a slight slope change at about 780 ± 30 K, where the glass transition occurs. When the quenching rate is down to 0.025 K ps−1, the glass transition temperature (Tg) increases to 850 ± 30 K. However, when the quenching rates drop less than 0.025 K ps−1, the Tg with one turning point transforms into freezing temperature (Tf) with two turning points, and the slope of the internal energy curve drops sharply over a narrow temperature range between the two turning points. As shown in Fig. 2, with the decreasing quenching rate, the final atomic configuration at 300 K transforms from amorphous solid to crystalline structure, and the critical quenching rate is 0.025 K ps−1. In previous studies, thermodynamic transitions can be classified as being first- or second-order one, accordingly. The system internal energy curves undergoing an abrupt volume drop shows the first-order transition with transfer of heat. On the other hand, the system internal energy curves undergo a gradual volume decrease, and there is no transfer of heat in the second-order transition. Although the process of glass transition is similar with the second-order phase transition, it is not a real thermodynamic phase transition because the transition temperature is not fixed but rather rely on the experimental conditions.36In order to verify the system microstructure at 300 K under different quenching rates, total radial distribution functions are applied to detect the characteristics of glass and crystal structures of TiAl alloy. It is defined as
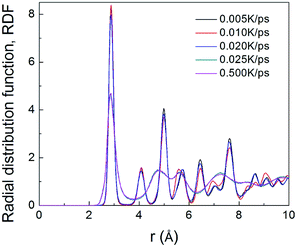 | ||
| Fig. 3 The total RDFs of Ti–Al at 300 K with five quenching rates, 0.500 K ps−1, 0.025 K ps−1, 0.020 K ps−1, 0.010 K ps−1 and 0.005 K ps−1, respectively. | ||
The atomic structures at 300 K with a variable quenching rate ranging from 0.025 K ps−1 to 0.005 K ps−1 are shown in Fig. 4. At high cooling rates ≥0.025 K ps−1, the atoms do not have enough time to rearrange themselves for crystallizing. So the liquid state maintains right up to the room temperature and then solidifies as metallic glass, as shown in Fig. 4(a). At the quenching rate of 0.020 K ps−1, the system has three grains with the average grain size being about 15 nm, as shown in Fig. 4(b). At the relatively slow cooling rates (0.010 K ps−1 and 0.005 K ps−1), Fig. 4(c) and (d) has one grain in each, and their grain size are 26 nm and 21 nm, respectively. It is indicated that with the quenching rate decreases, the number of grains decreases. The reason is that with the quenching rate decreases, grains have enough time to grow before they begin to touch neighboring grains, and a larger grain size can be obtained.
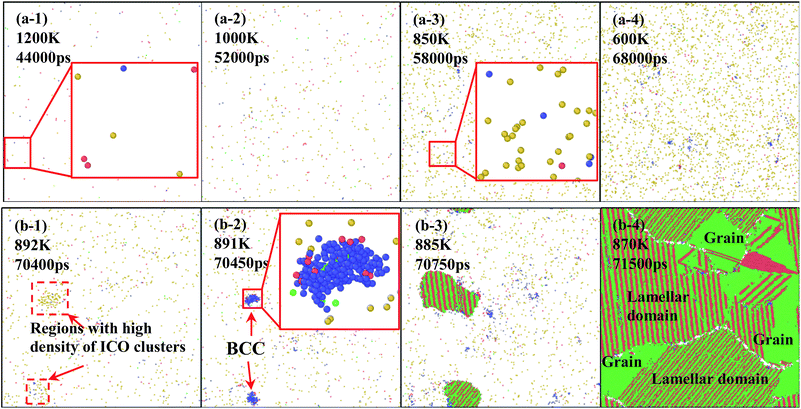
In order to understand the microstructure evolution during the formation of amorphous and crystal structures, quenching of specimens are conducted at rates of 0.025 K ps−1 and 0.02 K ps−1 for two types of solidification. Fig. 5(a) and (b) show snapshots of atomic configurations during the solidifications at 0.025 K ps−1 and 0.020 K ps−1, respectively. In the case of 0.025 K ps−1, the density of atoms with icosahedral (ICO) configuration increases with the decrease of system temperature, as shown in Fig. 5(a-1–4), which means that ICO clusters play an important role in the rapid quenching. This is because ICO configuration has the lowest energy and energy requirement in disorder structure enable it to be the largest population at rapid quenching rate.39
For the case of 0.020 K ps−1, the solidification process differs greatly, as shown in Fig. 5(b-1–4). In the first step, the number of atoms with ICO configuration increases with the decrease of temperature. As the density of ICO clusters fluctuate in the metal melt, as shown in Fig. 5(b-1), two new BCC nucleuses are formed in the regions with high density of icosahedral clusters at 891 K, as shown in the enlarged images in Fig. 5(b-2). Thus, the first nucleus is formed via transition from ICO to BCC. After the BCC nucleation, several atoms with HCP configuration are formed on the nuclei surface with BCC structures. In other words, the second structure is transformed from BCC to HCP, as shown in the amplified image in 891 K. With temperature continuously decrease from 891 K to 880 K, FCC and HCP layer keep growing alternatively to form the lamellar structures. Finally, three grains are formed in the simulation space. During this growing process, there must be a structure transition among BCC, HCP and FCC. Therefore, it is necessary to understand the actual structure transition in the solidification process from statistics.
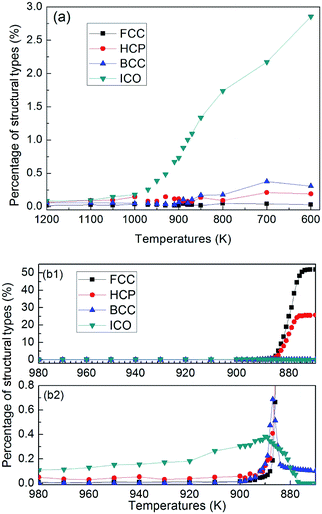
Fig. 6 shows temperature evolution of the number of atoms with BCC, ICO, HCP, FCC and the other (liquid, amorphous, grain boundary and so on) configurations during the quenching process, respectively. At a quenching rate of 0.025 K ps−1, as shown in Fig. 6(a), the number of atoms with ICO configuration slightly increases with the decrease of the temperature from 1100 K to 1000 K. When the temperature is lower than 1000 K, the number of atoms with ICO configuration linearly increases while those of FCC, BCC and HCP configurations slightly increase. At the temperature of 600 K, the total fraction of regular icosahedra is 3%, indicating that the density of regular icosahedra quite small part. To identify the other structures in TiAl undercooling alloy at 300 K, Voronoi analysis based on coordination numbers of the clusters is adopted. Fig. 7(a) displays the fraction of the 12 most populous types of the Voronoi polyhedral types at quenching rate of 0.025 K ps−1. The most favored clusters are <0, 1, 10, 2>, followed by <0, 2, 8, 4>, <0, 0, 12, 0> and <0, 3, 6, 4>, and snapshots are shown in Fig. 8. The regular ICO cluster <0, 0, 12, 0> is not the most abundant index, it is within the top 4. The studies for Voronoi polyhedral in metallic glasses show that indexes <0, 1, 10, 2> and <0, 2, 8, 4> represent distorted ICO cluster,32,40,41 and index <0, 3, 6, 4> can be considered as a distorted structure for <0, 1, 10, 2>.42 These results reveal that the dominant structures in the TiAl undercooling alloy are distorted ICO clusters, and the population of the regular ICO cluster <0, 0, 12, 0> is larger than the other six type cluster. However, if all the atoms belonging to the regular and distorted ICO cluster are exclude, it can be acquired that the Voronoi distributions of the glass systems show a resemblance to that of the corresponding liquid systems. Thus, it is suggested that the finally glass structure is a heterogeneous mixture of an interpenetrating ICO cluster network and a liquid-like matrix. These results are verified by the structure evolution processes proposed in Fig. 4(a), and are similar to the previous studies.19,43 Fig. 7(b) shows the fractions of the twelve most abundant Voronoi polyhedral types at quenching rate of 0.500 K ps−1, it can be inferred that the regular and distorted ICO clusters are still the predominant Voronoi polyhedron. However, the fractions for <0, 1, 10, 2>, <0, 0, 12, 0>, <0, 3, 6, 4> and total of the twelve Voronoi polyhedral types decrease. According to the theory of metallic glasses formation,32 liquid atoms didn't have enough time to form medium range order structures at high quenching rate, so disorder structures are preserved in metal glasses. Thus, the higher quenching rate, the more disorder structures, and the lower fractions of regular and distorted ICO clusters in amorphous TiAl alloy.
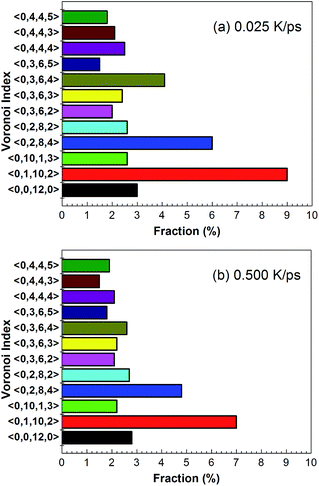 | ||
| Fig. 7 Fractions of the twelve most abundant Voronoi polyhedral types in amorphous alloy at quenching rate of (a) 0.025 K ps−1 and (b) 0.500 K ps−1 at 300 K, respectively. | ||
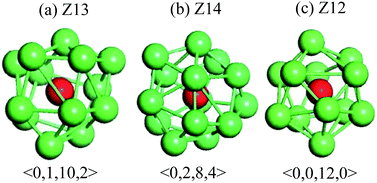 | ||
| Fig. 8 Representative snapshots of predominant Voronoi polyhedron in TiAl amorphous alloy. The red balls are central atoms. | ||
At a quenching rate of 0.020 K ps−1, as shown in Fig. 6(b), more than 99% atoms are unidentified (i.e., liquid) at 980 K, and part of the other atoms are defined as ICO configuration in the undercooled melt. In addition, the ratio of atoms with ICO configuration in the undercooled melt is higher than that of BCC, FCC and HCP configurations. With the decrease of temperature, the number of atoms with ICO configuration slight increases until 890 K. This prediction agrees with the computational44,45 and experimental45,46 results, which indicate that ICO configuration is the main component of structures in the undercooled melts. When the temperature deceases from 900 K to 890 K, the number of atoms with BCC configuration increases more rapidly than that with other configurations. Hence, the transitional BCC phase grows rapidly. Before the number of atoms with BCC configuration reaches the peak, that with HCP configuration quickly increases, followed by the rapid increase in the number of atoms with FCC configuration. When temperature decreases to 870 K, the numbers of atoms with FCC and HCP configurations increases rapidly, while that with BCC configuration sharply decreases to a low value. Therefore, the solidification of the alloy begins with the nucleation of transitional BCC phase.
These simulation results show that when quenching rate is lower than 0.025 K ps−1, nano-crystal structures can be formed by rapid quenching from TiAl alloy, and the nucleation and growth of the ICO in the liquid metal depends on the metastable BCC phase. According to the theory proposed by Totomanow and Stranski,47 the first formed phase in liquid should be the phase with the lowest free-energy barrier rather than the most stable phase. Therefore, the free-energy barrier of formation of BCC configuration should be lower than that for FCC structure. MD simulation results48,49 on the pure metal system demonstrate that the solid–liquid interfacial free-energy for FCC is higher than that for BCC by 30–35%. Hence, the first nuclei with BCC structure is the energy optimal configuration, even though FCC structure is more stable.
Next, in the transformation from metastable BCC phase to final solid phase, atoms with HCP configuration appear firstly, followed by the formation of FCC configuration. Thus, the difference in free-energy between HCP and FCC should be very small, which is consistent with Bruce and Pronk's simulation works.50,51 Experimental study52 shows that random HCP planes and FCC crystal are nucleated under microgravity conditions, which supports the theoretical calculations that the free-energy barrier of formation for HCP configuration is slightly lower than that of FCC. So with the decrease of temperature, when the disintegration of metastable BCC phase begins, according to the rule47 of lowest free-energy barrier of formation, the HCP configuration should nucleate first and then transfers into FCC crystal. Tian and his partners studied the competition between FCC and HCP.49 Their result showed that the higher the quenching rate is, the higher the percentage of HCP is. For a quenching rate of 0.020 K ps−1, which is very close to the glass formation quenching rate of 0.025 K ps−1, the final solid structures with mixture of HCP and FCC are expected from energy point of view.
Deformation behavior of the NC TiAl alloy
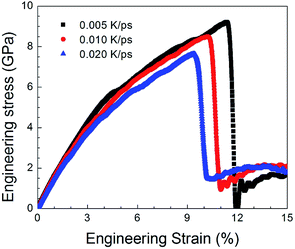
Fig. 9 shows the stress–strain curves for the NC TiAl alloys at strain rates of 8 × 10⁸ s−1 with different quenching rates, and the microstructures are showed in Fig. 4(b–d). The three stress–strain curves show an initially steady increase in stress with strain before plastic deformation process, until the stress reaches critical strength and then suddenly drops. The appearances of the curves indicate that the slower the quenching rate is, the higher value of critical the strength is. It can be concluded that the deformation evolution in NC TiAl alloy samples are depend on the quenching rate. From the viewpoint of dislocation theory,53 the failure mechanism of crystalline metal structure are mainly attributed to the dislocation generation and grain boundary sliding. During the deformation process at nanoscale, dislocations nucleate and move along the grain boundaries first, and then the grain boundary sliding begins. Next, the tensile stress suddenly drops due to the growth and coalescence of the defect structure on the grain boundaries. The structure acquired at the lowest quenching rate has the minimum length of grain boundary, because it has the longest time for grain growth during solidification process, as shown in Fig. 4(d). Therefore, during the tensile test, the minimum length of grain boundary means the dislocation has more space to move, and the possible of failure structure happens on grain boundary will reduce. Thus, the structure acquired at the lowest quenching rate has the maximum value of critical strength. To clear observe deformation and failure processes for NC TiAl alloy samples, structure acquired at quenching rate of 0.020 K ps−1 is selected as sample, and tensile test with different strain rates.To understand the mechanism underlying the deformation behavior in nanocrystal TiAl alloy, microstructural characterization method is applied to reveal the deformation evolutions of the TiAl alloy in the tensile test. Fig. 10 shows the stress–strain curves for the quenched TiAl alloy in deformation test with different strain rates of 8 × 10⁸ s−1, 8 × 10⁷ s−1 and 8 × 10⁶ s−1. The curves for the three different strain rates are similar to each other, and all of them show an initially steady increase in stress with strain before plastic deformation. There are three stages during the tensile deformation along z axis, including elastic deformation, plastic deformation and failure process. As the stress is linearly increased with strain before 2.1% (Stage I), the elastic deformation of NC TiAl alloy occur before 2.1%. The yield stress of the NC TiAl alloy is approximate 2.94 GPa, as shown in Fig. 10. After the yield point, non-linear relation of stress–strain curves are observed (Stage II in Fig. 10). When tensile strain exceeds 9.2%, the NC TiAl reaches the critical strength, and then the stress shows a sharp decrease (A typical failure in Stage III in Fig. 10). The ultimate tensile strength of the NC TiAl is determined to be around 7.90 GPa. Since the three stress–strain are very similar, the strain rate has little effect on deformation mechanism. This behavior is similar with previous work on the effect of strain rate on stress–strain relation in nanocrystalline Ni,54 and the slight difference in strength can be attributed to larger grain size in NC TiAl alloy and lamellar structures in the grains. The lamellar domain formed during solidification not only can enhance the strength of the grains, but also can effectively prevent dislocation motion during tensile test. The higher the strain is, the stronger work hardening for the grain is. On the other hand, the larger grain size means the smaller fraction of atoms located at grain boundary, and the position with the weakest cohesive force on grain boundaries is certain. Thus, the failure behaviors for NC TiAl alloy under different tensile rate are the consistent. For better understanding of the deformation mechanism and subsequent failure, the strain rate of 8 × 10⁶ s−1 is selected as a typical sample, to analyze the microstructure evolution during the tensile test.
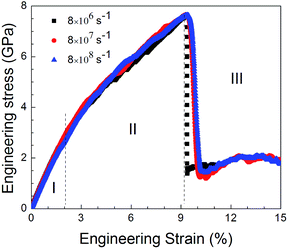 | ||
| Fig. 10 Engineering stress–strain curves with different strain rates of 8 × 10⁸ s−1, 8 × 10⁷ s−1 and 8 × 10⁶ s−1, respectively, during the tensile deformation process. | ||
The examination of typical structures occurring during deformation can effectively reveal the microstructural evolutions under tensile test. Fig. 11 exhibits the evolution of typical structures in NC TiAl alloy during the tensile test. Under the elastic deformation, the percentage of atoms with FCC structure decreases slightly with increasing tensile strain, but the numbers of atoms with HCP configuration decrease slightly. After the tensile strain exceeds 2.1%, the proportion of atoms with FCC structure decreases significantly during the plastic deformation, while that with HCP configuration as the stacking faults notably increase. This phenomenon might be the result of dislocation motion through the grains during the tensile deformation.55 After the strain reach the ultimate tensile strength point, NC TiAl alloy experiences a complex microstructure evolution.
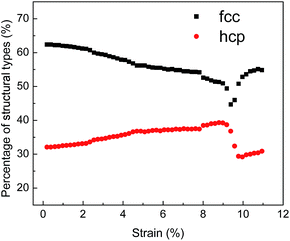 | ||
| Fig. 11 Evolution of microstructures in the NC TiAl alloy during the deformation when strain rate at 8 × 10⁶ s−1. | ||
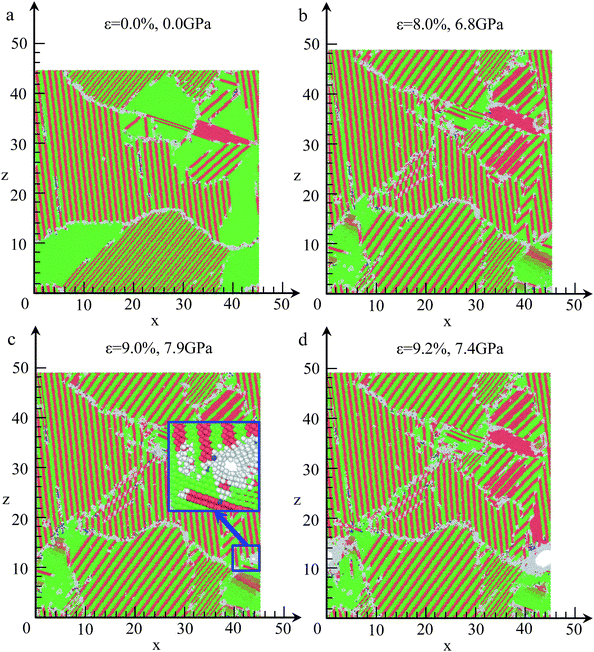
For understanding the crack initiation and corresponding microstructure evolution, the structures are coloured by CNA, as shown in Fig. 12. During the tensile deformation, the place of lamellar domain exhibits a rapid increase when the strain increases from 0.0% to 8.0%, as shown in Fig. 12(a) and (b), whereas the total area of FCC structure is sharply decreased. In addition, the grain boundary sliding is also observed. Thus, grain boundary sliding and lamellar domain increasing are the two main deformation mechanisms before failure in NC TiAl alloy. For the strain at 9.0%, the microstructures in different grains remain unchanged compared with the structure in Fig. 12(b). However, a single void is nucleated at a grain boundary between two grains, as shown in the inset of Fig. 12(c). On the other hand, no obvious dislocation activity is observed in the grains surrounding the void. Therefore, void nucleation in NC TiAl cannot be attributed to the dislocation pile-up process but rather the results from the sliding at the near grain boundaries. The sliding of the grain-boundary atoms makes shear stresses increase remarkably, which leads to the separation of the system at the corresponding grain boundaries. With the increase of strain, the void grows along the grain boundary as shown in Fig. 12(d), and the shape of the void is observed to be nonspherical. Furthermore, the void grows through the weakest points in the material, and the nucleation of the void is accommodated by the shearing of nearby atoms, leading to the formation of an amorphous shell of atoms around the void. The amorphous shell formed around the void during the tensile test is similar to previous study on crack propagation in TiNi56 and Al57 observed in experimental observation. The results presented in this simulation extend the application of Gurson-type to NC TiAl alloy.58
The nucleation, growth and coalescence of void results in the relaxation of stresses as indicated by a rapid falling in the stresses in different loading rates, as shown in Fig. 10. The relaxation of stress is accompanied by strain microstructure recovery. This process also explains why the number of atoms with FCC configuration increases while the number of atoms with HCP configuration decreases when strain is larger than the ultimate tensile strength point, as shown in Fig. 11.
The tensile deformations in NC TiAl alloy can be divided into three steps. First, the elastic deformation mechanism plays a key role when strain is less than 2.1%. Next, grain boundary sliding and lamellar domain increasing are the two main deformation mechanisms in plastic deformation until strain of 9.0%. Last, void is nucleated along the grain boundary, with the further increase of strain, growth and coalescence of void to form a crack surface result in subsequent failure.
Conclusions
In summary, molecular dynamics simulations have been carried out to investigate the microstructural evolutions of NC formation of liquid TiAl alloy and tensile deformation processes of the NC TiAl alloy. During the rapid solidification, the NC TiAl alloy is formed at slow quenching rate (no higher than 0.02 K ps−1). During NC formation, the first solid phase formed in the undercooling melt is the atomic cluster with BCC configuration, which plays a role in relaxation regime during transformation from ICO configuration to initial crystal nucleus. Once the metastable BCC phase is formed, subsequently, HCP configuration appears, followed by the atoms cluster with FCC configuration. The solidified structure consists of three grains that have random crystallographic orientations and with high-angle grain boundaries.In the tensile deformation of NC TiAl alloy, grain boundary sliding and lamellar domain increasing are the two main deformation mechanisms at the strain below 9.0%. With further increasing strain, voids nucleated and grow along the grain boundaries, and the coalescence of voids by forming a crack results in subsequent failure. This work extends Gurson-type to NC TiAl alloy.
Conflicts of interest
There are no conflicts to declare.Acknowledgements
Thanks are given to the financial supports of the Natural Science Foundation of China (51601148), the Aviation Science Foundation of China (2016ZE53064), the 111 Project of China (B08040), the Fundamental Research Funds for the Central Universities (3102014JCQ01023) and the Research Fund of the State Key Laboratory of Solidification Processing, China (115-QP-2014).References
- C. C. Koch, Nanostructured Materials: Processing, Properties and Applications, William Andrew Publishing, 2nd edn, 2006 Search PubMed.
- K. S. Kumar, H. Van Swygenhoven and S. Suresh, Acta Mater., 2003, 51, 5743–5774 CrossRef CAS.
- A. Inoue, Prog. Mater. Sci., 1998, 43, 365–520 CrossRef CAS.
- K. Lu, Mater. Sci. Eng., R, 1996, 16, 161–221 CrossRef.
- R. W. Siegel and G. E. Fougere, in Nanophase Materials: Synthesis—Properties—Applications, ed. G. C. Hadjipanayis and R. W. Siegel, Springer, Netherlands, Dordrecht, 1994, pp. 233–261, DOI:10.1007/978-94-011-1076-1_30.
- H. Y. Tong, J. T. Wang, B. Z. Ding, H. G. Jiang and K. Lu, J. Non-Cryst. Solids, 1992, 150, 444–447 CrossRef CAS.
- H. Y. Song, Y. L. Li and M. R. An, Comput. Mater. Sci., 2014, 84, 40–44 CrossRef CAS.
- E. O. Hall, Proc. Phys. Soc. B, 1951, 64, 747 CrossRef.
- Z. Hou, Z. Tian, Y. Mo and R. Liu, Comput. Mater. Sci., 2014, 92, 199–205 CrossRef CAS.
- Z. Jiang, J. Lian and B. Baudelet, Acta Metall. Mater., 1995, 43, 3349–3360 CrossRef CAS.
- L. H. Friedman and D. C. Chrzan, Phys. Rev. Lett., 1998, 81, 2715–2718 CrossRef CAS.
- T. Noda, Intermetallics, 1998, 6, 709–713 CrossRef CAS.
- X. Wu, Intermetallics, 2006, 14, 1114–1122 CrossRef CAS.
- X. Wu, D. Hu and M. H. Loretto, J. Mater. Sci., 2004, 39, 3935–3940 CrossRef CAS.
- M. Shimono and H. Onodera, Mater. Trans., JIM, 1998, 39, 147–153 CrossRef CAS.
- Q. X. Pei, C. Lu and M. W. Fu, J. Phys.: Condens. Matter, 2004, 16, 4203–4210 CrossRef CAS.
- Q. X. Pei, C. Lu and H. P. Lee, J. Phys.: Condens. Matter, 2005, 17, 1493–1504 CrossRef CAS.
- Z.-C. Xie, T.-H. Gao, X.-T. Guo and Q. Xie, Comput. Mater. Sci., 2015, 98, 245–251 CrossRef CAS.
- P.-t. Li, Y.-Q. Yang, W. Zhang, X. Luo, N. Jin and G. Liu, RSC Adv., 2016, 6, 54763–54767 RSC.
- R. S. Aga, J. R. Morris, J. J. Hoyt and M. Mendelev, Phys. Rev. Lett., 2006, 96, 245701 CrossRef PubMed.
- Y. Shibuta, S. Sakane, T. Takaki and M. Ohno, Acta Mater., 2016, 105, 328–337 CrossRef CAS.
- S. Plimpton, J. Comput. Phys., 1995, 117, 1–19 CrossRef CAS.
- R. R. Zope and Y. Mishin, Phys. Rev. B: Condens. Matter Mater. Phys., 2003, 68, 024102 CrossRef.
- H. Wang, D. S. Xu, R. Yang and P. Veyssière, Acta Mater., 2009, 57, 3725–3737 CrossRef CAS.
- D. Xu, H. Wang, R. Yang and P. Veyssière, Acta Mater., 2008, 56, 1065–1074 CrossRef CAS.
- E. V. Levchenko, A. V. Evteev, T. Lorscheider, I. V. Belova and G. E. Murch, Comput. Mater. Sci., 2013, 79, 316–325 CrossRef CAS.
- F. Appel, U. Brossmann, U. Christoph, S. Eggert, P. Janschek, U. Lorenz, J. Müllauer, M. Oehring and J. D. H. Paul, Adv. Eng. Mater., 2000, 2, 699–720 CrossRef.
- Y. Waseda, The structure of non-crystalline materials: liquids and amorphous solids, McGraw-Hill, New York, 1980 Search PubMed.
- J. D. Honeycutt, J. Phys. Chem., 1987, 91, 4950–4963 CrossRef CAS.
- D. Faken and H. Jónsson, Comput. Mater. Sci., 1994, 2, 279–286 CrossRef CAS.
- H. Tsuzuki, P. S. Branicio and J. P. Rino, Comput. Phys. Commun., 2007, 177, 518–523 CrossRef CAS.
- Y. Q. Cheng and E. Ma, Prog. Mater. Sci., 2011, 56, 379–473 CrossRef CAS.
- H. W. Sheng, W. K. Luo, F. M. Alamgir, J. M. Bai and E. Ma, Nature, 2006, 439, 419–425 CrossRef CAS PubMed.
- A. Stukowski, V. V. Bulatov and A. Arsenlis, Modell. Simul. Mater. Sci. Eng., 2012, 20, 085007 CrossRef.
- A. Stukowski, Modell. Simul. Mater. Sci. Eng., 2010, 18, 015012 CrossRef.
- G. Kumar, P. Neibecker, Y. H. Liu and J. Schroers, Nat. Commun., 2013, 4, 1536 CrossRef PubMed.
- R. S. Liu, D. W. Qi and S. Wang, Phys. Rev. B: Condens. Matter Mater. Phys., 1992, 45, 451–453 CrossRef CAS.
- Y.-C. Liang, R.-S. Liu, Y.-F. Mo, H.-R. Liu, Z.-A. Tian, Q.-y. Zhou, H.-T. Zhang, L.-L. Zhou, Z.-Y. Hou and P. Peng, J. Alloys Compd., 2014, 597, 269–274 CrossRef CAS.
- D. W. Qi and S. Wang, Phys. Rev. B: Condens. Matter Mater. Phys., 1991, 44, 884–887 CrossRef.
- A. Hirata, L. J. Kang, T. Fujita, B. Klumov, K. Matsue, M. Kotani, A. R. Yavari and M. W. Chen, Science, 2013, 341, 376 CrossRef CAS PubMed.
- S. Trady, M. Mazroui, A. Hasnaoui and K. Saadouni, J. Non-Cryst. Solids, 2016, 443, 136–142 CrossRef CAS.
- C. Wu, Y. Huang and J. Shen, Sci. Sin.-Phys. Mech. Astron., 2012, 42, 565 CrossRef.
- M. Li, C. Z. Wang, S. G. Hao, M. J. Kramer and K. M. Ho, Phys. Rev. B: Condens. Matter Mater. Phys., 2009, 80, 184201 CrossRef.
- L. Hui, D. Feng, B. Xiufang and W. Guanghou, Chem. Phys. Lett., 2002, 354, 466–473 CrossRef.
- K. F. Kelton, A. K. Gangopadhyay, T. H. Kim and G. W. Lee, J. Non-Cryst. Solids, 2006, 352, 5318–5324 CrossRef CAS.
- A. Di Cicco, A. Trapananti, S. Faggioni and A. Filipponi, Phys. Rev. Lett., 2003, 91, 135505 CrossRef PubMed.
- I. N. Stranski and D. Totomanow, Z. Phys. Chem., 1933, 163, 399–408 Search PubMed.
- D. Y. Sun, M. Asta, J. J. Hoyt, M. I. Mendelev and D. J. Srolovitz, Phys. Rev. B: Condens. Matter Mater. Phys., 2004, 69, 020102 CrossRef.
- Z.-A. Tian, R.-S. Liu, C.-X. Zheng, H.-R. Liu, Z.-Y. Hou and P. Peng, J. Phys. Chem. A, 2008, 112, 12326–12336 CrossRef CAS PubMed.
- A. D. Bruce, A. N. Jackson, G. J. Ackland and N. B. Wilding, Phys. Rev. E: Stat. Phys., Plasmas, Fluids, Relat. Interdiscip. Top., 2000, 61, 906–919 CrossRef CAS.
- S. Pronk and D. Frenkel, J. Chem. Phys., 1999, 110, 4589–4592 CrossRef CAS.
- J. Zhu, M. Li, R. Rogers, W. Meyer, R. H. Ottewill, S. T. S. S. S. Crew, W. B. Russel and P. M. Chaikin, Nature, 1997, 387, 883–885 CrossRef CAS.
- D. Hull and D. J. Bacon, Introduction to dislocations, Butterworth-Heinemann, 2001 Search PubMed.
- L. Cao and M. Koslowski, J. Appl. Phys., 2015, 117, 244301 CrossRef.
- J. Schiøtz, T. Vegge, F. D. Di Tolla and K. W. Jacobsen, Phys. Rev. B: Condens. Matter Mater. Phys., 1999, 60, 11971–11983 CrossRef.
- P. R. Okamoto, J. K. Heuer, N. Q. Lam, S. Ohnuki, Y. Matsukawa, K. Tozawa and J. F. Stubbins, Appl. Phys. Lett., 1998, 73, 473–475 CrossRef CAS.
- P.-t. Li, Y.-q. Yang, X. Luo, N. Jin, G. Liu, C.-d. Kou and Z.-q. Feng, Mater. Sci. Eng., A, 2017, 684, 71–77 CrossRef CAS.
- A. L. Gurson, J. Eng. Mater. Technol., 1977, 99, 2–15 CrossRef.
| This journal is © The Royal Society of Chemistry 2017 |

