 Open Access Article
Creative Commons Attribution 3.0 Unported Licence
Ag+, Fe3+ and Zn2+-intercalated cadmium(II)-metal–organic frameworks for enhanced daylight photocatalysis†
Nur Atiqah Suriba,
Lan Ching Simb,
Kah Hon Leong*b,
Aneek Kuilac,
Pichiah Saravanan *ac,
Kong Mun Lod,
Shaliza Ibrahima,
Detlef Bahnemann
 e and
Min Jangf
aEnvironmental Engineering Laboratory, Department of Civil Engineering, University of Malaya, 50603 Kuala Lumpur, Malaysia. E-mail: shaliza@um.edu.my
bDepartment of Environmental Engineering, Faculty of Engineering and Green Technology, Universiti Tunku Abdul Rahman, Jalan Universiti, Bandar Barat, 31900 Kampar, Perak, Malaysia. E-mail: khleong@utar.edu.my
cEnvironmental Nanotechnology Laboratory, Department of Environmental Science and Engineering, Indian Institute of Technology (ISM), Dhanbad-826004, Jharkhand, India. E-mail: pichiahsaravanan@gmail.com
dDepartment of Chemistry, Faculty of Science, University of Malaya, 50603 Kuala Lumpur, Malaysia
eInstitut fuer Technische Chemie, Leibniz Universität Hannover, Callinstrasse 3, D-30167 Hannover, Germany
fDepartment of Environmental Engineering, Kwangwoon University, 20 Kawangoon-ro, Nowon-gu, Seoul 01897, Korea
First published on 3rd November 2017
Abstract
Design and synthesis of multi-dimensional metal–organic frameworks are fascinating because MOFs possess intriguing structures and unique properties and exhibit potential applications in photocatalysis. In the present study, we endeavoured to synthesize a new Cd-linked MOF through a simple hydrothermal route. The daylight utilising attributes of the Cd-MOF were enhanced by intercalating Ag+, Fe3+, and Zn2+ into the framework via an ion-exchange technique. The optical property shows that Fe3+ stimulates the photo response in the visible region, whereas Ag+ and Zn2+ stimulate the photo response in the ultraviolet light region. Photocatalytic efficiency of the developed MOFs was investigated by degradation of 2-CP under daylight illumination. The Cd-MOFs intercalated with Fe3+ exhibit excellent photocatalysis as compared to the rest, degrading 93% of 2-CP in 5 h of illumination. The intercalation of Fe3+ onto the Cd-MOF significantly reduced the energy gap of the pure MOF; this led to an increased formation of reactive oxygen species driven by the electrons (e−) and holes (h+). Thus, the developed modified MOF clearly demonstrated its capability as a daylight photocatalyst as compared to the existing conventional photocatalysts.
Introduction
Photocatalysis is an entity of advanced oxidation process that has emerged as a better alternative to the biological approach in tackling the rapid growth of water and wastewater issues. The lower quantum yield and inability of the present generation metal-oxide photocatalysts to utilize the solar light or daylight have prompted the researchers to develop next generation sustainable photocatalysts. In this regard, metal–organic frameworks (MOFs), a self-assembly with metal nodes connected by an organic linker(s), have transpired as one of the most promising alternatives to conventional photocatalysts.1–4 Several MOFs hold different metal centers (Cd, Co, Cu, Ni, and Zn) with attractive topologies.5–9 Many of these exhibit interesting properties such as structure variety, chirality, photoluminescence, and unusual magnetic behaviour. Besides this, they have been demonstrated to be remarkable candidates in nonlinear optics, catalysis, and semiconductor physics.10,11The synthesis route of an MOF plays a crucial role in determining the phenomenal abilities of the MOF for sustainable photocatalysis. However, the synthesis route is strongly influenced by both the organic linker and coordination geometry of central metal ions.12–15 Consequently, the selection of suitable organic ligands is crucial for self-assembly of a special architecture.12,16 Herein, we have chosen a multi-carboxylic acid, 1,2,4,5-benzenetetracarboxylic acid (H4btec), as a linker that exhibits several unique structures and properties. This linker also promoted the formation of 2D and 3D coordination polymers by bridging with a transition metal, and the –COOH group endorsed full or partial deprotonation, resulting in a versatile coordination behaviour.17–19 For instance, Wen and co-workers constructed five metal–organic frameworks [M-(btec)0.5(bimb)0.5 (M = Co (1), Ni (2), Cu (3), Zn (4), and Cd (5))] using 1,2,4,5-benzenetetracarboxylic acid (H4btec) and 4,4′-bis(1-imidazolyl)biphenyl (bimb) and revealed their diversified structures and topologies. The compound [Cd(btec)0.5(bimb)0.5]n showed good photocatalytic activities as compared to other MOFs, and 80% of the anionic organic dye X3B compound was degraded in 5 h.9
Although MOFs have numerous advantages, their poor photoresponse in the visible light region limits their ability of activation under solar irradiation or lower energy photons.20,21 Hence, identification of alternative strategies to activate them under visible region is vital to promote sustainable photocatalysis.22–24 Intercalation or doping i.e., the inclusion of selected metal ions into the framework, is a facile and promising strategy. The organic linkers and transition metals in MOFs cause various ligands to undergo metal charge transfer (LMCT) transitions that make the MOF a more adaptable and potentially tuneable photocatalyst.9,25 This is because the intercalated MOF possesses smaller band gap energy (Eg), which will definitely improve its photocatalytic activity.26 Limited studies have been reported on this intercalation on a metal–organic framework. Li and co-workers reported that Zn and Co based MOFs displayed better photocatalytic efficiency in the removal of rhodamine B (RhB) dye as compared to the undoped MOF. They observed 94% and 90% removal efficiency for Zn-MOF and Co-MOF, respectively, upon 2.5 h irradiation with UV light.27 Moreover, doping of an MOF with transition metal ions was studied by Xu and co-workers. They performed the synthesis of Fe(III)-doped coordination polymers, exhibited improved photocatalytic performance in the degradation of rhodamine B (RhB) under visible light illumination.28 Yang and co-workers in 2012 successfully tuned the photocatalytic properties of an MOF, namely ZIF-67, via a doping technique. They achieved higher photodegradation of methyl orange using Cu doped ZIF-67 than that obtained using non-doped ZIF-67 under artificial visible light irradiation using a lamp source.29 However, reports on a daylight utilizing MOF for photodegradation of chlorophenols are limited.
Hence, our group developed a new cadmium-based metal–organic framework through a simple hydrothermal route. The developed MOF was intercalated with selected metals ions, such as Ag+, Fe3+, and Zn2+, by an ion-exchange method. The functionality and quantum of the developed MOFs were investigated through robust material analytics. This is the report on the inherent daylight utilizing characteristics of MOFs.
Experimental
Materials
Cadmium(II) nitrate tetrahydrate, Cd(NO3)2.4H2O, 1,2,4,5-benzenetetracarboxylic acid (H4btec), and 2-chlorophenol (2-CP) were purchased from Sigma Aldrich. Silver nitrate (AgNO3, 99%, Friendemann Schmidt), sodium hydroxide (NaOH), Iron(III) nitrate nonahydrate (Fe(NO3)3·9H2O), and zinc(II) nitrate hexahydrate [Zn(NO3)2·6H2O] were purchased from R&M Chemicals; sulphuric acid (H2SO4, 98%) was purchased from Merck. AEROXIDE® P25 was obtained from Evonik Industries AG, Germany. All chemicals and solvents were used without further purification.Synthesis of the Cd-MOF and metal ion-intercalated Cd-MOF
A mixture of Cd(NO3)2·4H20 (0.1 mmol), H4btec (0.1 mmol), NaOH (0.2 mmol), and 15 mL deionized water was stirred for 20 min. The mixture was transferred into a Teflon-lined hydrothermal reactor and heated at 180 °C for 48 h. After slowly cooling at room temperature, colorless needle-shaped crystals were obtained, which were centrifuged and repeatedly washed with distilled water. The intercalation of metal ions into metal–organic frameworks was performed according to a previous report.28 The as-prepared MOF (0.12 g) was dispersed in a 15 mL 0.01 M solution of Fe(NO3)3·9H2O, [Zn(NO3)2·6H2O], and Ag(NO3) through an ion-exchange reaction. Cd(NO3)2·4H20 and metal ion molar ratio was 1![[thin space (1/6-em)]](https://www.rsc.org/images/entities/char_2009.gif) :
:![[thin space (1/6-em)]](https://www.rsc.org/images/entities/char_2009.gif) 1. The time of the reaction between metal ions and the synthesized Cd-MOF is an important factor that affects the fluorescence emission of materials.29 After stirring for 24 h at room temperature, the resulting powders were washed with distilled water and dried in an oven at 60 °C for 12 h. The samples were labelled as Fe–Cd-MOF, Zn–Cd-MOF, and Ag–Cd-MOF.
1. The time of the reaction between metal ions and the synthesized Cd-MOF is an important factor that affects the fluorescence emission of materials.29 After stirring for 24 h at room temperature, the resulting powders were washed with distilled water and dried in an oven at 60 °C for 12 h. The samples were labelled as Fe–Cd-MOF, Zn–Cd-MOF, and Ag–Cd-MOF.
Characterization
The powder X-ray diffraction (PXRD) data were obtained using the PANalytical, EMPYREAN diffractometer with Cu Kα radiation (λ = 1.5418 Å) over the 2θ range of 5–60° at room temperature. The solid-state diffuse-reflectance UV/vis spectra for powder samples were obtained via the Shimadzu UV-2600 UV-vis scanning spectrophotometer using BaSO4 as a white standard. Thermogravimetric analyses were conducted using the STA 449 F3 Jupiter, Netzsch thermal analyser under flowing N2 at a heating rate of 10 °C min−1 between ambient temperature and 700 °C. The samples for infrared spectroscopy were prepared as KBr pellets, and the spectra were acquired in the 4000–400 cm−1 range using the Perkin Elmer Spectrum 400 FTIR spectrophotometer. The Brunauer–Emmett–Teller (BET) surface area was measured at 77 K using Micromeritics ASAP 2020, TRISTAR II 3020. The sample was degassed for 5 h under nitrogen before the analysis. The luminescence spectra of the samples were obtained by the micro-PL/Raman spectroscope at the excitation wavelength of 325 nm (Renishaw, inVia Raman Microscope). X-ray photoelectron spectroscopies (XPS) were conducted on the synthesized samples using EnviroESCATM at Specs GmbH, Berlin, in the scan range of 0–1200 eV binding energy. The obtained high-resolution XPS spectra were analyzed using the CasaXPS peak fitting software program.Single-crystal structure determination
A suitable single crystal was carefully selected using an optical microscope and glued to thin glass fibres. Intensity data were obtained using a Bruker Smart APEX II CCD diffractometer with graphite-monochromated Mo Kα radiation (λ = 0.71073 Å) at room temperature. Empirical absorption corrections were applied using the Olex2 program.30 The structures were solved by direct methods and refined by the full-matrix least-squares based on F2 using the SHELX program.31 All non-hydrogen atoms were refined anisotropically, and the hydrogen atoms of organic ligands were generated geometrically. Crystal data and structural refinement parameters for Cd-MOF are summarized in Table S1.† Selected bond distances and bond angles are listed in Table S2.†Photocatalytic experiments
An aqueous solution containing 10 mg L−1 of 2-chlorophenol (200 mL) and 180 mg of catalyst was stirred under dark conditions for 24 h to ensure the establishment of an adsorption equilibrium (Fig. S3†). The photocatalysis experiments were then conducted using direct daylight irradiation under clear sky conditions at the University of Malaya, Kuala Lumpur, between 10.00 am and 4.00 pm. The intensity of the light was measured using an LT Lutron LX-101 Lux meter. The effect of pH on the degradation of 2-chlorophenol was investigated by adjusting the pH value using NaOH (0.1 M) and H2SO4 (0.1 M). Aliquots were drawn out at regular intervals, centrifuged, and analysed for residual 2-CP concentration using ultra-performance liquid chromatography (UPLC) (ACQUITY UPLC H Class, Waters) equipped with a C18 column (50 mm × 2.1 mm × 1.7 μm). Acetonitrile (ACN) and water in the ratio 60![[thin space (1/6-em)]](https://www.rsc.org/images/entities/char_2009.gif) :
:![[thin space (1/6-em)]](https://www.rsc.org/images/entities/char_2009.gif) 40 were used as the mobile phase, flushed at a rate of 0.4 mL min−1, and the detector wavelength was fixed at 285 nm.
40 were used as the mobile phase, flushed at a rate of 0.4 mL min−1, and the detector wavelength was fixed at 285 nm.
Results and discussion
Single crystal X-ray analysis revealed that the Cd-MOF crystallized in a triclinic system with the space group P![[1 with combining macron]](https://www.rsc.org/images/entities/char_0031_0304.gif) (Table S1†). As shown in Fig. 1, Cd(II) ion was six-coordinated with two oxygen atoms from two carboxylate groups of two different btec4− linkers, which were situated in the two equatorial planes, and four coordinated water molecules; this resulted in a slightly distorted octahedral coordination geometry. The (O3 and O1) atoms comprise the equatorial plane, and (O (11), O5, O6, and O7) occupy axial positions. The Cd–O bond length varies from 2.236(3) Å to 2.371 (4) Å and is comparable to the corresponding values of Cd-carboxylic complexes (Table S2†). All carboxylate groups of the H4btec linker were deprotonated, as revealed through the IR spectrum, as shown in Fig. 4, and no peaks at or around 1730 cm−1 (for protonated carboxylic acid group) were observed.32
(Table S1†). As shown in Fig. 1, Cd(II) ion was six-coordinated with two oxygen atoms from two carboxylate groups of two different btec4− linkers, which were situated in the two equatorial planes, and four coordinated water molecules; this resulted in a slightly distorted octahedral coordination geometry. The (O3 and O1) atoms comprise the equatorial plane, and (O (11), O5, O6, and O7) occupy axial positions. The Cd–O bond length varies from 2.236(3) Å to 2.371 (4) Å and is comparable to the corresponding values of Cd-carboxylic complexes (Table S2†). All carboxylate groups of the H4btec linker were deprotonated, as revealed through the IR spectrum, as shown in Fig. 4, and no peaks at or around 1730 cm−1 (for protonated carboxylic acid group) were observed.32
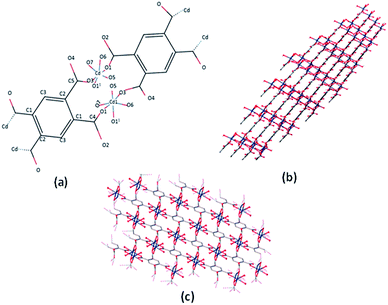 | ||
| Fig. 1 (a) The coordination environment of Cd(II) ion in the Cd-MOF. (b and c) 3D network of the Cd-MOF. | ||
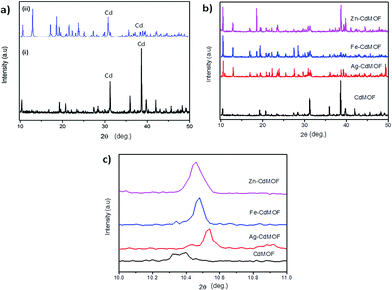
Fig. 2a illustrates the phase purity and crystallinity of the pure Cd-MOF. It was confirmed by a direct comparison between the powder single-crystal X-ray diffraction pattern and the simulated pattern. Solid diffraction peaks observed at 38.6°, as shown in Fig. 2a, correspond to the (1 0 1) plane of cadmium (ICDD no. 05-0640).33 Both diffraction patterns indicated the homogenous characteristics of the synthesized MOFs. The crystallite size of the Cd-MOF calculated using the Scherrer equation (eqn (S1)†) was 75.06 nm.34 Fig. 2b shows the diffraction pattern of metal ion (Ag, Fe, and Zn)-intercalated Cd-MOF. The pattern exhibited diffraction peaks that were almost similar to those of pure Cd-MOF at the diffraction angles of 10.4°, 19.23°, 20.7°, 31.2°, 35.9°, 38.6°, and 39.7°. In addition, the peaks of the intercalated MOF shifted marginally as compared to those of the pure MOF probably due to disorder in the crystal structure of the former.35 New and distinctive peaks at 12.9°, 31.4°, and 38.8° were observed in the diffraction pattern of the intercalated Cd-MOF due to the interaction of metal ions with the Cd-MOF or the organic linker via π-complexation or a chelation process.36 As shown in Fig. 2c, the peaks shifted to a higher degree region for the Ag–Cd-MOF, Fe–Cd-MOF, and Zn–Cd-MOF. This shift confirms that the intercalated Ag+, Fe3+, and Zn2+ are very well stocked in the crystal lattice of MOF owing to the narrow ionic radii of Ag+ (1.3 Å), Fe3+ (0.65 Å), and Zn2+ (0.74 Å). Subsequently, the unit cell shrank distinctly and peaks shifted towards a higher angle region when metal ions were inserted into the Cd-MOF.37
The Cd-MOF and metal ions-intercalated sample exhibited a prism-like structure, as clearly shown in Fig. 3. However, the metal ion-intercalated samples showed slightly irregular-shaped particles distributed throughout. The calculated Brunauer–Emmett–Teller (BET) specific surface area for the Cd-MOF is 13.11 m2 g−1, and the obtained hysteresis is presented in Fig. S1.† The obtained surface area signified the role of adsorption, where photocatalysis contributed dominantly due to ease of harvestation of photons. The FTIR spectrum of the studied MOFs is shown in Fig. 4a. The characteristic bands of carboxylate groups were seen at 1557 cm−1 for antisymmetric stretching vibrations νas(COO−) and at 1387 cm−1 for symmetric stretching vibrations νs(COO−). The separation (Δν) between νas(COO−) and νs(COO−) of 170 cm−1 for the Cd(II) complex suggests monodentate coordination modes for the coordinated carboxylate group.32 The absence of a characteristic band at 1700 cm−1 for protonated carboxylate groups indicated that all the carboxylate groups of the ligand were deprotonated, which was in accordance with the X-ray structural analytical results.32 The C![[double bond, length as m-dash]](https://www.rsc.org/images/entities/char_e001.gif) C bending vibration in the benzene ring of the H4btec linker was visible at 1564 cm−1. The absorption at 1487 cm−1 was produced by a combination of benzene ring stretching and deformation modes, and the peak around 673 cm−1 was associated with the bending vibration of C–H.38
C bending vibration in the benzene ring of the H4btec linker was visible at 1564 cm−1. The absorption at 1487 cm−1 was produced by a combination of benzene ring stretching and deformation modes, and the peak around 673 cm−1 was associated with the bending vibration of C–H.38
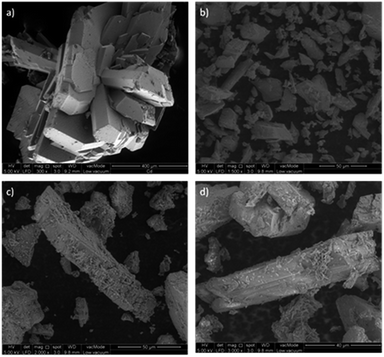 | ||
| Fig. 3 Topography of the studied MOFs [(a) Cd-MOF, (b) Ag–Cd-MOF, (c) Fe–Cd-MOF, and (d) Zn–Cd-MOF]. | ||
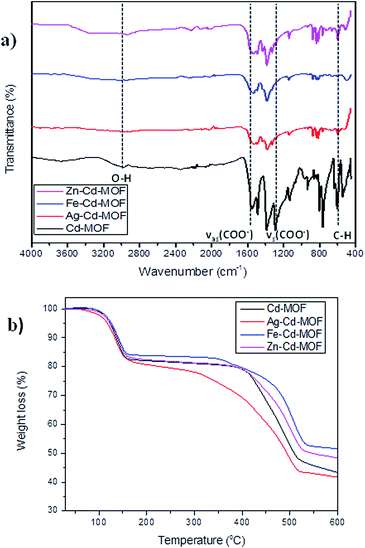 | ||
| Fig. 4 (a) FTIR spectrum of pure and metal ions intercalated Cd-MOF and (b) thermal stability contour of studied MOFs. | ||
The robust thermal stability of the studied samples was established through thermogravimetric analysis (TGA), as depicted in Fig. 4b. For the complex Cd-MOF, two stages of weight loss were observed: the first observed in the range of 100–258 °C corresponded to the loss of bound water molecules around the framework, and the second observed between 400 °C and 650 °C was attributed to the decomposition of the carbon ligand. Similarly, Fe and Zn–Cd-MOF also displayed the same two stage weight-loss phenomenon with good thermal stability, whereas Ag–Cd-MOF complex differed with slightly poor stability, and its structure collapsed when temperature was increased beyond 300 °C. The Cd-MOF showed similar thermal stability curve as [[Ni(H2O)4(bipy)](BTA)0.5·H2O] consisting of a distorted octahedral configuration.39 This is because the thermal stability of the synthesized MOFs is influenced by the coordination number and local coordination environment instead of the framework topology.40 The resulting residue at the end of the TGA experiment is CdO.
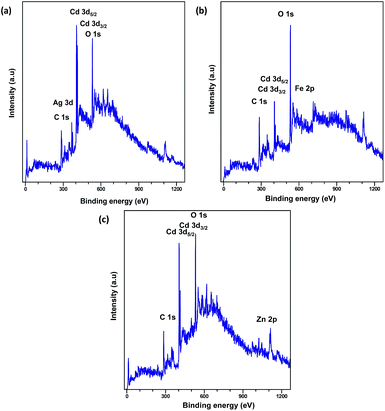
XPS analysis was carried out to explore the surface elemental composition of the prepared MOFs. The full survey spectrum of Cd-MOF presented in Fig. 5 showed the presence of elements in the as-synthesized materials. The C 1s spectrum of Cd-MOF displayed three distinct peaks at 284.86, 286.26, and 288.37 eV corresponding to C–C, C–O, and C![[double bond, length as m-dash]](https://www.rsc.org/images/entities/char_e001.gif) O and O–C
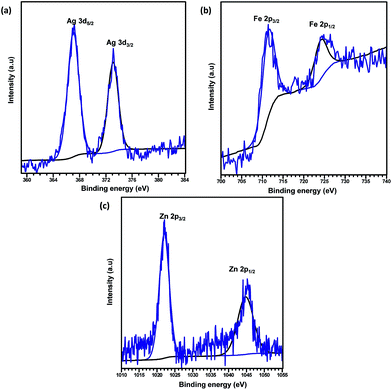
O and O–C![[double bond, length as m-dash]](https://www.rsc.org/images/entities/char_e001.gif) O groups, respectively.41,42 The binding energy of the O 1s core level was observed at 531.8 eV (see Fig. 5d) and resembles the characteristics of O2− ions in the crystalline network. It is located on the side of higher binding energies; this proved the presence of surface hydroxyl groups or chemisorbed water molecules in higher concentrations.43 In the 3d core–shell level spectrum, the peaks of photoelectron for Cd in pure Cd-MOF were observed at 405.01 and 411.95 eV, attributed to the Cd5/2 and Cd3/2 electrons, respectively (see Fig. 5b). The intercalation of metal ions shifted the Cd peak towards higher energies. These can be ascribed to the formation of new Mn+–O (Mn+ = Ag2+, Fe3+, and Zn2+).44 As shown in Fig. 6, the peaks Cd5/2 and Cd3/2 for Ag-MOF, Fe-MOF, and Zn-MOF appeared at 405.09 and 412.5 eV, 405.24 and 412.18 eV, and 405.07 and 411.98 eV, respectively. Furthermore, inset of Fig. 7 displays the presence of Ag2+, Fe3+, and Zn2+ in the framework. The peaks at 367.81 and 373.91 eV, 711.34 and 724.54 eV, and 1022.15 and 1045.15 eV correspond to Ag 3d5/2 and Ag 3d3/2, Fe 2p3/2 and Fe 2p1/2, and Zn 2p3/2 and Zn 2p1/2, respectively. The binding energies of the inserted metal ions in the framework shifted to a higher energy level than those of the pure Cd-MOF. These inferences clearly substantiated the intercalation of metal ions into the framework.45
O groups, respectively.41,42 The binding energy of the O 1s core level was observed at 531.8 eV (see Fig. 5d) and resembles the characteristics of O2− ions in the crystalline network. It is located on the side of higher binding energies; this proved the presence of surface hydroxyl groups or chemisorbed water molecules in higher concentrations.43 In the 3d core–shell level spectrum, the peaks of photoelectron for Cd in pure Cd-MOF were observed at 405.01 and 411.95 eV, attributed to the Cd5/2 and Cd3/2 electrons, respectively (see Fig. 5b). The intercalation of metal ions shifted the Cd peak towards higher energies. These can be ascribed to the formation of new Mn+–O (Mn+ = Ag2+, Fe3+, and Zn2+).44 As shown in Fig. 6, the peaks Cd5/2 and Cd3/2 for Ag-MOF, Fe-MOF, and Zn-MOF appeared at 405.09 and 412.5 eV, 405.24 and 412.18 eV, and 405.07 and 411.98 eV, respectively. Furthermore, inset of Fig. 7 displays the presence of Ag2+, Fe3+, and Zn2+ in the framework. The peaks at 367.81 and 373.91 eV, 711.34 and 724.54 eV, and 1022.15 and 1045.15 eV correspond to Ag 3d5/2 and Ag 3d3/2, Fe 2p3/2 and Fe 2p1/2, and Zn 2p3/2 and Zn 2p1/2, respectively. The binding energies of the inserted metal ions in the framework shifted to a higher energy level than those of the pure Cd-MOF. These inferences clearly substantiated the intercalation of metal ions into the framework.45
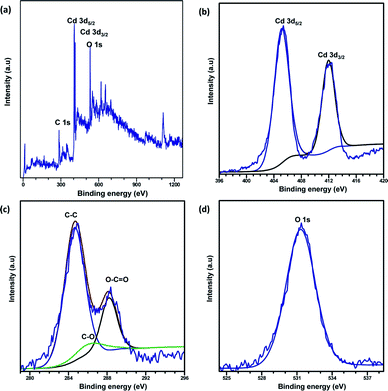 | ||
| Fig. 5 Full XPS spectrum of the (a) Cd-MOF and close up survey at (b) Cd, (c) C, and (d) O core level. | ||
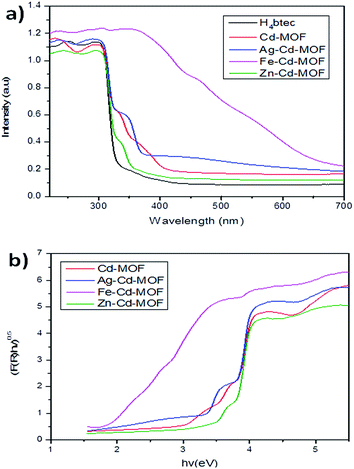
Light absorption spectroscopy is a principally suitable technique to determine the energy structure of materials in response to the electromagnetic forces. The UV-vis absorption spectra of all the studied samples including those of the linkers were obtained in the crystalline state at room temperature, as presented in Fig. 8a. H4btec showed strong absorption in the UV region that is ascribed to π* → π transitions. The band of the metal ion-intercalated MOF showed a red shift due to the coordination of LMCT.46 Among all the metal ion-inserted MOFs, the Fe3+-inserted MOF displayed a strong photoresponse in the visible spectrum, whereas Ag+- and Zn2+-inserted MOFs displayed a strong photoresponse in a region close to the shorter wavelength region.47,48 The optical diffuse-reflection spectra of MOFs were obtained using the Kubelka–Munk function (eqn (S2) and (S3)†).49,50 The energy difference between the bands was calculated via extrapolating the linear portion of the absorption edges (Fig. 8b). The energy difference for the pure Cd-MOF was estimated to be 3.6 eV, whereas those for the Ag+-, Zn2+-, and Fe3+-intercalated Cd-MOFs were 3.5 eV, 3.4 eV, and 2.0 eV, respectively. It was clear that Fe3+ possessed significantly narrow energy gaps, signifying that insertion of Fe3+ into the framework of parent complex was a realistic approach for robust solar photocatalytic behavior.51 This remarkable characteristic achievement was due to the presence of d10 metal atoms in the framework center.46,52,53 Further, the photoluminescence attributes of the MOFs and free organic H4btec linker were investigated in the solid state at room temperature, as shown in Fig. S2.†
The spectra revealed that the H4btec linker displayed weak fluorescence emission with a maximum at 396 nm under excitation at 325 nm. The free H4btec linkers exhibit weaker luminescence emission bands at 397 nm, signifying the intraligand (π*–σ or π*–π) emission.54,55 The emission maxima of Ag and Zn ion-intercalated MOF showed an emission peak in the near visible region i.e., 420 nm and 425 nm, respectively, with a slightly extended spectrum covering the visible light zone. The Fe3+-intercalated MOF showed maximum emission at 440 nm upon excitation at 325 nm with a wider and broader spectrum covering the complete visible spectrum till 650 nm. Since Cd(II) ions are highly resistant to redox process and due to its stable d10 configurations, the emissions are neither metal-to-ligand charge transfer (MLCT) nor metal-to-metal charge transfer (MMCT) in nature. Hence, the observed shift of the emission band was caused by the deprotonated effect of H4btec and should be assigned to coordination interactions of H4btec carboxylate groups with Cd(II) atoms.56
The daylight photocatalytic efficacy of the synthesized MOFs was studied by adopting 2-CP as the model, as illustrated in Fig. 9a. Photocatalytic activity of the synthesized MOFs was compared using Degussa, P25 (TiO2), and deprived efficiency of 2-CP was observed. The Cd-MOF resulted in ∼69% removal of 2-CP within 5 h of exposure to daylight. Notably, metal ion-intercalated Cd-MOF showed significant enhancement in the removal of 2-CP. Cd-MOF intercalated with Fe3+ displayed a higher removal efficiency i.e., 93% in 5 h with the highest rate constant of 0.0325 min−1, whereas 75% and 80% removal efficiency of 2-CP was observed for Ag– and Zn–Cd-MOF, respectively. The obtained enhanced photocatalytic activity of Fe–Cd-MOF was attributed to the following factors: the energy gap of Fe3+-intercalated MOF was lower than that of the rest; this enabled easy charge transfer in Fe–Cd-MOF. Introduction of Fe3+ significantly enhanced broad spectrum in the visible domain with a higher degree leaning towards the red shift. The aforesaid two significant qualities contributed by the intercalated ions triggered the visible light photocatalytic activity of the Fe–Cd-MOF photocatalyst.9,28 Moreover, the structural factors, including coordinated water molecule, organic ligands, and varied central metal ions, significantly influenced the photocatalytic activity of the Fe3+-intercalated Cd-MOF.49,57
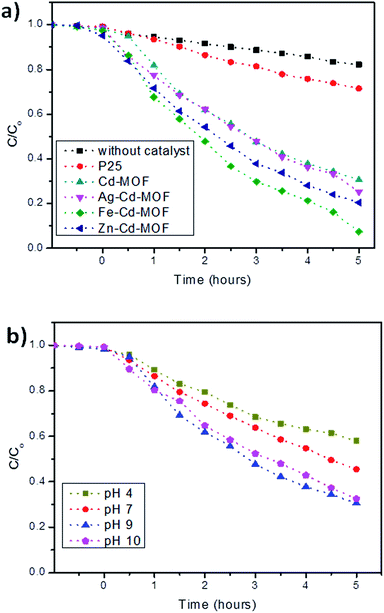 | ||
| Fig. 9 (a) Photocatalytic performance of the studied MOFs activated under daylight and compared with AEROXIDE® P25 and (b) effect of pH on the degradation of 2-CP for Cd-MOF. | ||
The effect of solution pH is one of the critical parameters that influences photodegradation in the presence of Cd-MOF.58,59 Considering its importance, a study was carried out, and the obtained relationship is presented in Fig. 9b. The experiment clearly showed that only 42% of 2-CP was degraded under acidic conditions. This is because at lower pH, the positively charged surface hinders the reaction between the positive holes and water molecule; this results in a poor yield of hydroxyl ions and in turn radicals.60,61 However, the efficiency increased with an increase in pH, reaching a maximum of 93% at pH 9. The alkaline conditions favour the oxidation reaction and yield a higher concentration of (OH−) to react with holes to form highly reactive short-lived (*OH), thus easily oxidizing the 2-CP.60,61
Fig. S4† elucidates the reusability of Cd–, Fe–, Ag–, and Zn–Cd-MOF. The photocatalysts were reused thrice, and no changes were found in the efficiency as compared to the case of the virgin cycle. The recovered MOF was subjected to the cryptographic analysis for revealing its structural stability. Fig. S5† shows the spectra obtained before and after photocatalysis experiments, and it is clear that the MOFs remain same; this indicates that their structures are not distorted during the photocatalysis experiments driven under the daylight illumination. The study obviously established the robust stability of the studied MOF.
The photodegradation kinetics of the 2-CP degradation by Cd-MOF and ion-intercalated Cd-MOF was further analysed. The 2-CP photodegradation followed the first-order kinetics model, as shown in eqn (S4).†9 It can be seen from Fig. S6† that the rate constant for 2-CP degradation in the presence of Fe–Cd-MOF is 0.0325 min−1 and that in the presence of Cd-MOF is 0.0189 min−1. Moreover, Ag+- and Zn2+-intercalated MOFs resulted in a rate constant of 0.0209 min−1 and 0.0258 min−1, respectively. The dominant rate constant for Fe3+-intercalated MOF advocated its lower energy gap that empowered the easy charge transfer from highest occupied molecular orbital (HOMO) to lowest unoccupied molecular orbital (LUMO) on photoexcitation.9
The movement of electrons for Cd-MOF and metal ion-intercalated Cd-MOF could be discussed based on the HOMO–LUMO principle and is schematically presented in Fig. 10. During the photocatalytic process, HOMO was mainly contributed by oxygen and (or) nitrogen 2p bonding orbitals and LUMO was mainly contributed by empty transition metal orbitals. Under the daylight irradiation, electrons (e−) in the HOMO of Cd-MOF were excited to its empty orbital of LUMO, leaving the holes (h+) in the HOMO orbitals. The HOMO strongly demanded one electron to return to its stable state. Therefore, one electron was captured from water molecules, which were oxygenated into *OH active species. Moreover, the electrons in LUMO could be combined with the oxygen adsorbed on the surfaces of Cd-MOF to form *O2−. It then further generates hydroxyl radicals (*OH), which are active radicals that are responsible for the degradation of 2-CP.12,43,62 Upon inserting metal ions, such as Ag+, Fe3+, and Zn2+, into the Cd framework, a new energy level is triggered between the LUMO of pure Cd-MOF and the 3d orbital-doped Cd-MOF, which can be considered as LUMO of Ag–Cd-MOF, Fe–Cd-MOF, and Zn–Cd-MOF (Fig. 10b). The energy gap of the doped Cd-MOF was reduced because the LUMO energy level of the Cd-MOF contributed by the respective metal ions was lower than that of the pure Cd-MOF, and its HOMO energy level was retained. Thus, the electrons in the doped Cd-MOF were excited from the HOMO to the newly formed LUMO orbitals with a lower energy gap than that of the pure Cd-MOF. It can be confirmed that the visible light activation of Ag–Cd-MOF, Fe–Cd-MOF, and Zn–Cd-MOF can be attributed to the matching of the LUMO of Cd-MOF for the 3d orbital of metal ions (Ag+, Fe3+, and Zn2+).28
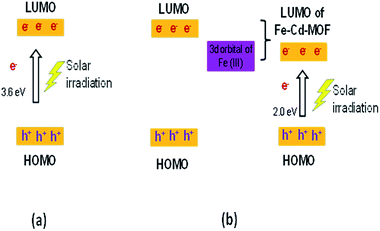 | ||
| Fig. 10 Mechanistic illustration of the synthesized MOF on the degradation of 2-CP (a) pure Cd-MOF and (b) metal ion-intercalated Cd-MOF. | ||
Conclusions
Visible-light promising cadmium(II)-based metal–organic framework was obtained with modifications through intercalation of selected metal ions into the framework. The subjected characterisation has clearly revealed the role of each studied metal ion, and the selected ions acted as agents to enhance daylight utilization. The movement of the electrons and hole that was promoted by Fe3+ was deliberated through the functionality analysis. The daylight photocatalytic activity of the modified MOFs proved their competence via degradation of a non-photosensitising recalcitrant chlorinated organic compound. The present study disclosed the ability of the metal ions to promote the electron movements by utilizing the daylight energy, with a clear objective on the destruction of environmental pollutants.Conflicts of interest
The authors do not have any conflicts to declare.Acknowledgements
The corresponding author (Pichiah Saravanan) is grateful to the Ministry of Higher Education, Malaysia, for the financial support received under the Fundamental Research Grant Scheme (FRGS) with the grant code FP051-2013B and University of Malaya for Postgraduate Research Grant (PG 229-2015A). The authors are thankful to Dr Felix Leyssne, SPECS Surface Nano Analysis GmbH, Germany, for XPS analysis.References
- Y. Lin, C. Kong, Q. Zhang and L. Chen, Adv. Energy Mater., 2016, 7, 1601296 CrossRef.
- S. Rawalekar and T. Mokari, Adv. Energy Mater., 2013, 3, 12–27 CrossRef CAS.
- F. Wang, X. Ke, J. Zhao, K. Deng, X. Leng, Z. Tian, L. Wen and D. Li, Dalton Trans., 2011, 40, 11856–11865 RSC.
- Z. T. Yu, Z. L. Liao, Y. S. Jiang, G. H. Li and J. S. Chen, Chem.–Eur. J., 2005, 11, 2642–2650 CrossRef CAS PubMed.
- J. An, S. J. Geib and N. L. Rosi, J. Am. Chem. Soc., 2009, 131, 8376–8377 CrossRef CAS PubMed.
- P. M. Forster, P. M. Thomas and A. K. Cheetham, Chem. Mater., 2002, 14, 17–20 CrossRef CAS.
- N. Guillou, C. Livage, M. Drillon and G. Férey, Angew. Chem., Int. Ed., 2003, 42, 5314–5317 CrossRef CAS PubMed.
- C. Livage, N. Guillou, J. Marrot and G. Férey, Chem. Mater., 2001, 13, 4387–4392 CrossRef CAS.
- L. Wen, J. Zhao, K. Lv, Y. Wu, K. Deng, X. Leng and D. Li, Cryst. Growth Des., 2012, 12, 1603–1612 CAS.
- A. Paz, A. Filipe, Y. Z. Khimyak, A. D. Bond, J. Rocha and J. Klinowski, Eur. J. Inorg. Chem., 2002, 2002, 2823–2828 Search PubMed.
- G. Sneddon, A. Greenaway and H. H. Yiu, Adv. Energy Mater., 2014, 4, 1301873 CrossRef.
- J. Guo, J. Yang, Y. Y. Liu and J. F. Ma, CrystEngComm, 2012, 14, 6609–6617 RSC.
- Q. W. Wang, X. F. Qi, X. M. Li, J. Y. Ji, Y. L. Niu and B. Liu, J. Inorg. Organomet. Polym. Mater., 2013, 23, 1313–1317 CrossRef CAS.
- X. Zhang, J. Zhou, W. Shi, Z. Zhang and P. Cheng, CrystEngComm, 2013, 15, 9738–9744 RSC.
- D. C. Zhong, H. B. Guo, J. H. Deng, Q. Chen and X. Z. Luo, CrystEngComm, 2015, 17, 3519–3525 RSC.
- X. F. Zhu, N. Wang, X. Y. Xie, R. B. Hou, D. F. Zhou, Y. F. Li, J. Hu, X. Y. Li, H. Liu and W. Nie, Chin. J. Struct. Chem., 2013, 33, 277–283 Search PubMed.
- S. K. Ghosh and P. K. Bharadwaj, Inorg. Chem., 2004, 43, 5180–5182 CrossRef CAS PubMed.
- A. Majumder, V. Gramlich, G. M. Rosair, S. R. Batten, J. D. Masuda, M. S. El Fallah, J. Ribas, J. P. Sutter, C. Desplanches and S. Mitra, Cryst. Growth Des., 2006, 6, 2355–2368 CAS.
- Q. Shi, R. Cao, D. F. Sun, M. C. Hong and Y. C. Liang, Polyhedron, 2001, 20, 3287–3293 CrossRef CAS.
- D. E. Wang, K. J. Deng, K. L. Lv, C. G. Wang, L. L. Wen and D. F. Li, CrystEngComm, 2009, 11, 1442–1450 RSC.
- R. Su, R. Bechstein, J. Kibsgaard, R. T. Vang and F. Besenbacher, J. Mater. Chem., 2012, 22, 23755–23758 RSC.
- W. Kim, T. Tachikawa, H. Kim, N. Lakshminarasimhan, P. Murugan, H. Park, T. Majima and W. Choi, Appl. Catal., B, 2014, 147, 642–650 CrossRef CAS.
- Y. Yang, Y. Li, L. Zhu, H. He, L. Hu, J. Huang, F. Hu, B. He and Z. Ye, Nanoscale, 2013, 5, 10461–10471 RSC.
- L. Ai, C. Zhang, L. Li and J. Jiang, Appl. Catal., B, 2014, 148, 191–200 CrossRef.
- X. Chen and S. S. Mao, Chem. Rev., 2007, 107, 2891–2959 CrossRef CAS PubMed.
- D. X. Li, Z. G. Ren, D. J. Young and J. P. Lang, Eur. J. Inorg. Chem., 2015, 11, 1981–1988 CrossRef.
- X. X. Xu, Z. P. Cui, X. Gao and X. X. Liu, Dalton Trans., 2014, 43, 8805–8813 RSC.
- H. Yang, X. W. He, F. Wang, Y. Kang and J. Zhang, J. Mater. Chem. A, 2012, 22, 21849–21851 RSC.
- D. Qu, M. Zheng, L. Zhang, H. Zhao, Z. Xie, X. Jing, R. E. Haddad, H. Fan and Z. Sun, Sci. Rep., 2014, 4, 5924 Search PubMed.
- O. V. Dolomanov, L. J. Bourhis, R. J. Gildea, J. A. Howard and H. Puschmann, J. Appl. Crystallogr., 2009, 42, 339–341 CrossRef CAS.
- G. M. Sheldrick, Acta Crystallogr., Sect. A: Found. Crystallogr., 2008, 64, 112–122 CrossRef CAS PubMed.
- R. Cao, D. Sun, Y. Liang, M. Hong, K. Tatsumi and Q. Shi, Inorg. Chem., 2002, 41, 2087–2094 CrossRef CAS PubMed.
- G. Malandrino, S. T. Finocchiaro, P. Rossi, P. Dapporto and I. L. Fragalà, Chem. Commun., 2005, 45, 5681–5683 RSC.
- W. T. Xu, L. Ma, F. Ke, F. M. Peng, G. S. Xu, Y. H. Shen, J. F. Zhu, L. G. Qiu and Y. P. Yuan, Dalton Trans., 2014, 43, 3792–3798 RSC.
- T. Zhou, Y. Du, A. Borgna, J. Hong, Y. Wang, J. Han, W. Zhang and R. Xu, Energy Environ. Sci., 2013, 6, 3229–3234 CAS.
- A. M. Ebrahim, Doping of Metal Organic Framework (UiO) and for NO2 adsorption at ambient conditions, CUNY Academic Works, 2013 Search PubMed.
- K. Nagaveni, M. Hegde and G. Madras, J. Phys. Chem. B, 2004, 108, 20204–20212 CrossRef CAS.
- Y. Wu, H. Luo and H. Wang, RSC Adv., 2014, 4, 40435–40438 RSC.
- L. L. Gao, Y. Liu, X. Y. Lv, J. F. Liu and T. P. Hu, Int. J. Inorg. Chem., 2012, 291682 Search PubMed.
- B. Mu and K. S. Walton, J. Phys. Chem. C, 2011, 115, 22748–22754 CAS.
- C. Wang, H. Luo, Z. Zhang, Y. Wu, J. Zhang and S. Chen, J. Hazard. Mater., 2014, 268, 124–131 CrossRef CAS PubMed.
- X. Y. Peng, X. X. Liu, D. Diamond and K. T. Lau, Carbon, 2011, 49, 3488–3496 CrossRef CAS.
- A. S. Hall, A. Kondo, K. Maeda and T. E. Mallouk, J. Am. Chem. Soc., 2013, 135, 16276–16279 CrossRef CAS PubMed.
- D. Wang, J. Ye, T. Kako and T. Kimura, J. Phys. Chem. B, 2006, 110, 15824–15830 CrossRef CAS PubMed.
- J. Zhu, Z. Deng, F. Chen, J. Zhang, H. Chen, M. Anpo, J. Huang and L. Zhang, Appl. Catal., B, 2006, 62, 329–335 CrossRef CAS.
- J. Guo, J.-F. Ma, J.-J. Li, J. Yang and S.-X. Xing, Cryst. Growth Des., 2012, 12, 6074–6082 CAS.
- A. Fuerte, M. Hernández Alonso, A. Maira, A. Martinez Arias, M. Fernandez Garcia, J. Conesa and J. Soria, Chem. Commun., 2001, 24, 2718–2719 RSC.
- M. Yang, X. Huang, S. Yan, Z. Li, T. Yu and Z. Zou, Mater. Chem. Phys., 2010, 121, 506–510 CrossRef CAS.
- W. Q. Kan, B. Liu, J. Yang, Y. Y. Liu and J. F. Ma, Cryst. Growth Des., 2012, 12, 2288–2298 CAS.
- K. H. Leong, P. Monash, S. Ibrahim and P. Saravanan, Sol. Energy, 2014, 101, 321–332 CrossRef CAS.
- F. Wang, F. L. Li, M. M. Xu, H. Yu, J. G. Zhang, H. T. Xia and J. P. Lang, J. Mater. Chem. A, 2015, 3, 5908–5916 CAS.
- X. Wang, Y. Liu, C. Xu, Q. Guo, H. Hou and Y. Fan, Cryst. Growth Des., 2012, 12, 2435–2444 CAS.
- Q. Hua, Y. Zhao, G. C. Xu, M. S. Chen, Z. Su, K. Cai and W. Y. Sun, Cryst. Growth Des., 2010, 10, 2553–2562 CAS.
- L. L. Wen, F. Wang, J. Feng, K. L. Lv, C. G. Wang and D. F. Li, Cryst. Growth Des., 2009, 9, 3581–3589 CAS.
- J. Y. Zou, H. L. Gao, W. Shi, J. Z. Cui and P. Cheng, CrystEngComm, 2013, 15, 2682–2687 RSC.
- C. K. Xia, F. Wu, K. Yang, W. Sun, Y. Y. Min, Y. L. Wu and X. J. Lu, Polyhedron, 2016, 117, 637–643 CrossRef CAS.
- Y. Q. Chen, S. J. Liu, Y. W. Li, G. R. Li, K. H. He, Y. K. Qu, T. L. Hu and X. H. Bu, Cryst. Growth Des., 2012, 12, 5426–5431 CAS.
- R. A. Doong, C. H. Chen, R. Maithreepala and S. M. Chang, Water Res., 2001, 35, 2873–2880 CrossRef CAS PubMed.
- J. Theurich, M. Lindner and D. Bahnemann, Langmuir, 1996, 12, 6368–6376 CrossRef CAS.
- M. A. Ajeel, M. K. Aroua and W. M. A. W. Daud, Electrochim. Acta, 2015, 180, 22–28 CrossRef CAS.
- M. Barakat, H. Schaeffer, G. Hayes and S. Ismat Shah, Appl. Catal., B, 2005, 57, 23–30 CrossRef CAS.
- H. Lin, P. Liu, J. Zhang, X. Wang and G. Liu, J. Coord. Chem., 2013, 66, 612–623 CrossRef CAS.
Footnote |
| † Electronic supplementary information (ESI) available: Scherrer equation, Kubelka–MunK function, crystal data selected bond and angles of Cd-MOF, photoluminescence spectra of intercalated MOF, reusability of MOFs, XRD of MOFs after photoreaction, kinetics of photocatalysis reaction. See DOI: 10.1039/c7ra10034e |
| This journal is © The Royal Society of Chemistry 2017 |

