 Open Access Article
Creative Commons Attribution 3.0 Unported Licence
Ag–SnO2 nano-heterojunction–reduced graphene oxide by a stepwise photocatalyzed approach and its application in ractopamine determination†
Wenqiang Xieab,
Lele Tangab,
Meihui Yingab,
Junshao Liuac,
Haibo Pan *abc and
Min Duac
aFujian Key Lab of Medical Instrument & Pharmaceutical Technology, Fuzhou University, Qishan Campus, Fuzhou, Fujian 350116, P. R. China. E-mail: hbpan@fzu.edu.cn
bCollege of Chemistry, Fuzhou University, Fuzhou, Fujian 350116, P. R. China
cFujian Key Lab of Eco-Industrial Green Technology, Wuyi University, Wuyishan, Fujian 354300, P. R. China
First published on 28th November 2017
Abstract
Photocatalyzed synthesis by using SnO2 as a photocatalyst is a green and alternative approach. Here, a nanocomposite of SnO2–Ag nanoparticles (AgNPs) and reduced graphene oxide (RGO) was prepared by a stepwise photocatalyzed approach. HRTEM shows that SnO2 and AgNPs were attached along the lattice matching each other and both of them were anchored upon RGO. Under UV irradiation, photo-excited holes from SnO2 were scavenged by ethanol while electrons were accumulated at the side of SnO2, leading to the reduction of both graphene oxide (GO) and Ag+. Here, SnO2 and metal Ag formed a heterostructure, and RGO played the dual role of conductor and support. During UV irradiation, the (101) facet of SnO2 offered a preferential growth direction for the (111) facet of AgNPs with an interfacial angle of 118°, which can be attributed to their similar D-spacings. A unique morphology of a combination of two semi-spheres was established. The energy-band structure of the composite was characterized to understand its mechanism of electrocatalysis. Owing to the difference between their binding energy in the heterostructure, electrons in AgNPs are transferred into SnO2, inducing AgNPs with positive charge and facilitating the redox of ractopamine (RAC). Under the optimal experimental conditions, a linear relationship between the relative amperometric response to RAC ranges from 5.0 × 10⁻⁸ to 5.5 × 10⁻⁶ M while the lower limit of detection reaches 2 × 10⁻⁸ M (S/N = 3.0).
Introduction
Light is an environmentally friendly, green ideal catalyst for chemical synthesis,1 which allows the design of new chemical systems via solar energy.2 Photocatalyzed synthesis is thus a novel strategy of preparing organic compounds (e.g. C–C bonds)3 and modifying groups.4 Inspired by this process, tremendous efforts utilizing various metallic and organic catalysts that are capable of absorbing light and mediating chemical reactions have been made in the production of pharmaceuticals, fine chemicals and advanced materials. According to previous reports, benzo[b]phosphole oxides,5 substituted aromatic ketones6 and tris (2,2′-bipyridine) ruthenium(II)7 have been successfully synthesized under irradiation. There are lots of advantages, such as the large amount of energy involved and the mild conditions exhibited,8 which offer flexible manipulating conditions.Graphene, a two-dimensional material with high surface area (2630 m2 g−1) and remarkable electronic properties,9 provides potential applications to synthesize nanocomposites,10 biosensor platforms11 and ultrasensitive sensors.12 Graphene oxide (GO) and reduce graphene oxide (RGO, i.e., graphene)13 have been spotlighted and focused on in these studies. The low conductivity of GO restricts its further application so it is imperative to reduce GO to RGO. To date, most reduced processes applied are chemical and hydrothermal methods,14,15 which may lead to impurities or react incompletely.
Due to the excellent electrocatalytic abilities, noble metal nanoparticles were widely loaded on the surface of supports in order to design immunosensors or composites with new properties.16,17 Graphene sheets provide a large surface area for attaching other materials. Ag nanoparticles (AgNPs) can be highly dispersed onto graphene sheets to improve the conductivity, and the hybrids can also implement its ability better.18 However, similar to graphene, a reducing agent was generally required to form AgNPs from silver ion precursor.19 We anticipate that the use of photocatalyzed synthesis without an additional reductant would, after a photon absorption, reduce GO to RGO and Ag cations to AgNPs by using SnO2 as a photocatalyst.
Herein, we report a facile and efficient procedure for the fabrication of SnO2–AgNPs–RGO nanocomposites. As illustrated in the graphical abstract, the photocatalyzed synthesis was introduced to reduce monolayer graphene and form a nanocomposite of SnO2–AgNPs–RGO, where SnO2 nanoparticles as the photocatalyst reduced both GO and Ag+ under two-step UV irradiation, and the hydroxyl and carboxyl groups on the surfaces of the GO sheets help to adhere both SnO2 and AgNPs. This measure is expected to simplify the process of preparation, while decreasing the introduction of impurities. Moreover, based on the above advantages, the combination of the heterojunction (SnO2–AgNPs) and RGO shows charming characteristics in electrocatalysis.12,20 We thus apply it as an electrochemical sensor for efficient detection of ractopamine (RAC), which is widely used for farm livestock,21,22 but is banned internationally due to its damage to the central nervous system. Furthermore, we determine its mechanism of high electrocatalysis capacity toward RAC by investigating the energy-band structure of the heterojunction.
Experimental section
Materials
Graphite powder (99.95%, 325 mesh) was obtained from Alfa Aesar (Tianjin, China). SnO2 was a gift from the Institute of Research for Functional Materials, Fuzhou University (Fuzhou, China). RAC was purchased from Sigma-Aldrich (St. Louis, MO, USA). RAC stock solutions (1 mM) were prepared with ultra-pure water in all experiments. The working solutions were the stock solution diluted with phosphate buffer solution (PBS, 0.1 M, pH 7.2). All other chemicals (analytical reagent grade) were purchased from Beijing Chemical Reagent Company (Beijing, China) and used without further purification. Ultra-pure water was obtained from a Milli-Q plus water purification system (Millipore Co. Ltd., USA) (18 MΩ).Stepwise preparation of SnO2–AgNPs–RGO and RAC sensor
GO was produced from graphite powder by a modified Hummers' method.23 As-synthesized GO was suspended in ethanol to produce an aqueous solution of 0.17 mg mL−1. A stepwise reduction process was conducted to form a SnO2–AgNPs heterostructure. Firstly, 2 mL of SnO2 in ethanol suspension (6.5 mM, degassed) was mixed with 2 mL of an alcoholic solution of silver nitrate (13 mM, degassed). Subsequently, under the protection of nitrogen gas, the suspension was agitated and irradiated for 30 min through a 300 W xenon arc lamp. Next, sonicated and degassed GO was added to the newly synthesized SnO2–AgNPs suspension and then irradiated for 12 hours at room temperature in order to synthesize SnO2–AgNPs–RGO suspension.Prior to preparation of the sensor, a glassy carbon electrode (GCE) was polished to mirror smooth using a polishing cloth with 0.3 and 0.05 μm alumina powder. Then GCE was rinsed with deionized water, then ultrasonicated in deionized water and an ethanol bath, sequentially. 10 μL of SnO2–AgNPs–RGO was dropped on the surface of the working GCE and dried at room temperature. Thus, the modified GCE with a uniform film coating (SnO2–AgNPs–RGO/GCE) for detecting RAC was obtained.
Characterization and electrochemical measurements
The suspension in a capped quartz reactor was photo-irradiated with a xenon lamp (Model: PLS-SXE 300C, Perfect Light, China. Optical Filter, UVREF, λ = 200–400 nm). UV-vis measurements were conducted using a UV-1800 Shimadzu spectrophotometer. Scanning electron microscopy (SEM) and energy dispersive spectrometer (EDS) mapping were carried out using a Hitachi S4800 (Hitachi Company, Japan). High-resolution transmission electron microscope (HRTEM) images were obtained using a Tecnai G2 F20 S-TWIN, 200 kV (FEI Company, USA). The diffused reflectance spectrum (DRS) was analyzed by a Cary 500 Scan. Cyclic voltammetric (CV), Mott–Schottky (MS) and differential pulse voltammetry (DPV) plots were obtained using a CHI 660D electrochemical workstation (CH Instrument Company, Shanghai, China). A conventional three-electrode cell system was utilized with a modified GCE as the working electrode, Ag/AgCl (in saturated KCl) as the reference electrode, and a platinum wire as the counter electrode. CV and DPV measurements of the SnO2–AgNPs–RGO electrode were cycled in a corresponding PBS solution by applying voltage in the range between −0.4 and 0.6 V versus Ag/AgCl. The Mott–Schottky plot (MS) plot for SnO2 was deposited onto ITO-coated glass. All measurements were performed at room temperature.Results and discussion
Physicochemical characterization of SnO2–AgNPs–RGO
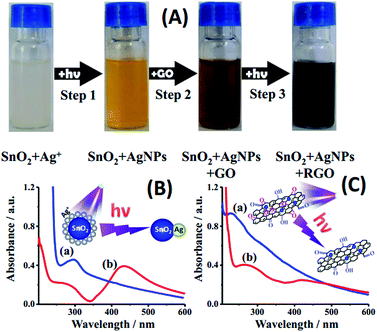
The color evolution of the suspension is shown in Fig. 1(A), which turned from milky white to light yellow via the first exposure in the presence of the SnO2 photocatalyst, and then from light brown to black via the second one. UV-vis spectra were utilized to identify the procedure of irradiation. The SnO2–Ag+ suspension before and after UV irradiation is depicted in Fig. 1(B). Only an absorption peak of SnO2 at 290 nm was observed before irradiation, which coincides with the earlier report.24 After 30 min of exposure to the xenon lamp (Fig. 1(A), step 1), the absorption peak at 290 nm decreases obviously, while a peak for AgNPs at 425 nm emerged. It illustrates that Ag+ had been successfully reduced (reaction 1, 2 & inset of Fig. 1(B)) onto the surface of SnO2, where photo-excited holes generated by SnO2 have been scavenged by ethanol, leaving photo-excited electrons to accumulate at the side of SnO2 (ref. 25) and thus reducing Ag+ cations into AgNPs. In this experiment, absence of H2O and O2 prevented the generation of ˙OH and ˙O2−, which would consume photo-excited electrons and decrease the reducing capacity. To illustrate the unique impact of photoelectrons in the process of photocatalyzed synthesis, the same suspension of SnO2–Ag+ was stood in darkness for 84 hours. The peak of AgNPs in 425 nm can hardly be observed in Fig. S1,† which confirms our previous design. By further irradiation (Fig. 1(A), step 3), GO was reduced into RGO (reaction 3 & inset of Fig. 1(C)), where the π network system of GO has been partial restored.26,27 Absorption peaks of SnO2–AgNPs–GO before and after irradiation exhibit in Fig. 1(C). Before irradiation, there are two characteristic peaks displayed in curve (a), one of them is at 231 nm, corresponding to π → π* transitions of aromatic C–C bonds, and the other is a shoulder at 300 nm, attributed to n → π* transitions of C![[double bond, length as m-dash]](https://www.rsc.org/images/entities/char_e001.gif) O bonds.28,29 The peak at 231 nm is bathochromically shifted to 270 nm and a new absorption peak at 425 nm is observed after irradiation. It shows that GO was reduced to RGO during the irradiation process. The reactions below illustrate the mechanism of the photocatalyzed synthesis.
O bonds.28,29 The peak at 231 nm is bathochromically shifted to 270 nm and a new absorption peak at 425 nm is observed after irradiation. It shows that GO was reduced to RGO during the irradiation process. The reactions below illustrate the mechanism of the photocatalyzed synthesis.| SnO2 + hν → SnO2 (h + e) → SnO2 (e) + ˙C2H4OH + H+ | (1) |
| SnO2 (e) + Ag+ → SnO2 + AgNPs | (2) |
| SnO2 (e) + GO → SnO2 + RGO | (3) |
The SnO2–AgNPs–RGO nanocomposite was characterized by electron microscopy. The scanning electron microscopy (SEM) image and the corresponding energy dispersive spectrometer (EDS) mapping of the composite containing SnO2 and AgNPs are shown in Fig. S2.† Abundant hydroxyl groups and carboxyl groups, introduced during GO preparation, on the surface of the RGO act as anchor sites for the SnO2–AgNPs nano-heterostructure. SnO2 and AgNPs keep the RGO sheets layer sufficiently exfoliated and the as-prepared Ag–SnO2 was evenly loaded on the surface of the RGO. This configuration maintained the characteristics of the individual RGO sheets.
Fig. 2 displays the high-resolution transmission electron microscope (HRTEM) images of the as-prepared SnO2–AgNPs–RGO at various magnifications. Nanoparticles combined with AgNPs and SnO2 attached to each other and formed a heterostructure, which was well-dispersed in the carbon matrix (RGO) with an average particle size of 30 nm (Fig. 2(A)). The dispersed small heterostructure upon the surface of the RGO prevented it from agglomerating and enhanced its stability for the hybrid nanocomposite. The XRD pattern of SnO2 is shown in Fig. S3,† where diffraction peaks of the (101) facet can be identified. We also observed the (101) facet of SnO2 in Fig. 2(B and C), which exhibited the lattice fringe of both AgNPs and SnO2. The D-spacing for the adjacent lattice planes of AgNPs and SnO2 is 0.23 and 0.26 nm, which corresponds to the (111) facet of AgNPs and the (101) facet of SnO2, respectively. The distinguished interface and the continuity of the lattice fringes between the AgNPs and SnO2 are shown in Fig. 2(B) and (C). Rather than growing at the surrounding of the SnO2 sphere, the Ag+ was reduced only at a side of the SnO2 sphere and evolved as two semi-spheres heterostructure. It can be attributed to the close distance between the single crystal SnO2 and AgNPs, signifying that the (101) direction for the former offers the (111) preferential growth direction for the latter. The interfacial angle between these two crystal planes is approximately equal to 118° and the short-distance mismatch, according to the macroscopic viewpoint, is relaxed in the atomic lattice arrangement by repeating itself along the boundary of the AgNPs and SnO2.30 Therefore, this kind of SnO2–AgNPs heterostructure can be formed harmoniously, and is stable in ambient air conditions. The presence of Ag and Sn in the as-prepared nanocomposite film is confirmed by EDS (Fig. 2(D)). It coincides with the stepwise reduction whereby Ag+ cations have been reduced to metallic AgNPs through the photocatalyzed process, where the SnO2 nanoparticles played the role of the photocatalyst. The detailed growth mechanism needs to be investigated in subsequent experiments.
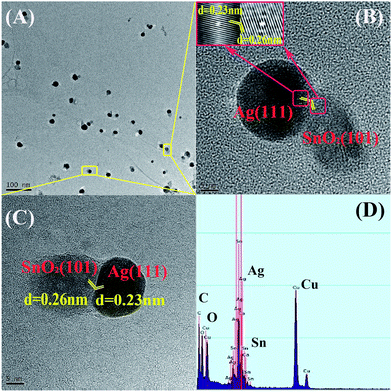 | ||
| Fig. 2 (A) HRTEM image of the SnO2–AgNPs–RGO nanocomposite. (B and C) The lattice fringes of the SnO2–AgNPs heterojunction. (D) EDS spectrum of the SnO2–AgNPs–RGO nanocomposite. | ||
Electrochemical characterization and its electrocatalytic mechanism
The electrocatalytic ability of the as-prepared nanocomposite toward RAC was explored. We employed differential pulse voltammetry (DPV) to identify it, which is advantageous for reaching higher sensitivity by eliminating the non-faradaic currents that occur in cyclic voltammetry.31 The electrochemical performances of bare GCE, SnO2, SnO2/RGO, AgNPs, SnO2–AgNPs, and SnO2–AgNPs–RGO in PBS buffer (pH = 7.2, scanning range from +0.2 to +0.8 V) with 5 μM RAC are shown in Fig. 3. Scarcely any response was obtained with the bare electrode (curve (a) of Fig. 3). Similarly, due to the low conductivity of the semiconductor, SnO2 exhibits inferior electrochemical activity towards RAC determination (curve (b)). Even though the introduction of the RGO in the SnO2 augmented the response signal, the amplification remains of a low standard and is thus limited for RAC detection (curve (c)). The signal of AgNPs/GCE (curve (d) of Fig. 3) implies that the AgNPs electrochemical performance has been largely restricted due to the lack of a co-catalyst, although it is an efficient electrocatalyst. However, the formation of SnO2–AgNPs (curve (e) of Fig. 3), a heterojunction based on their specific nature, has obviously augmented the response signal owing to its special structure. Moreover, the combination of the SnO2–AgNPs heterojunction and RGO further enhanced the catalytic capability of RAC; this conclusion was drawn from curve (f) of Fig. 3, where the SnO2–AgNPs–RGO-modified electrode exhibits a much higher current response than that of the SnO2–AgNPs heterojunction. CV tests of materials (Fig. S4†) in PBS (0.1 M, pH 7.2, 5 × 10⁻⁶ M RAC) correspond with these results. Moreover, the Nyquist plot in Fig. S5† shows that the hybrid-composite exhibits a comparable high conductivity.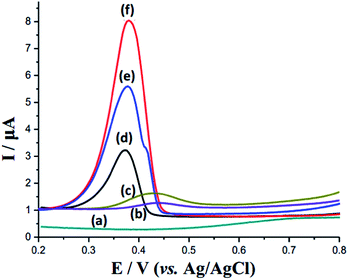 | ||
| Fig. 3 DPV of bare GCE (a), SnO2/GCE (b), SnO2/RGO/GCE (c), AgNPs/GCE (d), SnO2–AgNPs/GCE (e) and SnO2 AgNPs–RGO/GCE (f) containing RAC (5 × 10⁻⁶ M) in PBS (0.1 M, pH 7.2). | ||
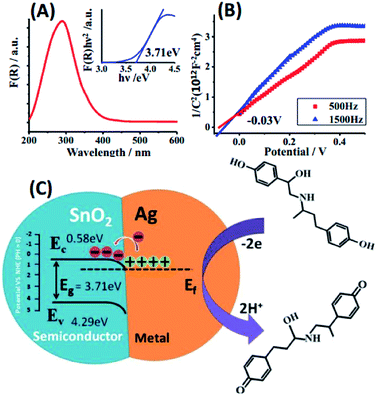
To investigate the electrocatalytic mechanism of the nanocomposite, the energy band structure and electric charge distribution of this heterojunction were analyzed by DRS (Fig. 4(A)) and Mott–Schottky (MS) plot (Fig. 4(B)). The band gap (Eg) of SnO2 is 3.71 eV, which is in agreement with previous reports.32 For n-type semiconductors, the flat-band potential is considered to be located just under the conduction band (Ec),33 hence Ec was estimated to be −0.03 V (vs. Ag/AgCl) or +0.58 V (vs. RHE), which is similar to values previously estimated from atomic electronegativities.34 The vacuum work function of SnO2 is higher than that of Ag,35,36 which induced a SnO2/AgNPs Schottky junction (Fig. 4(C)). Electrons in AgNPs are transferred into SnO2, inducing AgNPs with a positive charge and facilitating the redox of RAC. The oxidation process of RAC is illustrated in Fig. 5, where the peak of 247 nm (absorption peak of RAC) decreases apparently. Two electrons are involved in this process.37 Moreover, the metal–semiconductor heterojunction well-dispersed on RGO would result in a potentially high electrochemical activity due to its combination of the high conductivity of RGO and the catalytic activity of the heterojunction.
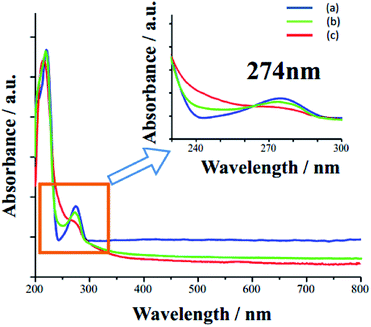 | ||
| Fig. 5 UV-vis spectra before (a) and after 200 times (b) and 500 times (c) of CV test with range from 0.4 to 1.0 V in PBS. | ||
Conditions optimization for the modified electrode and electrochemical detection of RAC
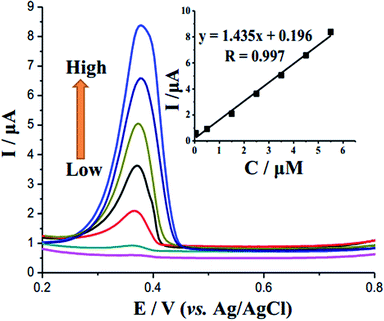
For the purpose of achieving a highly sensitive electrochemical sensor for RAC, the experimental conditions were optimized. Electrodeposition times of the SnO2–AgNPs–RGO-modified electrode were studied in Fig. S6,† and varied from 0 to 240 s with a potential of +0.2 V. The optimal accumulation time is 180 s. The accumulation potential of the peak current was assessed in the range from −0.2 to 0.3 V with a specific accumulation time (AT = 180 s); the best accumulation potential was found to be +0.2 V (Fig. S7†). The thickness of the electrode film was investigated from 8 to 12 μL, and the result found that the suitable thickness is 10 μL (Fig. S8†).The DPV curves in Fig. 6 show increasing oxidation peak current at approximately 0.38 V with RAC concentration. Calibration data were obtained for RAC solutions under the optimum experimental conditions described in the inset of Fig. 6, and the plot demonstrated linear behavior in the range of 5.0 × 10⁸–5.5 × 10⁻⁶ mol L−1 (R2 = 0.997) with a limit of detection of 2 × 10⁻⁸ mol L−1 (S/N = 3). This new sensing system exhibited sensitivity, linear range and detection limit comparable to those reported in the literature, as listed in Table 1.
We also tested the reproducibility of the SnO2–AgNPs–RGO-modified GCE electrode by performing repeated experiments with solutions containing 0.5 μM RAC. For 20 successive detecting, the relative standard deviation (RSD) was 2.37% for a given electrode. There was no apparent decrease in current response, which confirmed the high repeatability of this method. The stability of the SnO2–AgNPs–RGO-modified GCE was also studied by checking the current response at a fixed RAC concentration over a long period. After the SnO2–AgNPs–RGO/GCE was stored in the air for 7 days, the RSD of the oxidation response signal of RAC remained at 3.3%, indicating the excellent stability of the RAC sensor. In addition, the GCE must be renewed by scanning 20 consecutive cycles in blank PBS each time, owing to its strong adsorption of RAC. To evaluate the practical performance of this method in real samples, the SnO2–AgNPs–RGO/GCE sensor was applied to determine RAC in pork samples. The standard addition method was adopted.
Different concentrations of RAC were spiked into the sample and then analyzed under the same conditions. Each sample solution underwent three parallel detections, with RSD below 4% in all cases (Table 2), suggesting that the obtained results are acceptable. The recovery is in the range from 93.2% to 98.1%, revealing that this new method is accurate and feasible.
| Sample | Added (nM) | Average found (n = 5, nM) | Average recovery (n = 5, %) | RSD (%) |
|---|---|---|---|---|
| 1 | 60 | 55.89 | 93.2 | 4.6 |
| 2 | 100 | 95.56 | 95.6 | 4.1 |
| 3 | 140 | 137.29 | 98.1 | 3.7 |
Conclusions
A stepwise photocatalyzed synthesis has been proposed in this work to prepare SnO2–AgNPs–RGO nanocomposite. SnO2 nanoparticles played an important role in this process, acting both as a photocatalyst and an anchor agent to form this nanocomposite. Under UV irradiation, the (101) facet of SnO2 offers a preferential growth direction for the (111) facet of AgNPs, forming a specific morphology, i.e., a combination of two semi-spheres. The nanocomposite was used to build a sensing platform for nonenzymatic detection of RAC. Research on the energy-band structure of the composite illustrated that electrons in the AgNPs are transferred into SnO2 due to the difference in the binding energy of the heterostructure, inducing AgNPs with a positive charge and facilitating the redox of RAC. These results indicated that the sensor exhibited excellent electrocatalytic activity towards the oxidation of RAC with a broad linear range and a low detection limit.Conflicts of interest
There are no conflicts to declare.Acknowledgements
This work was supported by the National Natural Science Foundation of China (No. 21201035), the project of Fujian Provincial Commission of Economy and Information Technology (Minjingxinjicai [2015]567), the Natural Science Foundation of Fujian Province (No. 2016J01222), Scientific Term of Education Department of Fujian Province (JAT170593), and the Open Project of Wuyi University (WYKF2017-1).Notes and references
- T. P. Yoon, M. A. Ischay and J. Du, Nat. Chem., 2010, 2, 527–532 CrossRef CAS PubMed.
- S. Choudhury, J.-O. Baeg, N.-J. Park and R. K. Yadav, Green Chem., 2014, 16, 4389–4400 RSC.
- M. Fagnoni, D. Dondi, D. Ravelli and A. Albini, Chem. Rev., 2007, 107, 2725–2756 CrossRef CAS PubMed.
- L. Jia, G. P. Mane, C. Anand, D. S. Dhawale, Q. Ji, K. Ariga and A. Vinu, Chem. Commun., 2012, 48, 9029–9031 RSC.
- V. Quint, F. Morlet-Savary, J. F. Lohier, J. Lalevée, A. C. Gaumont and S. Lakhdar, J. Am. Chem. Soc., 2016, 138, 7436–7441 CrossRef CAS PubMed.
- D. Ravelli, M. Zema, M. Mella, M. Fagnoni and A. Albini, Org. Biomol. Chem., 2010, 8, 4158–4164 CAS.
- C. K. Prier, D. A. Rankic and D. W. C. MacMillan, Chem. Rev., 2013, 113, 5322–5363 CrossRef CAS PubMed.
- A. Albini, in Photochemistry, ed. E. Fasani, Royal Society of Chemistry, 2016, pp. 205–225 Search PubMed.
- L. Zhang, S. Diao, Y. Nie, K. Yan, N. Liu, B. Dai, Q. Xie, A. Reina, J. Kong and Z. Liu, J. Am. Chem. Soc., 2011, 133, 2706–2713 CrossRef CAS PubMed.
- X. Li, S. Yu, T. Yan, Y. Zhang, B. Du, D. Wu and Q. Wei, Biosens. Bioelectron., 2017, 89, 1020–1025 CrossRef CAS PubMed.
- X. Li, Y. Wang, L. Shi, H. Ma, Y. Zhang, B. Du, D. Wu and Q. Wei, Biosens. Bioelectron., 2017, 96, 113–120 CrossRef CAS PubMed.
- X. Wang, R. Xu, X. Sun, Y. Wang, X. Ren, B. Du, D. Wu and Q. Wei, Biosens. Bioelectron., 2017, 96, 239–245 CrossRef CAS PubMed.
- S. Liu, T. H. Zeng, M. Hofmann, E. Burcombe, J. Wei, R. Jiang, J. Kong and Y. Chen, ACS Nano, 2011, 5, 6971–6980 CrossRef CAS PubMed.
- A. Alazmi, O. El Tall, S. Rasul, M. N. Hedhili, S. P. Patole and P. M. F. J. Costa, Nanoscale, 2016, 8, 17782–17787 RSC.
- M. Jana, J. S. Kumar, P. Khanra, P. Samanta, H. Koo, N. C. Murmu and T. Kuila, J. Power Sources, 2016, 303, 222–233 CrossRef CAS.
- X. Ren, J. Yan, D. Wu, Q. Wei and Y. Wan, ACS Sens., 2017, 2, 1267–1271 CrossRef CAS PubMed.
- H. Wang, J. Shen, G. Cao, Z. Gai, K. Hong, P. R. Debata, P. Banerjee and S. Zhou, J. Mater. Chem. B, 2013, 1, 6225–6234 RSC.
- Y. Li, P. Zhang, Z. Ouyang, M. Zhang, Z. Lin, J. Li, Z. Su and G. Wei, Adv. Funct. Mater., 2016, 26, 2122–2134 CrossRef CAS.
- Z. L. Xu, Y. Lei, W. J. Yin, Y. X. Chen, Q. F. Ke, Y. P. Guo, C. Q. Zhang, A. Kakinen, T. Titma, M. Heinlaan, M. Visnapuu, D. Koller, V. Kisand and A. Kahru, J. Mater. Chem. B, 2016, 4, 7919–7928 RSC.
- Q. Han, R. Wang, B. Xing, T. Zhang, M. S. Khan, D. Wu and Q. Wei, Biosens. Bioelectron., 2018, 99, 493–499 CrossRef CAS PubMed.
- D. B. Anderson, E. L. Veenhuizen, J. F. Wagner, M. I. Wray and D. H. Mowrey, J. Dairy Sci., 1989, 67, 222 Search PubMed.
- L. E. Watkins, D. J. Jones, D. H. Mowrey, D. B. Anderson and E. L. Veenhuizen, J. Anim. Sci., 1990, 68, 3588–3595 CrossRef CAS PubMed.
- B. G. Choi, H. Park, T. J. Park, M. H. Yang, J. S. Kim, S. Y. Jang, N. S. Heo, S. Y. Lee, J. Kong and W. H. Hong, ACS Nano, 2010, 4, 2910–2918 CrossRef CAS PubMed.
- K. Ohkubo, Y. Kawashima, H. Sakai, T. Hasobe and S. Fukuzumi, Chem. Commun., 2013, 49, 4474–4476 RSC.
- G. Williams, B. Seger and P. V. Kamt, ACS Nano, 2008, 2, 1487–1491 CrossRef CAS PubMed.
- N. A. Kotov, I. Dékány and J. H. Fendler, Adv. Mater., 1996, 8, 637–641 CrossRef CAS.
- H. A. Becerril, J. Mao, Z. Liu, R. M. Stoltenberg, Z. Bao and Y. Chen, ACS Nano, 2008, 2, 463–470 CrossRef CAS PubMed.
- L. Baptista-Pires, B. Pérez-López, C. C. Mayorga-Martinez, E. Morales-Narváez, N. Domingo, M. J. Esplandiu, F. Alzina, C. M. S. Torres and A. Merkoçi, Biosens. Bioelectron., 2014, 61, 655–662 CrossRef CAS PubMed.
- J. D. Mangadlao, C. M. Santos, M. J. L. Felipe, a C. C. de Leon, D. F. Rodrigues and R. C. Advincula, Chem. Commun., 2015, 51, 2886–2889 RSC.
- X. Fan, M. L. Zhang, I. Shafiq, W. J. Zhang, C. S. Lee and S. T. Lee, Adv. Mater., 2009, 21, 2393–2396 CrossRef CAS.
- J. Jiang and X. Du, Nanoscale, 2014, 6, 11303–11309 RSC.
- L. Shi and H. Lin, Langmuir, 2011, 27, 3977–3981 CrossRef CAS PubMed.
- T. Sahm, A. Gurlo, N. Bârsan and U. Weimar, Sens. Actuators, B, 2006, 118, 78–83 CrossRef CAS.
- F. Fabregat-Santiago, G. Garcia-Belmonte, J. Bisquert, P. Bogdanoff and A. Zaban, J. Electrochem. Soc., 2003, 150, 293–298 CrossRef.
- R. G. Gordon, MRS Bull., 2000, 25, 52–57 CrossRef CAS.
- U. Hoefer, J. Frank and M. Fleischer, Sens. Actuators, B, 2001, 78, 6–11 CrossRef CAS.
- Y. Ni, Y. Wang and S. Kokot, Electroanalysis, 2010, 22, 2216–2224 CrossRef CAS.
- L. J. Kong, M. F. Pan, G. Z. Fang, K. Qian and S. Wang, Anal. Bioanal. Chem., 2012, 404, 1653–1660 CrossRef CAS PubMed.
- Z. Liu, Y. Zhou, Y. Wang, Q. Cheng and K. Wu, Electrochim. Acta, 2012, 74, 139–144 CrossRef CAS.
- C. Wu, D. Sun, Q. Li and K. Wu, Sens. Actuators, B, 2012, 168, 178–184 CrossRef CAS.
- L. J. Kong, M. F. Pan, G. Z. Fang, X. L. He, Y. K. Yang, J. Dai and S. Wang, Biosens. Bioelectron., 2014, 51, 286–292 CrossRef CAS PubMed.
- X. Yang, B. Feng, P. Yang, Y. Ding, Y. Chen and J. Fei, Food Chem., 2014, 145, 619–624 CrossRef CAS PubMed.
- L. He, Y. Su, Z. Zeng, Y. Liu and X. Huang, Anim. Feed Sci. Technol., 2007, 132, 316–323 CrossRef CAS.
Footnote |
| † Electronic supplementary information (ESI) available. See DOI: 10.1039/c7ra10504e |
| This journal is © The Royal Society of Chemistry 2017 |

