 Open Access Article
Creative Commons Attribution 3.0 Unported Licence
One-step synthesis and upconversion luminescence properties of hierarchical In2O3:Yb3+,Er3+ nanorod flowers†
Yinhua Wang,
Yongsheng Zhu *,
Xiumei Xu
 ,
Jinshu Huang,
Zhiwen Lu and
Dongfang Qiu*
College of Physics and Electronic Engineering, College of Chemistry and Pharmaceutical Engineering, Nanyang Normal University, Nanyang 473061, China. E-mail: yongshengzhu0001@163.com; qiudf2008@163.com
First published on 29th November 2017
Abstract
In2O3:Yb3+,Er3+ nanorod flowers (NRFs) are prepared by a simple hydrothermal method, where sucrose was used as a ligand. The obtained In2O3:Yb3+,Er3+ NRFs were carefully characterized by scanning electron microscopy (SEM), power X-ray diffraction (XRD), transmission electron microscopy (TEM) and steady/transient spectroscopy. The dependence of the upconversion luminescence (UCL) of In2O3:Yb3+,Er3+ NRFs on morphology, Yb3+ concentration and excitation power was carefully discussed. It is found that the luminescence intensity ratio of the red emission to green emission (R/G) depended on the morphology and Yb3+ concentration, and the green emissions are dominantly resulting from a three-photon populating process with higher Yb3+ doping concentration. More importantly, the concentration quenching in the In2O3:Yb3+,Er3+ NRFs was greatly suppressed due to boundary effects, and is beneficial for lighting and photon energy conversion devices.
1. Introduction
Since the concept of upconversion (UC) was proposed by Auzel in 1966, upconversion nanoparticles (UCNPs) have attracted considerable attention in many fields owing to their fascinating features, because of their ability of successive absorption of several low-frequency near infrared photons and generation of one ultraviolet or visible photon.1–3 Furthermore, researchers found many superior advantages of UCNPs, such as multicolor emission, long lifetimes, low autofluorescence background and superior photo-stability, as well as high penetration depth, and they are widely applied in lasers, solar cells, displays, biosensors and bioimaging.4–10 The inorganic host is the carrier of UC and it is very important for improving the efficiency of UCL, which is affected by the morphology of UCNPs. So far, many works have been performed to synthesize different shapes of UC nanocrystals (NCs).11–16Cubic sesquioxide In2O3 is recognized as one of the promising host materials for both up-/down-conversion luminescence through rare earth doping.17–19 At present, the controllable preparation of high effective UCL of rare earth (RE) doped In2O3 NCs is still difficult. Several strategies have been proposed to solve these problems. For example, Chen's group synthesized Er3+ ions doped cubic In2O3 nanoparticles via a simple solvothermal method, and firstly demonstrated its UC and downconversion emissions under 808 and 980 nm excitation, respectively.20 Xu et al. successfully fabricated In2O3:RE nanotubes by the electrospinning method for the first time, and the sensitivity of In2O3 nanotubes to H2S were significantly improved due to the RE ions doping.21 Dutta's group also prepared Eu/Dy doped In2O3 nanoparticles by a sonochemical technique. Relatively weak Eu3+ emission could be detected in In2O3:Eu nanoparticles, which is attributed to the distorted environment around the Eu ions in the In2O3 lattice.22 So far, although a few works on In2O3:RE nanoparticles have been performed, the mechanism of UC processes of In2O3 NCs doped with Yb3+, Er3+ ions is not fully understood. Especially, the dependence of UCL on cross relaxation, population processes, excitation power density and RE doping concentration are not clear. Therefore, it is necessary to detailedly investigate the UCL property of In2O3:Yb3+,Er3+ NCs.
In this article, we prepared In2O3:Yb3+,Er3+ hierarchical NRFs by a facile hydrothermal method using sucrose as surfactant.23 The formation, morphology and structure of the In2O3:Yb3+,Er3+ NRFs were examined by SEM, TEM, and XRD. And the influence of sucrose on the hydrothermally prepared In2O3:Yb3+,Er3+ NRFs is further elucidated. The investigation of UCL property of the In2O3:Yb3+,Er3+ NRF demonstrated that the UCL intensity and R/G ratios depended on particle size, excitation power and Yb3+ concentration. The as-obtained In2O3:Yb3+,Er3+ NRFs exhibited a high effective UC emission, which is a promising candidate for display and solar cells.
2. Experimental section
2.1 Synthesis In2O3 nanorods flowers
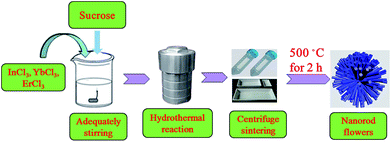
All the reagents (analytical-grade purity) were used without any further purification. In the preparation of (10 mol%)Yb3+, (1 mol%)Er3+ co-doped In2O3 NCs, InCl3·4.5H2O (266 mg), YbCl3·6H2O (33 mg), ErCl3·6H2O (3 mg), urea (15 mg) and moderate sucrose (342 mg) were dissolved in deionized water (36 mL) with adequately stirring for 30 min. In this reaction, sucrose acts as a template and linker to bind the nanoparticles, which leads to the formation of flower-like nanostructures. The presence of both sucrose and urea is a prerequisite for the formation of this porous hierarchical In2O3. Then, a Teflon-lined stainless steel autoclave was used for placed for the mixture solution and placed in 160 °C oven for 12 h. After the autoclave was cooled to room temperature naturally, the result product was obtained through centrifuging the result product using deionized water and ethanol for three times, and then dried at 80 °C for 1 day. In2O3:Yb3+,Er3+ NCs were obtained through calcining the precursor at 500 °C for 2 h. The same route is adopted for the preparation of (10 mol%)Yb3+ and xEr3+ (x = 2, 3, 5, 8 mol%) doped In2O3 NCs. The preparation process of In2O3:Yb3+,Er3+ NRFs is presented in Scheme 1.2.2 Characterization and measurements
The SEM images were obtained on a JEOL JSM-7500F microscope operating at 15 kV. The TEM, HR-TEM and selected-area electron diffraction (SAED) images were measured on a JEOL JEM-2100 microscope operated at 200 kV. The XRD pattern was recorded on a Rigaku D/max-rA power diffractometer. The UC emission spectra and dynamics of rare earth ions were measured on an Edinburgh fluorescence spectrometer (FLS980).3. Results and discussion
3.1 Morphology and structure characterization of In2O3:Yb3+,Er3+ NRFs
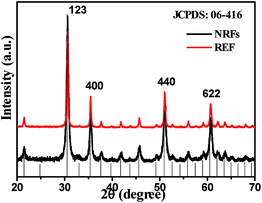
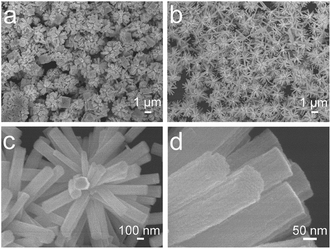
Fig. 1 shows the XRD patterns of the calcining In2O3:Yb3+,Er3+ products and the corresponding reference samples (REF). It can be seen that the products are the pure cubic structure according to JCPDS card no. 06-416. With space group Ia![[3 with combining macron]](https://www.rsc.org/images/entities/char_0033_0304.gif) (no. 206) and lattice parameters of a = 10.118 Å. No diffraction peaks from any other impurities were observed, indicating the high purity of the products. From the Debye–Scherer formula calculating, the average crystallite size of In2O3 is ∼15 nm. Fig. 2 shows the SEM images of In2O3:Yb3+,Er3+ NCs with varying amount of sucrose. In the absence of sucrose, the product is the mixture of irregular nanocubes and flower-like nanostructures (Fig. 2a), as the reference (REF) samples. When the moderate sucrose is added, the NRFs were appeared. Fig. 2b shows the low magnification SEM image of In2O3:Yb3+,Er3+ NRFs, demonstrated that the NRFs are high uniformity. The enlarged-magnification SEM images are presented in Fig. 2c and d, and we can see that each nanorod is uniform. Fig. 3 records the elaborate structural analysis of samples using TEM. In Fig. 3a, it can be seen that each nanorod of NRFs is homogenous, and the size of these nanorods is ∼100 nm in diameter and ∼1 μm in length (Fig. 3b). From the TEM images, we can deduce that the NRFs are self-assembled by many single nanorods. The inter-planar spacing is ∼0.292 nm through measuring the lattice fringes (Fig. 3c), matching with the distance of the (2 2 2) plane of the cubic In2O3 crystal. The SAED pattern of the In2O3:Yb3+,Er3+ NRFs (Fig. 3d) confirms that the obtained products are polycrystalline in structure. In order to further determine the structure and dopant concentrations of In2O3:Yb3+,Er3+ NRFs, the energy-dispersive X-ray (EDX) analysis of In2O3:(10 mol%)Yb3+,(2 mol%)Er3+ NRFs is measured in Fig. S1.† It shows the presence of In, Yb, Er and O element. Furthermore, the spectrum confirms that the mole ratio of Yb and Er in the NRFs is 8.47 and 1.7, respectively. According to this measuring result, we can deduce that the exact doping concentration of Er3+ ions is 0.85 mol%, 2.55 mol%, 4.24 mol%, 6.79 mol% in In2O3:(10 mol%)Yb3+,xEr3+ (x = 1, 3, 5, 8 mol%) NRFs.
(no. 206) and lattice parameters of a = 10.118 Å. No diffraction peaks from any other impurities were observed, indicating the high purity of the products. From the Debye–Scherer formula calculating, the average crystallite size of In2O3 is ∼15 nm. Fig. 2 shows the SEM images of In2O3:Yb3+,Er3+ NCs with varying amount of sucrose. In the absence of sucrose, the product is the mixture of irregular nanocubes and flower-like nanostructures (Fig. 2a), as the reference (REF) samples. When the moderate sucrose is added, the NRFs were appeared. Fig. 2b shows the low magnification SEM image of In2O3:Yb3+,Er3+ NRFs, demonstrated that the NRFs are high uniformity. The enlarged-magnification SEM images are presented in Fig. 2c and d, and we can see that each nanorod is uniform. Fig. 3 records the elaborate structural analysis of samples using TEM. In Fig. 3a, it can be seen that each nanorod of NRFs is homogenous, and the size of these nanorods is ∼100 nm in diameter and ∼1 μm in length (Fig. 3b). From the TEM images, we can deduce that the NRFs are self-assembled by many single nanorods. The inter-planar spacing is ∼0.292 nm through measuring the lattice fringes (Fig. 3c), matching with the distance of the (2 2 2) plane of the cubic In2O3 crystal. The SAED pattern of the In2O3:Yb3+,Er3+ NRFs (Fig. 3d) confirms that the obtained products are polycrystalline in structure. In order to further determine the structure and dopant concentrations of In2O3:Yb3+,Er3+ NRFs, the energy-dispersive X-ray (EDX) analysis of In2O3:(10 mol%)Yb3+,(2 mol%)Er3+ NRFs is measured in Fig. S1.† It shows the presence of In, Yb, Er and O element. Furthermore, the spectrum confirms that the mole ratio of Yb and Er in the NRFs is 8.47 and 1.7, respectively. According to this measuring result, we can deduce that the exact doping concentration of Er3+ ions is 0.85 mol%, 2.55 mol%, 4.24 mol%, 6.79 mol% in In2O3:(10 mol%)Yb3+,xEr3+ (x = 1, 3, 5, 8 mol%) NRFs.
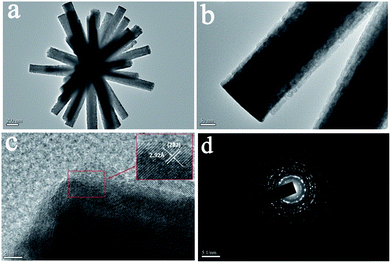 | ||
| Fig. 3 Typical TEM images of In2O3:Yb3+,Er3+ NRFs (a) and single nanorod (b), HR-TEM image of In2O3:Yb3+,Er3+ NRFs (c), the corresponding SAED pattern (d). | ||
3.2 Effect of morphology, Yb3+ concentration and excitation power on UCL
The typical UCL spectra of In2O3:Yb3+,(1 mol%)Er3+ REF and NRFs samples were investigated (Fig. 4). In the two samples, the 4F3/2–4I15/2 (blue), 2H11/2, 4S3/2–4I15/2 (green) and 4F9/2–4I15/2 (red) transitions can be clearly identified. The intensity ratio of the red (4F9/2–4I15/2) emission to the green (2H11/2, 4S3/2–4I15/2) emissions (R/G) in In2O3:Yb3+,Er3+ NRFs is higher than that in REF sample. The UCL property could be influenced by the following three factors: the nanocrystal size, crystallinity, and morphology. From the XRD and SEM analysis, we can deduce that the crystallinity and the size of In2O3:Yb3+,Er3+ NRFs and REF samples are both nearly same, indicating that the effect of the size and crystallinity might not be the dominant reason to the change of R/G ratio. The remarkable change in the R/G ratio between In2O3:Yb3+,Er3+ NRFs and REF samples could be attributed to the change of morphology. The In2O3:Yb3+,Er3+ NRFs constituted with dispersive nanorods has a large specific surface area, which introduced more surface ligands and surface defects. These groups and defects can bridge some non-radiative relaxation channels, such as 4I13/2–4I11/2 and 4S3/2–4F9/2, favoring the generation of the 4F9/2–4I15/2 red emission. In order to verify the conclusion, the In2O3:(10 mol%)Yb3+,(1 mol%)Er3+ power was prepared by the sol–gel method, the UCL spectra of In2O3:Yb3+,Er3+ power (the size > 10 μm) was measured under 980 nm excitation, shown in Fig. S2.† We can find that the R/G in the power is also dramatically lower than that in In2O3:Yb3+,Er3+ NRFs. The integral intensity of UCL for In2O3:Yb3+,Er3+ NRFs is lower than REF sample. Then the UCL intensity of In2O3:Yb3+,Er3+ NRFs exceeds REF samples with further increase the doping concentration of Er3+ (shown in the insert of Fig. 4). This phenomenon is known as concentration quenching and quite common in RE-doping NCs, which is due to an energy migration process among the same type of RE ions.24 In In2O3:Yb3+,Er3+ NRFs, the nanorod is only ∼100 nm and dispersive each other, which can be clearly recognized by HR-TEM images (as shown in Fig. 3). The boundary effects in other traditional NCs would be unavoidably occurred. For example, in the Y2O3:Eu3+,Y2SiO5:Eu3+, and LaPO4:Ce3+,Tb3+ inverse opal photonic crystals,25–27 the quenching concentration of the RE emission increases more than relative to the corresponding bulk phosphors. In other words, the concentration quenching was suppressed considerably due to the boundary effects.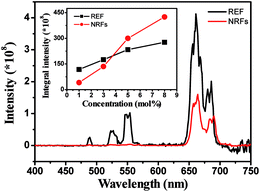 | ||
| Fig. 4 Emission spectra of In2O3:Yb3+,Er3+ in REF and NRFs under 980 nm excitation. Insert: dependence of integral intensity on Er3+ ions concentration of In2O3:Yb3+,Er3+ REF and NRFs. | ||
To further understand the UCL mechanism, the UCL dynamics of 4F9/2–4I15/2 transition of In2O3:Yb3+,(1 mol%)Er3+ REF and NRFs were measured (Fig. 5), and all the decay curves of Er3+ ions were fitted by the double-exponential function.28 From the lifetime constants, we can concluded that: (1) in the lower doped concentration of Er3+ ions, the lifetimes in REF samples are longer than that in In2O3:Yb3+,Er3+ NRFs. As we known, the decay time constant is the reverse of the non-radiative and radiative decay rates. The non-radiative decay rate is significantly affected by the large phonon groups in the surface, crystal phase, lattice defect state and phonon energy. In In2O3:Yb3+,Er3+ NRFs, the non-radiative channels nearby Er3+ ions, such as lattice defect states/surface large phonon bands would be increased due to the increasing of the volume to surface ratio.29 (2) In the In2O3:Yb3+,Er3+ NRFs, the lifetime constants decrease gradually with the increasing of Er3+ concentration compared to those of REF samples (as shown in the insert of Fig. 5), implying that the concentration quenching in the NRFs are suppressed. In the traditional In2O3:Yb3+,Er3+ phosphors, the long-range resonant energy transfer (ET) processes among Er3+ ions are very severe. Inevitably, luminescent quenching could occur because of the ET from Er3+ ions to defect states, which is dependent on doped concentrations. In the In2O3:Yb3+,Er3+ NRFs, these ET process should be restrained largely due to the structure of NRFs, because the size of each nanorod is ∼100 nm and the nanorods are dispersive. In this case, the ET among Er3+ ions can only happen within one nanorod, then, the photons will be scattered into the air instead of capturing by the defect states.
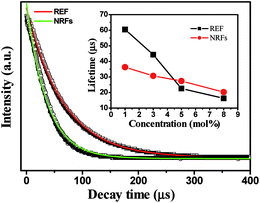 | ||
| Fig. 5 The luminescent decay dynamics of the 4F9/2–4I15/2 transition at 660 nm in In2O3:Yb3+,Er3+ REF and NRFs. Insert: dependence of lifetimes on Er3+ concentration of In2O3:Yb3+,Er3+ REF and NRFs. | ||
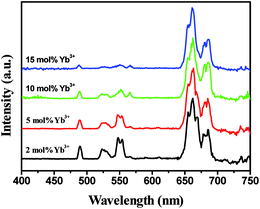
Fig. 6 shows the Yb3+ concentration dependent UCL spectra of the In2O3:Yb3+,Er3+ NRFs. From the spectra analysis of Fig. 6, the integral intensity of red emission gradually increased, whereas that of green emissions diminished gradually as the Yb3+ concentration increases. The emission spectra of the In2O3:Yb3+,Er3+ NRFs at different excitation powers were also measured (Fig. 7). We can found that the red emission is dominant in the low excitation power, and the R/G ratio is as high as ∼35 when the excitation power is 330 mW. The blue and green emissions increased gradually with increasing of excitation power. The R/G ratio versus excitation power is shown in the insert of Fig. 7, it is clear seen that the R/G ratios decreased with increasing of excitation power.
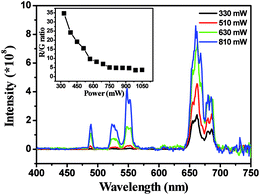 | ||
| Fig. 7 Power-dependent UC emission spectra of In2O3:(15 mol%)Yb3+,(1 mol%)Er3+ NRFs under 980 nm excitation. Insert: the R/G ratios of In2O3:Yb3+,Er3+ NRFs versus excitation power. | ||
The ln–ln plots of the integral intensity versus excitation power for the red and green emissions of In2O3:(15 mol%)Yb3+,xEr3+ (x = 1, 3, 5, 8 mol%) NRFs are investigated (Fig. 8). As is well known, the visible output power intensity (IV) will be proportional to power (n) of the infrared excitation (IIR) power if the saturation effect can be neglected:30 IV ∝ IIRn, where n is the number of IR photons absorbed per visible photon emitted. The slopes n are determined to be 2.68, 2.62, 2.65, 2.4 for 2H11/2–4I15/2 transition, 2.87, 2.62, 2.73, 2.02 for 4S3/2–4I15/2 transition and 1.17, 1.71, 1.79, 1.86 for 4F9/2–4I15/2 transition in the In2O3:Yb3+,Er3+ NRFs at different Er3+ ions concentration of 1 mol%, 3 mol%, 5 mol% and 8 mol%, respectively. We can see that the slopes n are >2 for the green emissions and >1 for the red emission of Er3+. Thus the 2H11/2/4S3/2 levels are populating through three photons processes, and the 4F9/2 level is populating through two-photons ET processes for all the In2O3:Yb3+,Er3+ NRFs. As far as we know, the three-photon populating phenomenon for the 2H11/2/4S3/2 levels is few reported in Er3+/Yb3+ codoped materials.
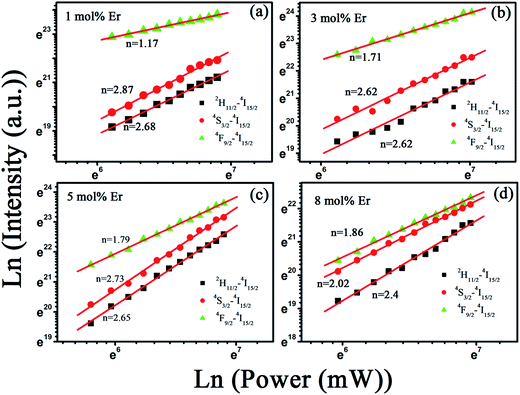 | ||
| Fig. 8 Plot (ln–ln) of emission intensity versus excitation power in In2O3:(15 mol%)Yb3+,(1 mol%)Er3+ NRFs prepared at different concentration of Er3+ ions. | ||
3.3 The mechanisms of UC population and luminescence processes in In2O3:Yb3+,Er3+ NRFs
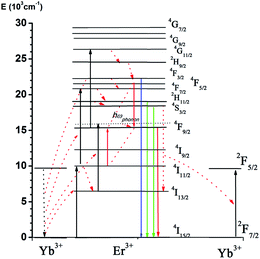
The population mechanisms of 4S3/2 and 4F9/2 levels in In2O3:Yb3+,Er3+ NRFs are quite different to other UC nanocrystals from the above analysis. Fig. 9 presents UC population and emission diagram of the Er3+/Yb3+ doping system under 980 nm excitation. The 4I11/2 level is populated by the electrons on the ground state 4I15/2 via ET of neighboring Yb3+ ions. Subsequently, the 4I13/2 level is populating through the non-radiative relaxation process of 4I11/2–4I13/2 via the assistance of large phonon groups, which is widely existed in NCs prepared via the hydrothermal method.31 In the second-step, the UC population of 4I11/2–4F7/2 and 4I13/2–4F9/2 occurred via ET and excited-state absorption, generating the red emission (4F9/2–4I15/2). The cross relaxation of 4F7/2 + 4I11/2 − 4F9/2 + 4F9/2 is significant for populating the 4F9/2 level, when the excitation power or the Yb3+ concentration is sufficiently high. Then the Yb3+ concentration is lower in In2O3:Yb3+,Er3+ NRFs, the electrons in 4F7/2 level is also populating 2H11/2/4S3/2 levels through non-radiative relaxation, generating 2H11/2, 4S3/2–4I15/2 transitions. For populating 4S3/2/2H11/2 levels, the non-radiative relaxation of 4I11/2–4I13/2 is involved. The energy gap (ΔE) is ∼3700 cm−1 between 4I11/2 and 4I13/2 level. For the bulk host, the phonon energy (hω) is ∼580 cm−1,32 the matching of non-radiative relaxation of 4I11/2–4I13/2 requires at least seven host phonons, so this process is hardly happened. In In2O3:Yb3+,Er3+ NRFs prepared by the hydrothermal method, the large phonon groups are involved due to surfactant or surface defects, so the non-radiative relaxation of 4I11/2–4I13/2 can be bridged more effectively via the assistance of the large phonon group than the non-radiative relaxation of 4I13/2–4I15/2. Therefore, the linear decay is dominant for the 4I11/2 level, because the effective non-radiative relaxation of 4I11/2–4I13/2 increases the linear decay processes, which leads the population of 4I13/2–4F9/2 to be more effective. This is a main reason for increasing the R/G ratio in In2O3:Yb3+,Er3+ NRFs.The relation of R/G ratio and Yb3+ concentration can be explained below, the population of 4F9/2 level is mainly originated from ET upconversion processes. The ET transfer from Yb3+ ions to Er3+ ions could be increased with the increase of Yb3+ concentration, thus the red emission (4F9/2–4I15/2) was accelerated because of an increase of the ET process. The quenching of green emission with the increasing Yb3+ concentration is due to the reversed ET from Er3+ to Yb3+ ions (4S3/2(Er3+) + 2F7/2(Yb3+) − 4I13/2(Er3+) + 2F5/2(Er3+)), which leads to the depopulation of the 4S3/2 level. As we all known, the phonon energy of In2O3 is larger than that of Yb2O3, which may lead to the increase of nonradiative relaxation. However, all the emissions (including red emission and green emission) will be quenching due to the nonradiative relaxation. The quenching of the green emissions is mainly attributed to the reversed ET from Yb3+ ions to Er3+ ions, which can be confirmed by the fluorescence decay of 4S3/2 level. Finally, the power-dependent UCL in In2O3:Yb3+,Er3+ NRFs can be well explained. The three-photon population processes 4F9/2–4G11/2 become more effective with the increasing of excitation power, leading the depopulation of the 4F9/2 level and the population enhancement of 4G11/2. The populations for 4F3/2 and 4S3/2/2H11/2 levels also increase due to multi-phonon relaxation, so the R/G ratio decreases as the excitation power increases.
4. Conclusion
In2O3:Yb3+,Er3+ NRFs has been successfully prepared by a simple hydrothermal method combined with a succedent calcining process. It is also found that in In2O3:Yb3+,Er3+ NRFs, the concentration quenching is dramatically suppressed. The R/G ratio changed depending on the NP morphology, Yb3+ concentration and the excitation power. The green emissions are mainly originated from three-photon excitation in In2O3:Yb3+,Er3+ NRFs with higher Yb3+ concentration, which is different from other substrate materials. The In2O3:Yb3+,Er3+ NRFs are potential candidate for the application of lighting and solar cell.Conflicts of interest
The authors declare no competing financial interest.Acknowledgements
This work was supported by National Natural Science Foundation of China (Grant no. 11504188, 11504131, 51374132, 21571109), Natural Science Foundation of Henan Province (Grant no. U1504626).References
- F. Auzel, Chem. Rev., 2004, 104, 139–174 CrossRef CAS PubMed.
- P. P. Lei, R. An, S. Yao, Q. S. Wang, L. L. Dong, X. Xu, K. M. Du, J. Feng and H. J. Zhang, Adv. Mater., 2017, 29, 1700505 CrossRef PubMed.
- M. Haase and H. Schafer, Angew. Chem., Int. Ed., 2011, 50, 5808–5829 CrossRef CAS PubMed.
- X. Chen, Y. S. Zhu, D. L. Zhou, W. Xu, J. Y. Zhu, G. C. Pan, Z. Yin, H. Wang, S. B. Cui and H. W. Song, J. Mater. Chem. C, 2017, 5, 2451–2458 RSC.
- T. Hinamoto, H. Takashina, H. Sugimoto and M. Fujii, J. Phys. Chem. C, 2017, 121, 8077–8083 Search PubMed.
- I. Hyppänen, N. Höysniemi, R. Arppe, M. Schäferling and T. Soukka, J. Phys. Chem. C, 2017, 121, 6924–6929 Search PubMed.
- C. Yao, P. Y. Wang, R. Wang, L. Zhou, A. M. El-Toni, Y. Q. Lu, X. M. Li and F. Zhang, Anal. Chem., 2016, 88, 1930–1936 CrossRef CAS PubMed.
- Y. M. Li, Y. M. Li, R. Wang, Y. L. Xu and W. Zheng, New J. Chem., 2017, 41, 7116–7122 RSC.
- S. Y. Han, A. Samanta, X. J. Xie, L. Huang, J. J. Peng, S. J. Park, D. B. L. Teh, Y. Choi, Y. T. Chang, A. H. All, Y. M. Yang, B. G. Xing and X. G. Liu, Adv. Mater., 2017, 29, 1700244 CrossRef PubMed.
- Y. Liu, Q. Q. Su, M. Chen, Y. Dong, Y. B. Shi, W. Feng, Z. Y. Wu and F. Y. Li, Adv. Mater., 2016, 28, 6625–6630 CrossRef CAS PubMed.
- Y. S. Zhu, W. Xu, S. B. Cui, M. Liu, C. Lu, H. W. Song and D. H. Kim, J. Mater. Chem. C, 2016, 4, 331–339 RSC.
- J. Wang, H. W. Song, W. Xu, B. Dong, S. Xu, B. T. Chen, W. Yu and S. Zhang, Nanoscale, 2013, 5, 3412–3420 RSC.
- J. H. Kang, S. S. Lee, J. Guerrero, A. Fernandez-Nieves, S. H. Kim and E. Reichmanis, Adv. Mater., 2017, 29, 1606830 CrossRef PubMed.
- Y. Luo, S. N. Du, W. Zhang, Z. F. Liao, F. Zuo and S. T. Yang, RSC Adv., 2017, 7, 37929–37937 RSC.
- D. M. Yang, Y. L. Dai, P. G. Ma, X. J. Kang, Z. Y. Cheng, C. X. Li and J. Lin, Chem.–Eur. J., 2013, 19, 2685–2694 CrossRef CAS PubMed.
- S. W. Hao, G. Y. Chen, C. H. Yang, W. Shao, W. Wei, Y. Liu and P. N. Prasad, Nanoscale, 2017, 9, 10633–10638 RSC.
- Y. G. Choi, S. M. Yu and W. J. Chung, Chem. Phys. Lett., 2008, 461, 290–293 CrossRef CAS.
- A. Podhorodecki, R. Kudrawiec, J. Misiewicz, N. V. Gaponenko and D. A. Tsyrkunov, Opt. Mater., 2006, 28, 685–687 CrossRef CAS.
- H. K. Kim, C. C. Li, G. Nykolak and P. C. Becker, J. Appl. Phys., 1994, 76, 8209–8211 CrossRef CAS.
- Q. B. Xiao, H. M. Zhu, D. T. Tu, E. Ma and X. Y. Chen, J. Phys. Chem. C, 2013, 117, 10834–10841 CAS.
- L. Xu, B. Dong, Y. Wang, X. Bai, J. S. Chen, Q. Liu and H. W. Song, J. Phys. Chem. C, 2010, 114, 9089–9095 CAS.
- D. P. Dutta, V. Sudarsan, P. Srinivasu, A. Vinu and A. K. Tyagi, J. Phys. Chem. C, 2008, 112, 6781–6785 CAS.
- X. M. Xu, D. W. Wang, W. B. Wang, P. Sun, J. Ma, X. S. Liang, Y. F. Sun, Y. G. Ma and G. Y. Lu, Sens. Actuators, B, 2012, 171, 1066–1072 CrossRef.
- Y. Ruan, Q. B. Xiao, W. Q. Luo, R. F. Li and X. Y. Chen, Nanotechnology, 2011, 22, 275701 CrossRef PubMed.
- J. L. Ferrari, A. M. Pires and M. R. Davolos, Mater. Chem. Phys., 2009, 113, 587–590 CrossRef CAS.
- P. Ghosh, S. Sadhu and A. Patra, Phys. Chem. Chem. Phys., 2006, 8, 3342–3348 RSC.
- Y. S. Zhu, Z. P. Sun, Z. Yin, H. W. Song, W. Xu, Y. F. Wang, L. G. Zhang and H. Z. Zhang, Dalton Trans., 2013, 42, 8049–8057 RSC.
- M. Yu, J. Lin and J. Fang, Chem. Mater., 2005, 17, 1783–1791 CrossRef CAS.
- X. Bai, H. W. Song, G. H. Pan, Y. Q. Lei, T. Wang, X. G. Ren, S. Z. Lu, B. Dong, Q. L. Dai and L. B. Fan, J. Phys. Chem. C, 2007, 111, 13611–13617 CAS.
- N. Niu, P. P. Yang, F. He, X. Zhang, S. L. Gai, C. X. Li and J. Lin, J. Mater. Chem., 2012, 22, 10889 RSC.
- J. A. Capobianco, F. Vetrone, T. Alesio, G. Tessari and M. Bettinelli, Phys. Chem. Chem. Phys., 2000, 2, 3203–3207 RSC.
- A. Raza, O. P. Agnihotri and B. K. Gupta, J. Phys. D: Appl. Phys., 1977, 10, 1871–1876 CrossRef CAS.
Footnote |
| † Electronic supplementary information (ESI) available. See DOI: 10.1039/c7ra10582g |
| This journal is © The Royal Society of Chemistry 2017 |

