 Open Access Article
Creative Commons Attribution 3.0 Unported Licence
Exploring the effects of four important factors on oil–CO2 interfacial properties and miscibility in nanopores†
Kaiqiang Zhang a,
Na Jia*a and
Songyan Li*b
aPetroleum Systems Engineering, Faculty of Engineering and Applied Science, University of Regina, Regina, Saskatchewan S4S 0A2, Canada. E-mail: Na.Jia@Uregina.Ca; Fax: +1-306-585-4855; Tel: +1-306-337-3287
bCollege of Petroleum Engineering, China University of Petroleum (East China), Qingdao 266580, China. E-mail: lsyupc@163.com; Tel: +86-15253201659
First published on 27th November 2017
Abstract
In this paper, a modified Peng–Robinson equation of state (PR-EOS) coupled with the parachor model and a newly-developed diminishing interface method (DIM) are applied to predict the interfacial properties and minimum miscibility pressures (MMPs) of light oil–CO2 systems in nanopores. First, the modified PR-EOS is used to calculate the vapour–liquid equilibrium by considering the effects of capillary pressure and shifts of critical temperature and pressure. Second, a thermodynamic formula of the interfacial thickness (IT) between two mutually soluble phases is derived, based on which the novel DIM is developed. The MMP is determined by extrapolating the derivative of the IT with respect to the pressure (∂δ/∂P)T to zero. It is found that at the pore radius of 10 nm, all three quantities, the interfacial tensions (IFTs), ITs, and MMPs, show obvious increases with temperature. The effects of the initial oil composition on the three quantities are measurable but marginal and the MMP is more sensitive to the initial oil composition at a higher temperature. Moreover, the IFTs and ITs are weakly dependent but the determined MMPs are strongly dependent on the injection gas composition. The presence of CH4 in the injection gas results in a substantial MMP increase in nanopores. At a constant temperature, the effects of the feed ratio of injection gas to oil on the IFTs, ITs, and MMPs are negligible with pure CO2 injection, especially at low feed gas–oil ratios (less than 0.50![[thin space (1/6-em)]](https://www.rsc.org/images/entities/char_2009.gif) :
:![[thin space (1/6-em)]](https://www.rsc.org/images/entities/char_2009.gif) 0.50 in mole fraction), whereas they become much stronger and cause the MMPs with impure CO2 (0.65CO2 + 0.35CH4) injection to be considerably increased from 26.3 to 40.0 MPa by reducing the feed gas–oil ratio from 0.90
0.50 in mole fraction), whereas they become much stronger and cause the MMPs with impure CO2 (0.65CO2 + 0.35CH4) injection to be considerably increased from 26.3 to 40.0 MPa by reducing the feed gas–oil ratio from 0.90![[thin space (1/6-em)]](https://www.rsc.org/images/entities/char_2009.gif) :
:![[thin space (1/6-em)]](https://www.rsc.org/images/entities/char_2009.gif) 0.10 to 0.10
0.10 to 0.10![[thin space (1/6-em)]](https://www.rsc.org/images/entities/char_2009.gif) :
:![[thin space (1/6-em)]](https://www.rsc.org/images/entities/char_2009.gif) 0.90 in mole fraction.
0.90 in mole fraction.
1. Introduction
In the petroleum industry, gas (e.g., CO2) injection has been used for a long time to enhance oil recovery1,2 by improving the fluid microscopic displacement efficiency, whose mechanisms are attributed to, for example, interfacial tension (IFT) reduction and miscible displacement.3 During the gas injection process, interfacial mass transfer always occurs across the interface between the oil and gas phases so that some interfacial properties (e.g., IFT) vary under different conditions. In general, the IFTs between the oil and gas phases can be measured at different pressures and reservoir temperatures by applying, for example, the axisymmetric drop shape analysis (ADSA) technique for the pendant drop case.4 Alternatively, they can be predicted by using, for instance, the parachor model.5 On the other hand, a distinct miscible state between the oil and gas phases can be developed as the mass transfer continues and the physicochemical properties of two phases become similar.6 Accordingly, the minimum miscibility pressure (MMP) is defined as the lowest operating pressure at which the oil and gas phases can become miscible in any portions through a dynamic multi-contact miscibility (MCM) process at the reservoir temperature.7,8 To ensure a miscible gas flooding process with a high oil production, an accurate determination of the MMP for a given oil–gas system is required in the oilfield application. A number of theoretical models,9,10 numerical simulations,11,12 and experimental methods13,14 have been developed to determine the MMPs of various oil–gas systems. However, most of them are applied to determine the MMPs in bulk phase rather than in porous medium.The IFT and MMP of the oil–gas system strongly depend on the temperature/pressure and initial overall fluid composition, i.e., the initial oil and injection gas compositions as well as the feed ratio of injection gas to oil.15 In the literature, the IFT of an oil–gas system is decreased with pressure at a constant temperature, whereas it is increased with temperature if the pressure keeps constant.16 The MMP also becomes higher at a higher temperature. In addition, the initial overall fluid composition is found to have a foremost and direct effect on the IFT and MMP.17 In practice, the effect of initial oil composition was studied by comparing the measured IFTs/MMPs of different oil samples with the same solvent phase (e.g., CO2) while the effect of injection gas composition was studied by choosing different solvent phases with the same oil sample. For example, the CH4-dominated HCs pre-saturated live light oil–CO2 system was found to have a higher IFT/MMP, whereas the intermediate HCs pre-saturated one has a lower IFT/MMP in comparison with that of the dead light oil–CO2 system.18 Similar results were also found in terms of the effect of injection gas composition on the IFT/MMP studies.15 Moreover, the effect of feed ratio of injection gas to oil on the measured IFT/MMP cannot be ignored although there is no general consensus on it. In some early studies, the feed ratio was considered to only affect how quickly the equilibrium state could be achieved and have no effect on the IFT/MMP.19 Later, it was found that the measured IFT/MMP reached a minimum value when the feed ratio of the injection gas to oil equals to 1![[thin space (1/6-em)]](https://www.rsc.org/images/entities/char_2009.gif) :
:![[thin space (1/6-em)]](https://www.rsc.org/images/entities/char_2009.gif) 1 in volume and was slightly increased at an increased injection gas concentration.20
1 in volume and was slightly increased at an increased injection gas concentration.20
The presence of nanopores in tight formation and its effect on the liquid phase behaviour, IFT and MMP of the light oil–gas systems have been introduced in the literature.21 Cubic equation of state (EOS) is usually treated as an available and appropriate approach to calculate the vapour–liquid equilibrium (VLE) properties in nanopores.22 The confined space or pore proximity are found to cause variations of the phase behaviour and IFT/MMP due to the effects of capillary pressure and shifts of the critical properties.23 More specifically, the bubble-point and dew-point pressures and temperatures are suppressed or increased to different extents. The IFT and MMP are generally decreased with the reduction of pore radius at a constant temperature.24 For example, the bubble point pressure of a Bakken oil–CO2 system is found to be significantly decreased while its upper dew-point pressure is increased and its lower dew-point pressure is decreased with an increasing effect of confinement.25 A reduction of 1.38 MPa (200 psi) in MMP for a light oil–pure CO2 system is found when the pore radius is decreased from 1000 nm to 4 nm at a constant temperature. Moreover, for a light oil–CO2/CH4 system, the MMP in bulk phase can be up to 3.45 MPa (500 psi) higher than that at the pore radius of 4 nm. It is obvious that the injection gas composition affects MMPs. However, to the best knowledge of the authors, no study so far has systematically studied the effects of the initial overall fluid composition (e.g., initial oil composition, injection gas composition, or feed ratio of injection gas to oil) on the IFTs and MMPs in nanopores.
In this paper, first, a PR-EOS is modified for the VLE calculations by considering the effects of capillary pressure and shifts of the critical temperature and pressure, which is also coupled with the parachor model to predict the IFTs in nanopores. Second, the interfacial thickness between two mutually soluble phases (e.g., light oil and CO2 phases) is determined by considering the two-way mass transfer, i.e., CO2 dissolution into the oil phase and light hydrocarbons (HCs)-extraction from the oil phase by CO2. Based on the determined interfacial thicknesses, a new technical method, namely, the diminishing interface method (DIM), is proposed and applied to determine the MMPs. Finally, the following four important factors are specifically studied to evaluate and compare their detailed effects on the IFTs, interfacial thicknesses, and MMPs at the pore radius of 10 nm: temperature, initial oil composition, injection gas composition, and feed ratio of injection gas to oil. It should be noted that most pore sizes of the middle Bakken formation are distributed in the range of 10–50 nm![[thin space (1/6-em)]](https://www.rsc.org/images/entities/char_2009.gif) 26 and the effect of pore radius on the phase behaviour of oil–gas system is substantially increased in smaller pores.25 Hence, 10 nm is particularly selected as the target pore radius in this study. Also, the feed ratio of injection gas to oil is always equal to 0.90
26 and the effect of pore radius on the phase behaviour of oil–gas system is substantially increased in smaller pores.25 Hence, 10 nm is particularly selected as the target pore radius in this study. Also, the feed ratio of injection gas to oil is always equal to 0.90![[thin space (1/6-em)]](https://www.rsc.org/images/entities/char_2009.gif) :
:![[thin space (1/6-em)]](https://www.rsc.org/images/entities/char_2009.gif) 0.10 in mole fraction for all cases in this paper except for Section 4.4 Effects of feed ratio of injection gas to oil.
0.10 in mole fraction for all cases in this paper except for Section 4.4 Effects of feed ratio of injection gas to oil.
2. Experimental
In Table 1, the detailed compositions of the Pembina dead and live oil samples and Bakken live oil sample used in this study are listed. The properties of the Bakken live oil–CO2 system were introduced in the literature.25 Furthermore, a Pembina dead light oil sample was collected from the Pembina oilfield, cardium formation in Alberta (Canada). The gas chromatography (GC) compositional analysis of the cleaned Pembina dead oil was performed and the detailed results can be found elsewhere.27 The Pembina live oil with the gas–oil ratio (GOR) of 15![[thin space (1/6-em)]](https://www.rsc.org/images/entities/char_2009.gif) :
:![[thin space (1/6-em)]](https://www.rsc.org/images/entities/char_2009.gif) 1 sm3/sm3 was reconstituted by saturating the Pembina dead oil sample with the produced HC gas. The actual composition of the produced gas was equal to 66.50 mol% CH4 + 11.41 mol% C2H6 + 11.39 mol% C3H8 + 10.70 mol% n-C4H10. Three impure CO2 samples are applied by mixing pure CO2 and pure CH4 to reach a pre-determined nominal composition of 90 mol% CO2 + 10 mol% CH4, 65 mol% CO2 + 35 mol% CH4, and 50 mol% CO2 + 50 mol% CH4. The detailed experimental setups and procedures for preparing the Pembina live oil sample and the impure CO2 sample were described elsewhere.27
1 sm3/sm3 was reconstituted by saturating the Pembina dead oil sample with the produced HC gas. The actual composition of the produced gas was equal to 66.50 mol% CH4 + 11.41 mol% C2H6 + 11.39 mol% C3H8 + 10.70 mol% n-C4H10. Three impure CO2 samples are applied by mixing pure CO2 and pure CH4 to reach a pre-determined nominal composition of 90 mol% CO2 + 10 mol% CH4, 65 mol% CO2 + 35 mol% CH4, and 50 mol% CO2 + 50 mol% CH4. The detailed experimental setups and procedures for preparing the Pembina live oil sample and the impure CO2 sample were described elsewhere.27
| Oil | Solvent | |||||
|---|---|---|---|---|---|---|
| Component | Pembina dead oil composition (mol%) | Pembina live oil composition (mol%) | Component | Bakken live oil composition (mol%) | Component | Purity (mol%) |
| C1 | 0.00 | 62.35 | C1 | 36.74 | CO2 | 99.998 |
| C2 | 0.00 | 10.70 | C2 | 14.89 | ||
| C3 | 0.20 | 10.69 | C3 | 9.33 | C1 | 99.970 |
| C4 | 1.17 | 10.10 | C4 | 5.75 | ||
| C5–6 | 8.68 | 0.54 | C5–6 | 6.41 | C2 | 99.000 |
| C7–12 | 43.19 | 2.70 | C7–12 | 15.85 | ||
| C13–29 | 36.77 | 2.30 | C13–21 | 7.33 | C3 | 99.500 |
| C30+ | 9.99 | 0.62 | C22–80 | 3.70 | ||
A mercury-free pressure–volume–temperature (PVT) system (PVT-0150-100-200-316-155, DBR, Canada) was used to measure the PVT data of the Pembina dead light oil–CO2 system with four different CO2 concentrations at T = 53.0 °C.27 The measured PVT data are summarized in Table 2. The experimental setup and procedure of the PVT tests were described previously.27 It is found that the experimentally measured saturation pressure, oil density, and oil-swelling factor (SF) increase with CO2 concentration due to the CO2 dissolution. In this work, the measured Pembina oil PVT data were used to tune the modified Peng–Robinson EOS (PR-EOS) for VLE calculations. Besides, a series of bubble-point pressures of the Bakken live oil–pure CO2 system at different pore radii and T = 116.1 °C are obtained from the literature and plotted in Fig. 1.
| Test no. | xCO2 | Pmsat (MPa) | Pcsat (MPa) | εp (%) | ρmoil (g cm−3) | ρcoil (g cm−3) | ερ (%) | SFm at Psat | SFc at Psat | εSF (%) | |
|---|---|---|---|---|---|---|---|---|---|---|---|
| wt% | mol% | ||||||||||
| a xCO2: weight or mole percentage of CO2 dissolved into in the dead light oil, Pmsat: measured saturation pressure, Pcsat: calculated saturation pressure, ρmoil: measured oil density, ρcoil: calculated oil density, SFm: measured oil-swelling factor, SFc: calculated oil-swelling factor, ε: relative error between the calculated and measured data. | |||||||||||
| 1 | 0.00 | 0.00 | — | — | — | 0.8300 | 0.8311 | 0.13 | — | — | — |
| 2 | 10.40 | 35.90 | 6.50 | 6.52 | 0.31 | 0.8432 | 0.8439 | 0.08 | 1.16 | 1.16 | 0.00 |
| 3 | 13.40 | 42.70 | 7.80 | 7.77 | 0.38 | 0.8440 | 0.8446 | 0.07 | 1.20 | 1.19 | 0.80 |
| 4 | 18.20 | 51.70 | 9.60 | 9.63 | 0.31 | 0.8485 | 0.8488 | 0.04 | 1.28 | 1.30 | 1.56 |
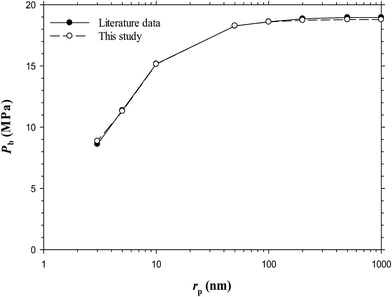 | ||
| Fig. 1 Predicted bubble-point pressures of the Bakken live oil from the literature25 and this study at different pore radius and Tres = 116.1 °C. | ||
3. Theory
3.1 Modified equation of state
In this study, a modified PR-EOS is proposed to calculate the VLE properties at the pore radius of 10 nm.24 More specifically, first, the shifts of critical properties (i.e., critical temperature and pressure) of the confined fluids are considered in nanopores as follows,23
 | (1) |
 | (2) |
 ; rp is the pore radius; Tcp is the critical temperature in nanopores; Tc is the critical temperature in bulk phase; Pcp is the critical pressure in nanopores; Pc is the critical pressure in bulk phase.
In addition, the liquid and vapour phases are assumed to be the wetting phase and non-wetting phase, respectively.26 Thus the capillary pressure (Pcap) is,
| Pcap = PV − PL | (3) |
 | (4) |
 | (5) |
The VLE calculations based on the modified PR-EOS require a series of iterative computation through, for example, the Newton–Raphson method. Fig. 2 shows the flowchart of the VLE calculation process. The predicted PVT data for the Pembina dead oil–pure CO2 system and Bakken live oil–pure CO2 system are summarized and compared with the measured and/or literature date in Table 2 and Fig. 1, respectively. Overall, the modified PR-EOS in this study is capable of predicting the phase behaviour of the two light oil–CO2 systems in bulk phase and/or nanopores, whose results agree well with the measured/literature data.
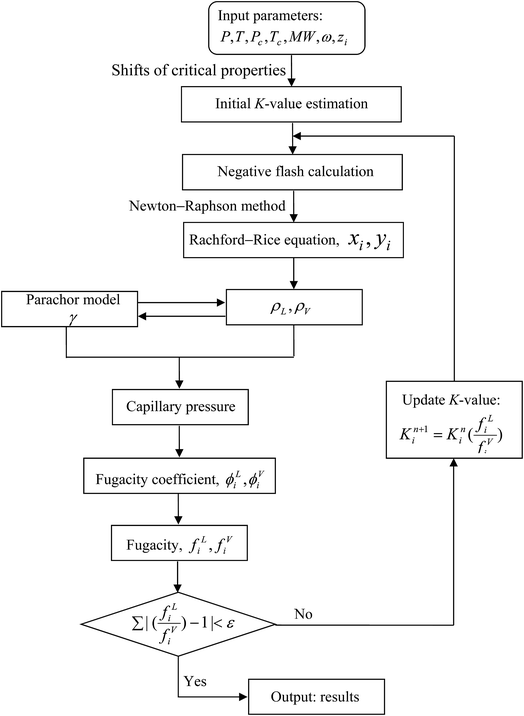 | ||
| Fig. 2 Flowchart of the modified Peng–Robinson equation of state for phase property predictions and parachor model for interfacial tension calculations in nanopores. | ||
3.2 Interfacial thickness
In this study, a formula for determining the interfacial thickness between two mutually soluble phases (e.g., oil and CO2 phases) is derived by taking account of the two-way mass transfer,
 | (6) |
It should be noted that the sign of δ is determined by the characteristics of the two bulk phases. More specifically, if the two phases are barely mutually soluble and repulsive intermolecular interaction dominates in the interfacial region, δ > 0![[thin space (1/6-em)]](https://www.rsc.org/images/entities/char_2009.gif) . If the two phases are mutually soluble and two-way mass transfer occurs across the interface, δ < 0. In this study, the interfacial tension of the light oil–CO2 system is decreased with the pressure so that δ is negative. Although the sign of δ can be positive, zero, or negative, the physical interfacial thickness has to be positive.29
. If the two phases are mutually soluble and two-way mass transfer occurs across the interface, δ < 0. In this study, the interfacial tension of the light oil–CO2 system is decreased with the pressure so that δ is negative. Although the sign of δ can be positive, zero, or negative, the physical interfacial thickness has to be positive.29
4. Results and discussion
4.1 DIM for MMP determination
In theory, the interfacial thickness (τ) is defined as the partial derivative of the IFT (γ) with respect to the pressure (P) at a constant temperature, i.e., δ = (∂γ/∂P)T. In this study, the interfacial thickness is obtained by using the forward finite difference approximation (FDA) of the partial derivative of the IFT (γ) with respect to the pressure (P) at a constant temperature, i.e., δ = (Δγ/ΔP)T. The IFTs and interfacial thicknesses between the oil and CO2 phases as well as the FDA of the partial derivative of the interfacial thickness (second derivative of the IFT) with respect to the pressure at a constant temperature, i.e., (Δδ/ΔP)T, for example, the Pembina live oil–pure CO2 system at T = 15.6 °C is plotted in Fig. 3a. It is found that the IFT of the oil–CO2 system is reduced with the pressure since the live light oil and pure CO2 phase are mutual soluble. Thus the sign of δ is negative in this study. However, it should be noted that the physical interfacial thickness is always positive even if the sign of δ could be positive, zero, or negative.29In terms of the DIM method, the MMP is determined by linearly regressing and extrapolating the derivative of the interfacial thickness with respect to the pressure (Δδ/ΔP)T vs. pressure data to zero. Physically, (Δδ/ΔP)T = 0 means the interfacial thickness between the oil and CO2 phases becomes constant and remains unchanged with the pressure. Thus it is inferred that a stable interfacial thickness between the crude oil and CO2 phases rather than a zero-IFT condition is obtained when the miscibility is achieved. Mathematically, the linearity of such a linear regression can be represented by the so-called linear correlation coefficient (LCC) or R2. More specifically, the LCC of the linear regression of the data points from the highest (Δδ/ΔP)T point at the lowest pressure to any point at an arbitrarily higher pressure is obtained for the MMP determination. In the previous study, Rc2 = 0.990 is considered to be a critical value of the LCC criterion.20 Hence, in Fig. 3a, the MMP of the Pembina live oil–pure CO2 system is determined to be 7.0 MPa by using the LCC criterion from the DIM method at T = 15.6 °C.
4.2 Temperature effect
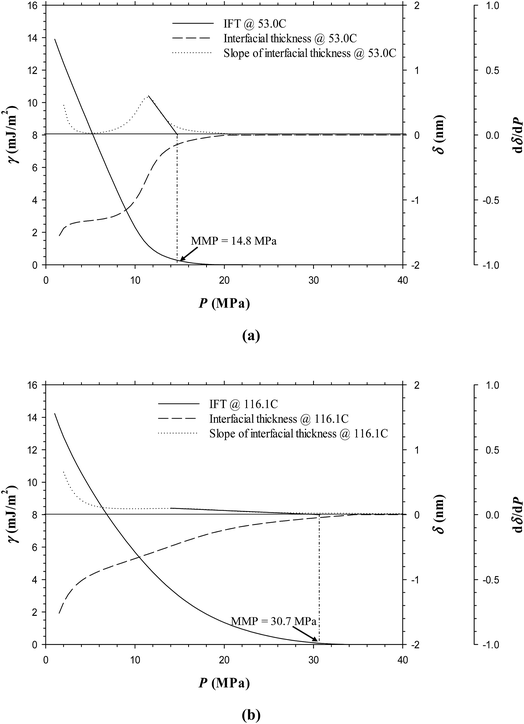
It is seen from Fig. 3a–e that the IFTs and interfacial thicknesses of the Pembina live oil–pure CO2 system at the pore radius of 10 nm and five different temperatures of T = 15.6, 30.0, 53.0, 80.0, and 116.1 °C are different, but overall, they are decreased with the pressure. More specifically, in comparison with those at higher temperatures, the IFTs at lower temperatures are decreased much more rapidly with the pressure increase. This is because CO2 solubility in oil phase is decreased with the temperature if the pressure is kept constant.30 Accordingly, a larger density difference between the oil phase with less CO2 dissolution and CO2 phase is caused at a higher temperature and the corresponding IFT becomes higher. In addition, the interfacial thickness at a lower temperature is increased initially to different extents, that is, a substantial increase at T = 15.6 and 30.0 °C and a slight increase at T = 53.0 °C. Afterwards, it is quickly decreased and finally tends to be stabilized. However, the interfacial thickness of the oil–CO2 system at a higher temperature (i.e., 80.0 and/or 116.1 °C) is continuously decreased with the pressure. It is worthwhile to mention that among the five different temperatures, the interfacial thickness of the oil–CO2 system at the lowest temperature (i.e., 15.6 °C) is quickly reduced to be the smallest at a high pressure while at the highest temperature (i.e., 116.1 °C) it is decreased slowly and becomes the largest at a high pressure. In a similar manner with the Pembina live oil–CO2 system, the IFTs and interfacial thicknesses of the Bakken live oil–pure CO2 system at T = 53.0 and 116.1 °C are decreased with the pressure and shown in Fig. 4a and b.By means of the DIM method, the determined MMPs of the Pembina live oil–pure CO2 system at T = 15.6, 30.0, 53.0, 80.0, and 116.1 °C are shown in Fig. 3a–e, which increase from 7.0, 8.5, 13.7, 22.5, to 29.7 MPa, respectively. Moreover, the MMPs of the Bakken live oil–pure CO2 system at T = 53.0 and 116.1 °C are determined to be 14.5 and 30.7 MPa, respectively. With the above-mentioned results, the temperature effects on the determined MMPs of the Pembina and Bakken live oil–pure CO2 systems at the pore radius of 10 nm from the DIM method are summarized in Table 3 and plotted in Fig. 5. On a basis of the data points in this figure, the MMPs for the two oil–CO2 systems at different temperatures are correlated to the temperature T (C) by using the linear regression:
| MMP/MPa = 0.2384(T/C) + 2.2304 Pembina live oil–pure CO2 system | (7) |
| MMP/MPa = 0.2531(T/C) + 1.3462 Bakken live oil–pure CO2 system | (8) |
| Test no. | T (°C) | Oil | Gas (mole fraction) | Feed ratio of gas to oil (mole fraction) | MMP (MPa) |
|---|---|---|---|---|---|
| 1 | 15.6 | Pembina live | CO2 | 0.90![[thin space (1/6-em)]](https://www.rsc.org/images/entities/char_2009.gif) : :![[thin space (1/6-em)]](https://www.rsc.org/images/entities/char_2009.gif) 0.10 0.10 |
7.0 |
| 2 | 30.0 | Pembina live | CO2 | 0.90![[thin space (1/6-em)]](https://www.rsc.org/images/entities/char_2009.gif) : :![[thin space (1/6-em)]](https://www.rsc.org/images/entities/char_2009.gif) 0.10 0.10 |
8.5 |
| 3 | 53.0 | Pembina live | CO2 | 0.90![[thin space (1/6-em)]](https://www.rsc.org/images/entities/char_2009.gif) : :![[thin space (1/6-em)]](https://www.rsc.org/images/entities/char_2009.gif) 0.10 0.10 |
13.7 |
| 4 | 80.0 | Pembina live | CO2 | 0.90![[thin space (1/6-em)]](https://www.rsc.org/images/entities/char_2009.gif) : :![[thin space (1/6-em)]](https://www.rsc.org/images/entities/char_2009.gif) 0.10 0.10 |
22.5 |
| 5 | 116.1 | Pembina live | CO2 | 0.90![[thin space (1/6-em)]](https://www.rsc.org/images/entities/char_2009.gif) : :![[thin space (1/6-em)]](https://www.rsc.org/images/entities/char_2009.gif) 0.10 0.10 |
29.7 |
| 6 | 53.0 | Pembina dead | CO2 | 0.90![[thin space (1/6-em)]](https://www.rsc.org/images/entities/char_2009.gif) : :![[thin space (1/6-em)]](https://www.rsc.org/images/entities/char_2009.gif) 0.10 0.10 |
11.6 |
| 7 | 116.1 | Pembina dead | CO2 | 0.90![[thin space (1/6-em)]](https://www.rsc.org/images/entities/char_2009.gif) : :![[thin space (1/6-em)]](https://www.rsc.org/images/entities/char_2009.gif) 0.10 0.10 |
26.5 |
| 8 | 53.0 | Bakken live | CO2 | 0.90![[thin space (1/6-em)]](https://www.rsc.org/images/entities/char_2009.gif) : :![[thin space (1/6-em)]](https://www.rsc.org/images/entities/char_2009.gif) 0.10 0.10 |
14.8 |
| 9 | 116.1 | Bakken live | CO2 | 0.90![[thin space (1/6-em)]](https://www.rsc.org/images/entities/char_2009.gif) : :![[thin space (1/6-em)]](https://www.rsc.org/images/entities/char_2009.gif) 0.10 0.10 |
30.7 |
| 10 | 53.0 | Pembina live | 0.90CO2 + 0.10CH4 | 0.90![[thin space (1/6-em)]](https://www.rsc.org/images/entities/char_2009.gif) : :![[thin space (1/6-em)]](https://www.rsc.org/images/entities/char_2009.gif) 0.10 0.10 |
17.2 |
| 11 | 53.0 | Pembina live | 0.65CO2 + 0.35CH4 | 0.90![[thin space (1/6-em)]](https://www.rsc.org/images/entities/char_2009.gif) : :![[thin space (1/6-em)]](https://www.rsc.org/images/entities/char_2009.gif) 0.10 0.10 |
26.3 |
| 12 | 53.0 | Pembina live | 0.50CO2 + 0.50CH4 | 0.90![[thin space (1/6-em)]](https://www.rsc.org/images/entities/char_2009.gif) : :![[thin space (1/6-em)]](https://www.rsc.org/images/entities/char_2009.gif) 0.10 0.10 |
31.0 |
| 13 | 53.0 | Bakken live | 0.90CO2 + 0.10CH4 | 0.90![[thin space (1/6-em)]](https://www.rsc.org/images/entities/char_2009.gif) : :![[thin space (1/6-em)]](https://www.rsc.org/images/entities/char_2009.gif) 0.10 0.10 |
17.5 |
| 14 | 53.0 | Bakken live | 0.65CO2 + 0.35CH4 | 0.90![[thin space (1/6-em)]](https://www.rsc.org/images/entities/char_2009.gif) : :![[thin space (1/6-em)]](https://www.rsc.org/images/entities/char_2009.gif) 0.10 0.10 |
24.1 |
| 15 | 53.0 | Bakken live | 0.50CO2 + 0.50CH4 | 0.90![[thin space (1/6-em)]](https://www.rsc.org/images/entities/char_2009.gif) : :![[thin space (1/6-em)]](https://www.rsc.org/images/entities/char_2009.gif) 0.10 0.10 |
28.1 |
| 16 | 53.0 | Pembina live | CO2 | 0.70![[thin space (1/6-em)]](https://www.rsc.org/images/entities/char_2009.gif) : :![[thin space (1/6-em)]](https://www.rsc.org/images/entities/char_2009.gif) 0.30 0.30 |
13.6 |
| 17 | 53.0 | Pembina live | CO2 | 0.50![[thin space (1/6-em)]](https://www.rsc.org/images/entities/char_2009.gif) : :![[thin space (1/6-em)]](https://www.rsc.org/images/entities/char_2009.gif) 0.50 0.50 |
13.5 |
| 18 | 53.0 | Pembina live | CO2 | 0.30![[thin space (1/6-em)]](https://www.rsc.org/images/entities/char_2009.gif) : :![[thin space (1/6-em)]](https://www.rsc.org/images/entities/char_2009.gif) 0.70 0.70 |
13.5 |
| 19 | 53.0 | Pembina live | CO2 | 0.10![[thin space (1/6-em)]](https://www.rsc.org/images/entities/char_2009.gif) : :![[thin space (1/6-em)]](https://www.rsc.org/images/entities/char_2009.gif) 0.90 0.90 |
13.5 |
| 20 | 53.0 | Pembina live | 0.65CO2 + 0.35CH4 | 0.70![[thin space (1/6-em)]](https://www.rsc.org/images/entities/char_2009.gif) : :![[thin space (1/6-em)]](https://www.rsc.org/images/entities/char_2009.gif) 0.30 0.30 |
28.4 |
| 21 | 53.0 | Pembina live | 0.65CO2 + 0.35CH4 | 0.50![[thin space (1/6-em)]](https://www.rsc.org/images/entities/char_2009.gif) : :![[thin space (1/6-em)]](https://www.rsc.org/images/entities/char_2009.gif) 0.50 0.50 |
32.7 |
| 22 | 53.0 | Pembina live | 0.65CO2 + 0.35CH4 | 0.30![[thin space (1/6-em)]](https://www.rsc.org/images/entities/char_2009.gif) : :![[thin space (1/6-em)]](https://www.rsc.org/images/entities/char_2009.gif) 0.70 0.70 |
34.7 |
| 23 | 53.0 | Pembina live | 0.65CO2 + 0.35CH4 | 0.10![[thin space (1/6-em)]](https://www.rsc.org/images/entities/char_2009.gif) : :![[thin space (1/6-em)]](https://www.rsc.org/images/entities/char_2009.gif) 0.90 0.90 |
40.0 |
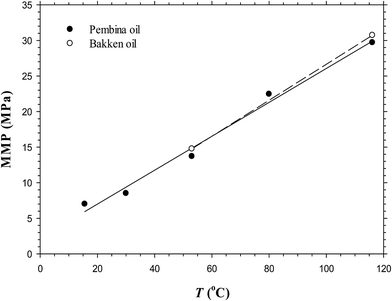 | ||
| Fig. 5 Predicted minimum miscibility pressures of the Pembina and Bakken live oil–pure CO2 systems at the pore radius of 10 nm and different temperatures. | ||
It is found that in general, the determined MMP increases almost linearly with the temperature in the range of 15.6–116.1 °C. In the literature, a linear correlation between the MMP and temperature in bulk phase was also recorded15 and a test temperature was reported even up to 150 °C.31 More specifically, in this study, the determined MMP increases with the elevated temperature at the respective rates of 0.2384 and 0.2531 MPa °C−1 for the Pembina and Bakken live oil–pure CO2 systems at the pore radius of 10 nm. Hence, it is concluded that the temperature has a strong effect on the MMP of the light oil–CO2 system in nanopores.
4.3 Effects of initial oil and injection gas compositions
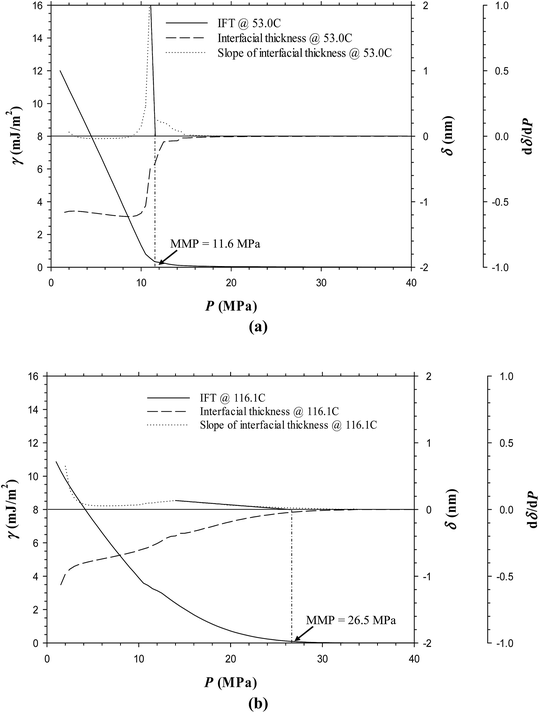
Fig. 6a and b show the predicted IFTs and interfacial thicknesses of the Pembina dead oil–pure CO2 system at T = 53.0 and 116.1 °C, both of which are decreased with the pressure. In comparison with those of the Pembina live oil–pure CO2 system, the IFTs and interfacial thicknesses are slightly lower/smaller and their rates of reductions are relatively higher with respect to the pressure. This is because the addition of CH4-dominated produced gas into oil sample reduces the CO2 solubility in the oil phase.18 Two respective MMPs are determined to be 11.6 and 26.5 MPa from the DIM at T = 53.0 and 116.1 °C, both of which are slightly lower than 13.7 and 29.7 MPa of the Pembina live oil–pure CO2 system at the same temperature. The effects of initial oil composition on the determined MMPs are further summarized in Fig. 7. First, it is found that the effects of initial oil composition on the determined MMPs are measurable but marginal at a constant temperature. This is attributed to the high feed ratio of the injection gas to initial oil (i.e., 0.90![[thin space (1/6-em)]](https://www.rsc.org/images/entities/char_2009.gif) :
:![[thin space (1/6-em)]](https://www.rsc.org/images/entities/char_2009.gif) 0.10 in mole fraction). In this case, the initial oil composition has a weak effect on the IFTs, interfacial thicknesses, and MMPs due to the small feed quantity. Second, the MMP increases from 11.6 to 13.7 MPa at T = 53.0 °C and from 26.5 to 29.7 MPa at T = 116.1 °C when the oil sample is changed from dead to live oil. A larger MMP increase occurs at a higher temperature and the pore radius of 10 nm. Hence, the MMP is found to be more sensitive to the initial oil composition at a higher temperature and it is better to control the temperature when a miscible gas injection project is conducted in the tight oil formation.
0.10 in mole fraction). In this case, the initial oil composition has a weak effect on the IFTs, interfacial thicknesses, and MMPs due to the small feed quantity. Second, the MMP increases from 11.6 to 13.7 MPa at T = 53.0 °C and from 26.5 to 29.7 MPa at T = 116.1 °C when the oil sample is changed from dead to live oil. A larger MMP increase occurs at a higher temperature and the pore radius of 10 nm. Hence, the MMP is found to be more sensitive to the initial oil composition at a higher temperature and it is better to control the temperature when a miscible gas injection project is conducted in the tight oil formation.
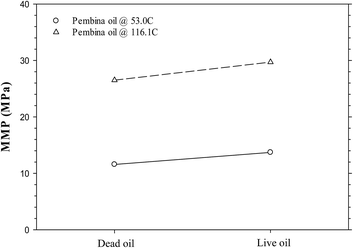 | ||
| Fig. 7 Predicted minimum miscibility pressures of the Pembina dead and live oil–pure CO2 systems at T = 53.0 °C and 116.1 °C and the pore radius of 10 nm. | ||
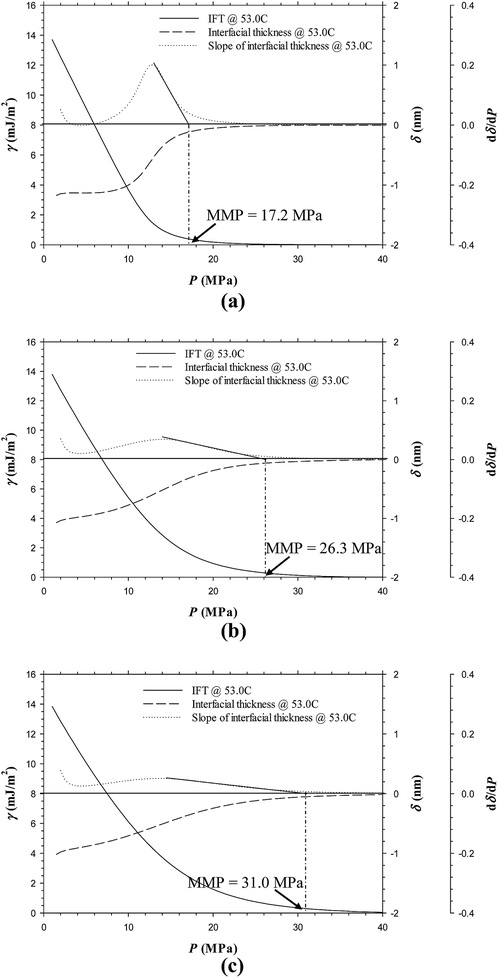
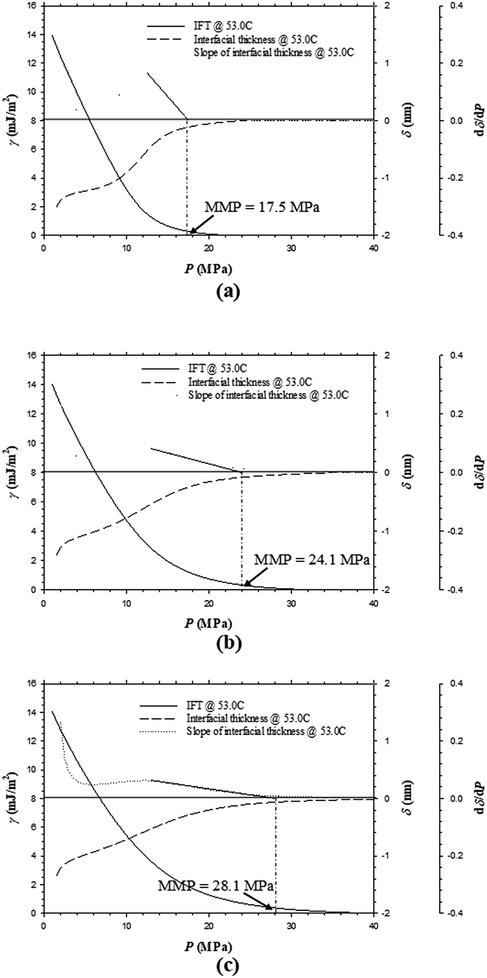
In the oilfield application of a CO2 injection project, the injected pure CO2 will likely contain some solution gas, the primary component of which is CH4.32 In this study, the effects of CH4 in an impure CO2 sample on the IFTs, interfacial thicknesses, and MMPs are purposely studied by adding respective 0.10, 0.35, and 0.50 CH4 in mole fraction into the pure CO2 to obtain three different impure CO2 samples. Fig. 8a–c indicate that the IFTs and interfacial thicknesses for the Pembina live oil at T = 53.0 °C have a slightly decreasing rate of reduction with respective to the pressure if CH4 content increases from 0.10, 0.35, to 0.50 in mole fraction. Meanwhile, the MMPs substantially increase from 17.2, 26.3, to 31.0 MPa with the same CH4 content increases. In Fig. 9a–c, the IFTs and interfacial thicknesses of the Bakken live oil show a similar pattern with the same amount of CH4 addition into the pure CO2. The MMPs of the Bakken live oil–impure CO2 systems are determined to be 17.5, 24.1, and 28.1 MPa at T = 53.0 °C if CH4 content increases from 0.10, 0.35, to 0.50 in mole fraction. Obviously, the addition of CH4 can significantly increase the MMP, plus the high feed ratio of injection gas to oil (i.e., 0.90![[thin space (1/6-em)]](https://www.rsc.org/images/entities/char_2009.gif) :
:![[thin space (1/6-em)]](https://www.rsc.org/images/entities/char_2009.gif) 0.10 in mole fraction) maximizes the effect of injection gas composition. In comparison with CO2, CH4 has a much lower solubility in the oil and a rather weaker ability for light and intermediate-HC extractions.33 Thus the addition of CH4 into a pure CO2 sample can severely prevent the two-way mass transfer between the oil and gas phases and result in a lower rate of IFT/interfacial thickness reduction with pressure as well as a higher MMP.
0.10 in mole fraction) maximizes the effect of injection gas composition. In comparison with CO2, CH4 has a much lower solubility in the oil and a rather weaker ability for light and intermediate-HC extractions.33 Thus the addition of CH4 into a pure CO2 sample can severely prevent the two-way mass transfer between the oil and gas phases and result in a lower rate of IFT/interfacial thickness reduction with pressure as well as a higher MMP.
With the above-mentioned MMPs of the Pembina and Bakken live oil–impure CO2 systems at T = 53.0 °C, the effects of injection gas composition on the MMPs are compared in Fig. 10. On a basis of the data points in this figure, the MMPs are linearly correlated to the amount of CH4 addition in an impure CO2 sample in mole fraction:
| MMP/MPa = 34.9651yCH4 + 13.7321 Pembina live oil–impure CO2 system | (9) |
| MMP/MPa = 26.5056yCH4 + 14.8176 Bakken live oil–impure CO2 system | (10) |
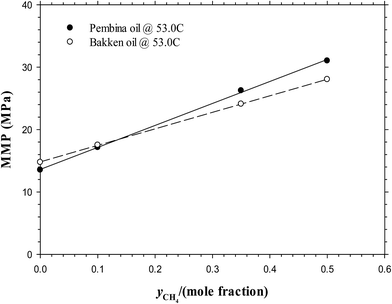 | ||
| Fig. 10 Predicted minimum miscibility pressures of the Pembina live oil and Bakken live oil–pure and impure CO2 systems with different CH4 contents (yCH4 = 0, 0.10, 0.35, 0.50) at T = 53.0 °C. | ||
The above two correlations show that the MMP is rather sensitive to the CH4 content in gas phase and it is increased linearly with CH4 content up to 0.50 mole fraction. More specifically, the MMP increases linearly with an increasing CH4 content at the approximate rates of 0.3497 MPa and 0.2651 MPa per 0.01 CH4 for the Pembina and Bakken live oil, respectively. It is found that by comparison, the unit change of injection gas composition affects the interfacial properties and MMPs to the most extent among the temperature, initial oil composition, and injection gas composition. Thus it is necessary to control the CH4 content in the injection gas to ensure a miscible CO2 injection in the oilfield application for a tight oil formation. On the other hand, some addition of the intermediate HCs (e.g., C2–C6) into the gas phase may be beneficial for the miscibility development and MMP reduction,34 which is recommended to be implemented in the actual CO2-EOR project for the tight oil formation.
4.4 Effect of feed ratio of injection gas to initial oil
Fig. 11a–d show the predicted IFTs and interfacial thicknesses of the Pembina live oil–pure CO2 system at T = 53.0 °C and four different feed ratios of injection gas to oil, that is, 0.70![[thin space (1/6-em)]](https://www.rsc.org/images/entities/char_2009.gif) :
:![[thin space (1/6-em)]](https://www.rsc.org/images/entities/char_2009.gif) 0.30, 0.50
0.30, 0.50![[thin space (1/6-em)]](https://www.rsc.org/images/entities/char_2009.gif) :
:![[thin space (1/6-em)]](https://www.rsc.org/images/entities/char_2009.gif) 0.50, 0.30
0.50, 0.30![[thin space (1/6-em)]](https://www.rsc.org/images/entities/char_2009.gif) :
:![[thin space (1/6-em)]](https://www.rsc.org/images/entities/char_2009.gif) 0.70, and 0.10
0.70, and 0.10![[thin space (1/6-em)]](https://www.rsc.org/images/entities/char_2009.gif) :
:![[thin space (1/6-em)]](https://www.rsc.org/images/entities/char_2009.gif) 0.90 in mole fraction. In combination of the 0.90
0.90 in mole fraction. In combination of the 0.90![[thin space (1/6-em)]](https://www.rsc.org/images/entities/char_2009.gif) :
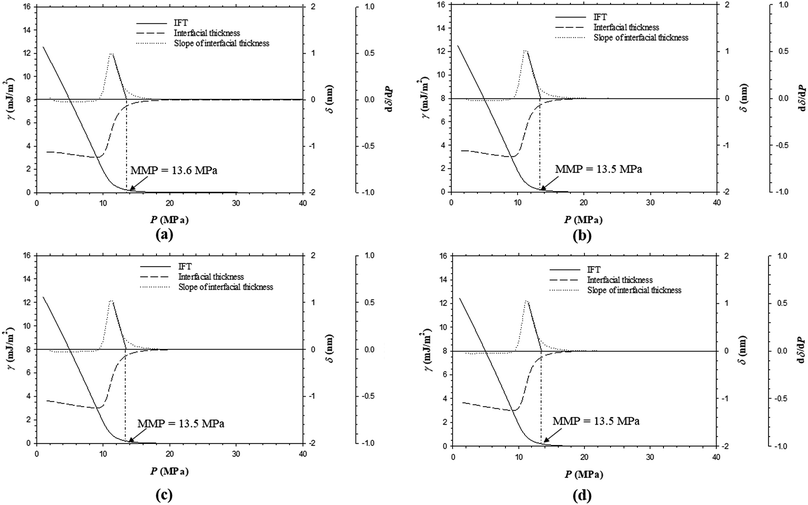
:![[thin space (1/6-em)]](https://www.rsc.org/images/entities/char_2009.gif) 0.10 case from Fig. 3c, it is found that the IFTs and interfacial thicknesses at the five feed ratios are fairly similar but their rates of reductions with respect to pressure is slightly increased by reducing the feed gas–oil ratio. In Fig. 3c and 11a–d, the MMPs of the Pembina live oil–pure CO2 system are determined to be 13.7, 13.6, 13.5, 13.5, and 13.5 MPa from the DIM at T = 53.0 °C and feed gas–oil ratios of 0.90
0.10 case from Fig. 3c, it is found that the IFTs and interfacial thicknesses at the five feed ratios are fairly similar but their rates of reductions with respect to pressure is slightly increased by reducing the feed gas–oil ratio. In Fig. 3c and 11a–d, the MMPs of the Pembina live oil–pure CO2 system are determined to be 13.7, 13.6, 13.5, 13.5, and 13.5 MPa from the DIM at T = 53.0 °C and feed gas–oil ratios of 0.90![[thin space (1/6-em)]](https://www.rsc.org/images/entities/char_2009.gif) :
:![[thin space (1/6-em)]](https://www.rsc.org/images/entities/char_2009.gif) 0.10, 0.70
0.10, 0.70![[thin space (1/6-em)]](https://www.rsc.org/images/entities/char_2009.gif) :
:![[thin space (1/6-em)]](https://www.rsc.org/images/entities/char_2009.gif) 0.30, 0.50
0.30, 0.50![[thin space (1/6-em)]](https://www.rsc.org/images/entities/char_2009.gif) :
:![[thin space (1/6-em)]](https://www.rsc.org/images/entities/char_2009.gif) 0.50, 0.30
0.50, 0.30![[thin space (1/6-em)]](https://www.rsc.org/images/entities/char_2009.gif) :
:![[thin space (1/6-em)]](https://www.rsc.org/images/entities/char_2009.gif) 0.70, and 0.10
0.70, and 0.10![[thin space (1/6-em)]](https://www.rsc.org/images/entities/char_2009.gif) :
:![[thin space (1/6-em)]](https://www.rsc.org/images/entities/char_2009.gif) 0.90 in mole fraction, respectively. It is found that the MMPs remain almost constant at different feed gas–oil ratios. More precisely, the MMP of the Pembina live oil–pure CO2 system is slightly decreased with a reduction of feed gas–oil ratio until it reaches 0.50
0.90 in mole fraction, respectively. It is found that the MMPs remain almost constant at different feed gas–oil ratios. More precisely, the MMP of the Pembina live oil–pure CO2 system is slightly decreased with a reduction of feed gas–oil ratio until it reaches 0.50![[thin space (1/6-em)]](https://www.rsc.org/images/entities/char_2009.gif) :
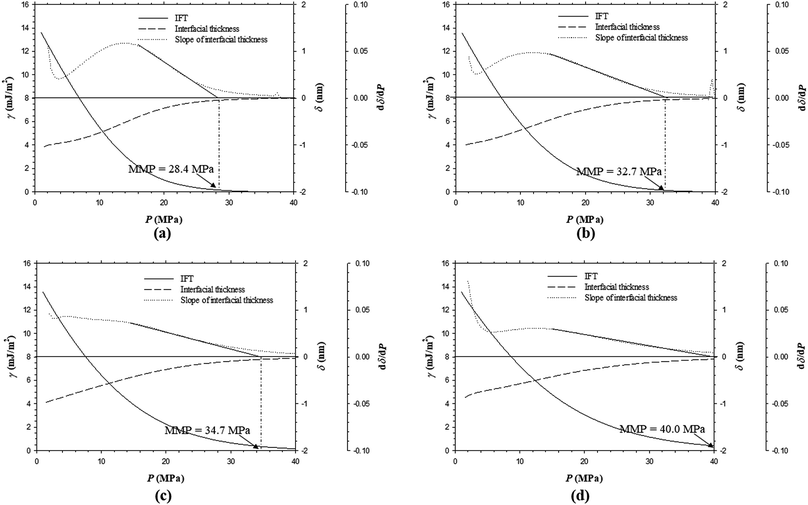
:![[thin space (1/6-em)]](https://www.rsc.org/images/entities/char_2009.gif) 0.50 in mole fraction, below which the MMP becomes independent of the feed gas–oil ratio. In addition, the predicted IFTs and interfacial thicknesses of the Pembina live oil–impure CO2 (0.65 mol% CO2 + 0.35 mol% CH4) system at T = 53.0 °C and the same four different feed gas–oil ratios are shown in Fig. 12a–d. It is found from Fig. 8b and 12a–d that the rates of the IFT and interfacial thickness reductions with respect to the pressure are obviously decreased if the feed gas–oil ratio changes from 0.90
0.50 in mole fraction, below which the MMP becomes independent of the feed gas–oil ratio. In addition, the predicted IFTs and interfacial thicknesses of the Pembina live oil–impure CO2 (0.65 mol% CO2 + 0.35 mol% CH4) system at T = 53.0 °C and the same four different feed gas–oil ratios are shown in Fig. 12a–d. It is found from Fig. 8b and 12a–d that the rates of the IFT and interfacial thickness reductions with respect to the pressure are obviously decreased if the feed gas–oil ratio changes from 0.90![[thin space (1/6-em)]](https://www.rsc.org/images/entities/char_2009.gif) :
:![[thin space (1/6-em)]](https://www.rsc.org/images/entities/char_2009.gif) 0.10 to 0.10
0.10 to 0.10![[thin space (1/6-em)]](https://www.rsc.org/images/entities/char_2009.gif) :
:![[thin space (1/6-em)]](https://www.rsc.org/images/entities/char_2009.gif) 0.90 in mole fraction. Moreover, the MMPs are determined to be 26.3, 28.4, 32.7, 34.7, and 40.0 MPa at T = 53.0 °C and the feed gas–oil ratios of 0.90
0.90 in mole fraction. Moreover, the MMPs are determined to be 26.3, 28.4, 32.7, 34.7, and 40.0 MPa at T = 53.0 °C and the feed gas–oil ratios of 0.90![[thin space (1/6-em)]](https://www.rsc.org/images/entities/char_2009.gif) :
:![[thin space (1/6-em)]](https://www.rsc.org/images/entities/char_2009.gif) 0.10, 0.70
0.10, 0.70![[thin space (1/6-em)]](https://www.rsc.org/images/entities/char_2009.gif) :
:![[thin space (1/6-em)]](https://www.rsc.org/images/entities/char_2009.gif) 0.30, 0.50
0.30, 0.50![[thin space (1/6-em)]](https://www.rsc.org/images/entities/char_2009.gif) :
:![[thin space (1/6-em)]](https://www.rsc.org/images/entities/char_2009.gif) 0.50, 0.30
0.50, 0.30![[thin space (1/6-em)]](https://www.rsc.org/images/entities/char_2009.gif) :
:![[thin space (1/6-em)]](https://www.rsc.org/images/entities/char_2009.gif) 0.70, and 0.10
0.70, and 0.10![[thin space (1/6-em)]](https://www.rsc.org/images/entities/char_2009.gif) :
:![[thin space (1/6-em)]](https://www.rsc.org/images/entities/char_2009.gif) 0.90 in mole fraction, respectively.
0.90 in mole fraction, respectively.
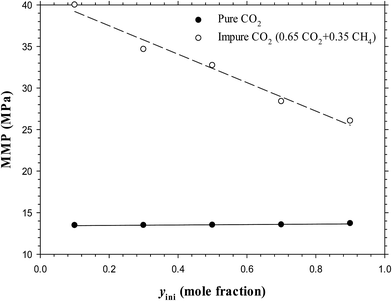
The above-mentioned results are summarized in Table 3 and plotted in Fig. 13. Hence, it is concluded from the figure that at a constant temperature, the effects of the feed gas–oil ratio on the IFTs, interfacial thicknesses, and MMPs with the pure CO2 injection is negligible, especially at low feed gas–oil ratios (less than 0.50![[thin space (1/6-em)]](https://www.rsc.org/images/entities/char_2009.gif) :
:![[thin space (1/6-em)]](https://www.rsc.org/images/entities/char_2009.gif) 0.50). However, the IFTs, interfacial thicknesses, and MMPs of the impure CO2 case are strongly dependent on the feed gas–oil ratio. More specifically, the MMP is considerably increased if the feed gas–oil ratio reduces from 0.90
0.50). However, the IFTs, interfacial thicknesses, and MMPs of the impure CO2 case are strongly dependent on the feed gas–oil ratio. More specifically, the MMP is considerably increased if the feed gas–oil ratio reduces from 0.90![[thin space (1/6-em)]](https://www.rsc.org/images/entities/char_2009.gif) :
:![[thin space (1/6-em)]](https://www.rsc.org/images/entities/char_2009.gif) 0.10 to 0.10
0.10 to 0.10![[thin space (1/6-em)]](https://www.rsc.org/images/entities/char_2009.gif) :
:![[thin space (1/6-em)]](https://www.rsc.org/images/entities/char_2009.gif) 0.90 in mole fraction. Thus in the oilfield application for a tight oil formation, a lower feed gas–oil ratio (i.e., smaller than 0.50
0.90 in mole fraction. Thus in the oilfield application for a tight oil formation, a lower feed gas–oil ratio (i.e., smaller than 0.50![[thin space (1/6-em)]](https://www.rsc.org/images/entities/char_2009.gif) :
:![[thin space (1/6-em)]](https://www.rsc.org/images/entities/char_2009.gif) 0.50 in mole fraction) is suggested for a pure CO2 injection project, whereas a higher feed gas–oil ratio is preferred for a mixed CO2–CH4 gas injection.
0.50 in mole fraction) is suggested for a pure CO2 injection project, whereas a higher feed gas–oil ratio is preferred for a mixed CO2–CH4 gas injection.
5. Conclusions
The following seven major conclusions can be drawn from this work:• The modified Peng–Robinson equation of state (PR-EOS) coupled with the parachor model is found to be accurate for vapour–liquid equilibrium (VLE) calculations and interfacial tension (IFT) predictions in nanopores.
• A thermodynamic formula of the interfacial thickness between two mutually soluble phases is derived, based on which the novel diminishing interface method (DIM) is developed. The minimum miscibility pressure (MMP) at the pore radius of 10 nm is determined by extrapolating (∂δ/∂P)T to zero.
• A higher temperature results in a higher IFT/interfacial thickness and a lower rate of the IFT/interfacial thickness reduction in nanopores. The MMPs of the Pembina and Bakken live oil–pure CO2 systems linearly increase with temperature. The MMPs of the Pembina live oil case are determined to be 7.0, 8.5, 13.7, 22.5, and 29.7 MPa at T = 15.6, 30.0, 53.0, 80.0, and 116.1 °C, respectively. The determined MMPs of the Bakken live oil case at T = 53.0 and 116.1 °C are 14.5 and 30.7 MPa.
• The effects of initial oil composition on the IFTs, interfacial thicknesses, and MMPs are measurable but marginal in nanopores. The MMP increases from 11.6 to 13.7 MPa at T = 53.0 °C and from 26.5 to 29.7 MPa at T = 116.1 °C when the oil sample is changed from Pembina dead to live oil. It is found that the MMP is more sensitive to the initial oil composition at a higher temperature and the pore radius of 10 nm.
• The IFTs and interfacial thicknesses are weakly but the MMPs are strongly dependent on the injection gas composition. The IFTs and interfacial thicknesses for the Pembina and Bakken oil cases at T = 53.0 °C have a slightly decreasing rate of reduction with respective to pressure if CH4 content increases from 0.10, 0.35, to 0.50, whereas the MMPs substantially increase from 17.2, 26.3, to 31.0 MPa for the Pembina live oil and from 17.5, 24.1, to 28.1 MPa for the Bakken live oil.
• The effects of the feed gas–oil ratio on the IFTs, interfacial thicknesses, and MMPs are found to be negligible with pure CO2 injection, especially at low feed gas–oil ratios (less than 0.50![[thin space (1/6-em)]](https://www.rsc.org/images/entities/char_2009.gif) :
:![[thin space (1/6-em)]](https://www.rsc.org/images/entities/char_2009.gif) 0.50), but become much stronger for the impure CO2 injection. The MMP of the Pembina live oil–0.65CO2 + 0.35CH4 system increases from 26.3 to 40.0 MPa when the feed gas–oil ratio reduces from 0.90
0.50), but become much stronger for the impure CO2 injection. The MMP of the Pembina live oil–0.65CO2 + 0.35CH4 system increases from 26.3 to 40.0 MPa when the feed gas–oil ratio reduces from 0.90![[thin space (1/6-em)]](https://www.rsc.org/images/entities/char_2009.gif) :
:![[thin space (1/6-em)]](https://www.rsc.org/images/entities/char_2009.gif) 0.10 to 0.10
0.10 to 0.10![[thin space (1/6-em)]](https://www.rsc.org/images/entities/char_2009.gif) :
:![[thin space (1/6-em)]](https://www.rsc.org/images/entities/char_2009.gif) 0.90 in mole fraction.
0.90 in mole fraction.
• For a miscible CO2 injection project in the tight formation, the following strategies are effective to enhance tight oil recovery: a lower reservoir temperature, some additions of intermediate hydrocarbons (e.g., C2–C6) into the injection gas sample, and a lower feed gas–oil ratio for pure CO2 injection or a higher ratio for impure CO2 injection.
Conflicts of interest
There are no conflicts to declare.Acknowledgements
The authors would like to acknowledge the Petroleum Systems Engineering at the University of Regina. They also want to acknowledge the financial supports from Petroleum Technology Research Centre (PTRC) and Mitacs Canada to Dr Na Jia.References
- B. Wu, L. Jiang, M. Yang, D. Wang, P. Lv and Y. Song, RSC Adv., 2016, 6, 59360–59369 RSC.
- J. J. Trivedi and T. Babadagli, Energy Fuels, 2009, 23, 4025–4036 CrossRef CAS.
- W. Yang, L. Zhang, Y. Liu, L. Jiang, M. Yang, Z. Wang, D. Wang and Y. Song, RSC Adv., 2015, 5, 34839–34853 RSC.
- O. I. Rio and A. W. Neumann, J. Colloid Interface Sci., 1997, 196, 136–147 CrossRef PubMed.
- D. B. Macleod, Trans. Faraday Soc., 1923, 19, 38–42 RSC.
- L. P. Cheng and C. C. Gryte, Macromolecules, 1992, 25, 3293–3294 CrossRef CAS.
- Q. Shi, L. Jing and W. Qiao, J. CO2 Util., 2016, 12, 47–60 Search PubMed.
- K. Zhang and Y. Gu, Fuel, 2015, 161, 146–156 CrossRef CAS.
- Q. Shang, S. Xia, M. Shen and P. Ma, RSC Adv., 2014, 4, 63824–63830 RSC.
- A. K. Moghaddam and A. H. S. Dehaghani, Ind. Eng. Chem. Res., 2017, 56, 7375–7383 CrossRef.
- A. Fazlali, M. Nikookar, A. Agha–Aminiha and A. H. Mohammadi, Fuel, 2013, 108, 675–681 CrossRef CAS.
- J. N. Jaubert, L. Wolff, E. Neau and L. Avaullee, Ind. Eng. Chem. Res., 1998, 37, 4854–4859 CrossRef CAS.
- R. Czarnota, D. Janiga, J. Stopa and P. Wojnarowski, J. CO2 Util., 2017, 17, 32–36 CrossRef CAS.
- S. B. Hawthorne, D. J. Miller, L. Jin and C. D. Gorecki, Energy Fuels, 2016, 30, 6365–6372 CrossRef.
- Y. Gu, P. Hou and W. Luo, J. Chem. Eng. Data, 2013, 58, 1361–1370 CrossRef CAS.
- M. Escrochi, N. Mehranbod and S. Ayatollahi, J. Chem. Eng. Data, 2013, 58, 2513–2526 CrossRef CAS.
- A. Hemmati-Sarapardeh, S. Ayatollahi, M. H. Ghazanfari and M. Masihi, J. Chem. Eng. Data, 2014, 59, 61–69 CrossRef CAS.
- E. Mahdavi, F. S. Zebarjad, V. Taghikhani and S. Ayatollahi, J. Chem. Eng. Data, 2014, 59, 2563–2569 CrossRef CAS.
- D. N. Rao and J. I. Lee, J. Pet. Sci. Eng., 2002, 35, 247–262 CrossRef CAS.
- K. Zhang and Y. Gu, Fuel, 2016, 184, 136–144 CrossRef CAS.
- L. Wang, E. Parsa, Y. Gao, J. T. Ok, K. Neeves, X. Yin and E. Ozkan, Presented at the SPE Western North American and Rocky Mountain Joint Regional Meeting, Denver, CO, April 16–18 2014 Search PubMed.
- L. Travalloni, M. Castier, F. W. Tavares and S. I. Sandler, Chem. Eng. Sci., 2010, 65, 3088–3099 CrossRef CAS.
- G. J. Zarragoicoechea and V. A. Kuz, Fluid Phase Equilib., 2004, 220, 7–9 CrossRef CAS.
- X. Dong, H. Liu, J. Hou, K. Wu and Z. Chen, Ind. Eng. Chem. Res., 2016, 55, 798–811 CrossRef CAS.
- T. W. Teklu, N. Alharthy, H. Kazemi, X. Yin, R. M. Graves and A. M. AlSumaiti, SPE Reservoir Eval. Eng., 2014, 17, 396–403 Search PubMed.
- B. Nojabaei, R. T. Johns and L. Chu, SPE Reservoir Eval. Eng., 2013, 16, 281–289 CrossRef CAS.
- K. Zhang, MASc thesis, University of Regina, 2016.
- S. Sugden, J. Chem. Soc., Trans., 1924, 125, 32–41 RSC.
- C. Yang and D. Li, Colloids Surf., A, 1996, 113, 51–59 CrossRef CAS.
- J. Zhang, Z. Pan, K. Liu and N. Burke, Energy Fuels, 2013, 27, 2741–2747 CrossRef CAS.
- J. P. Johnson and J. S. Pollin, Proceeding of the SPE/DOE Symposium on Enhanced Oil Recovery, Tulsa, OK, 1981 Search PubMed.
- C. G. Xu and X. S. Li, RSC Adv., 2015, 5, 54672–54699 RSC.
- Y. Liu, D. Mu and C. Dai, RSC Adv., 2014, 4, 54525–54531 RSC.
- T. A. Mobley, C. Schade and R. G. Bergman, J. Am. Chem. Soc., 1995, 117, 7822–7823 CrossRef CAS.
Footnote |
| † Electronic supplementary information (ESI) available. See DOI: 10.1039/c7ra10671h |
| This journal is © The Royal Society of Chemistry 2017 |


