 Open Access Article
Creative Commons Attribution 3.0 Unported Licence
TiO2 hollow spheres on reduced graphene oxide with high rate performance as anodes for lithium-ion batteries†
Jicai Liangb,
Xunlong Zhanga,
Xiaojie Zhaia,
Longjian Zhangc,
Wenzheng Wu*c and
Kaifeng Yu *a
*a
aKey Laboratory of Automobile Materials, Ministry of Education, College of Materials Science and Engineering, Jilin University, Changchun 130025, China. E-mail: yukf@jlu.edu.cn
bRoll Forging Institute of Jilin University, Changchun 130022, China
cSchool of Mechanical Science and Engineering, Jilin University, China. E-mail: wzwu@jlu.edu.cn
First published on 17th November 2017
Abstract
Anatase TiO2 anchored on graphene oxide (GO) can be synthesized through a one-step hydrothermal method. The as-formed nanohybrid has a unique hollow structure and a large surface area. More importantly, compared to the pristine TiO2 counterpart, TiO2@RGO composite materials as anodes in lithium-ion batteries have demonstrated a uniform and highly crystallized morphology and exhibited excellent cycling stability and rate capability of 352 mA h g−1 at 0.5C and 223 mA h g−1 at 5C after 100 cycles, indicating that the TiO2@RGO nanocomposite has promise in advanced Li-ion batteries. The improvement of electrochemical performance is assigned to the enhanced conductivity in the presence of GO in the TiO2@RGO nanocomposite, the anatase and TiO2–B mixed crystal phase of the hollow sphere TiO2@RGO nanocomposite, the small size of TiO2 particles in the nanocomposite, and the enlarged electrode/electrolyte contact area, leading to more active sites in TiO2@RGO.
Introduction
Lithium ion batteries (LIBs) have gained growing interest because of their wide applications in portable electronic devices as well as electronic vehicles due to their high capacity, long cycle life and environmental benignity.1–3 Particularly, titanium dioxide (TiO2), has been attracting much attention because of its low price, non-toxicity and low volume expansion (<4%) during the Li-ion insertion–extraction processes.4–6 In addition, owing to the higher Li-ion intercalation potential (1.5–1.8 V versus Li+/Li) of TiO2, the generation of lithium dendrites could be suppressed. Its reaction process can be described properly with the following equation: TiO2 + xLi+ + xe− → 2LixTiO2 (0 ≤ x ≤ 0.5). However, the theoretical capacity of anatase and rutile phase TiO2 is only 168 mA h g−1.7–9 Meanwhile, the reunion and decomposition of TiO2 during charge–discharge cycles can result in the reduction of active sites and the degradation of specific capacity, which definitely hinder the application of TiO2 in LIB anode materials.10 In order to improve electrical and ionic conductivities, adding some conductive materials, for example, carbon nanomaterials, metals, metal oxides and polymers, is a common practice. In this way, we can shorten the transmission distance and decrease the resistance of intrinsic electrons and lithium ions. At same time, different structures of TiO2, such as 1D nanowires or nanotubes, 2D nanosheets and even complicated 3D structures, can get higher capacities and high rate capabilities in the electrodes of lithium ions batteries based on following reason: higher surface area which is beneficial to increase the contact area between electrolyte and electrode, resulting in an excellent cycling performance of electrode materials.Compared with conventional conductive additives, graphene, with a ultrathin two-dimensional carbon sheet, has lots of unique properties, for example, high electronic conductivity, large specific surface area and high structural flexibility.11–13 Due to the TiO2 loading on the graphene showed excellent electrochemical performance such as high rate capacity, shortened transport length of electrons, and enhanced contact area of electrolyte–electrode, TiO2/GO nanocomposites have been achieving a wide attention for exploring Li storage based on above advantages.14–16 Li et al. adopted the hydrothermal method to fabricate mesoporous anatase TiO2 nanospheres anchoring onto graphene sheets, which demonstrated a reversible capacity of 200 mA h g−1 at the rate of 1C after 100 cycles.17 Zhen et al. used hydrothermal process to construct mesoporous structure TiO2/RGO hybrid materials, which possessed an excellent capacity retention about 260 mA h g−1 at 1.2C after 400 cycles.18 However, most of their experimental process are quiet complex and are not easily operated in the practical application. Therefore, exploring a simple, facile and easy-to-handle method to synthesize well-dispersed TiO2/GO hybrid anode materials which possessed properties of structural stability and great performance is particularly important.
In this paper, we propose a simple strategy to fabricate nanostructured hollow spheres TiO2@RGO anode materials which make nanocrystalline TiO2 grown in situ on graphene via a facile template-free one-step followed by calcinations.
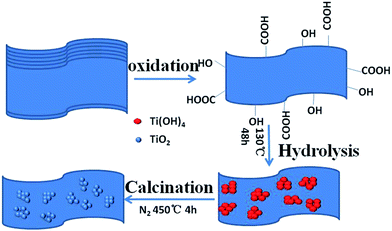
Compared with the reported hydrothermal–solvothermal routes, the current experiment schemes were performed without addition of any surfactants. It only use tetrabutyl titanate(Ti(OR)4), LiOH and GO as the raw materials. What is novel about our work is that there are few literatures on the synthesizing nanostructured hollow spheres TiO2@RGO electrode used TBT as precursor via template-free one-step in situ method which was deployed in LIBs. It delivers the characteristics of hollow structures with large surface area and highly mesoporous structures. We significantly improve the electrochemical performance of anode materials and preparation procedures of TiO2@RGO composite materials. As a result, the excellent electrochemical performance of as-prepared TiO2@RGO electrode materials shows its great potential values in advanced Li-ion batteries under a high-rate current density. Scheme 1 illustrates the synthesis process of the TiO2@RGO nanocomposite.
Experiment
Preparation of GO
Graphene oxide was prepared via the oxidation of graphene by applying improved Hummers' method.44Preparation of nanostructure TiO2@RGOcomposites
In a typical synthetic procedure, 50 mg GO was dissolved in 30 mL solution containing 5.0 g LiOH, followed by ultrasound for 2 h. Then, 2 mL tetrabutyl titanate (TBT) was dispersed into the above solution drop by drop along with vigorous agitation for 30 min and ultrasounded for another two hours. Thereafter, the mixture was placed into a 50 mL Teflon-lined autoclave and maintained at 130 °C for 48 h. After naturally cooled to room temperature, the obtained products were soaked in 0.1 M H2SO4 solution for some time, centrifuged and washed several times by distilled water and ethanol until the pH value was close to 7, then dried at 60 °C in oven for 24 h and annealed at 450 °C for 4 h under nitrogen to get the final product, namely, the TiO2-reduced graphene oxide (termed as TiO2@RGO) nanocomposite. The fabrication of the pure TiO2 nanoparticles, a similar process was proceeded without the addition of GO in the original solution.Material characterizations
The X-ray diffraction (XRD) patterns were carried out on a Bruker D8 Advance X-ray Diffractometer. Raman spectroscopy (Renishaw, 633 nm excitation) was used to characterize the interaction among of TiO2 and GO. Structure and morphology of TiO2@RGO-Nd nanohybrid, the TiO2@RGO and the pure TiO2 were observed by a transmission electron microscope (TEM; JSM-2100F) and a Cold Field Scanning electron microscope (SEM; JSM-7500F). Nitrogen adsorption/desorption tests were conducted at Brunauer–Emmett–Teller (BET) measurements (JW-BK222 surface area analyzer).Electrochemical measurements
The electrochemical measurements were carried out with two-electrode CR2025 coin cells. The working electrode was prepared by mixing 80 wt% active material (TiO2@RGO), 10 wt% carbon black and 10 wt% polyvinylidene fluoride (PVDF). Then the mixture was dissolved in N-methyl-2-pyrrolidone under stirring. The slurry was coated onto a Cu foil and dried at 120 °C for 12 h. The loading mass of active material was approximately 0.43 mg cm−2. The electrochemical measurements were carried out with two-electrode CR2025 coin cells. The lithium foil was used as the counter and reference electrodes, Celgard 2300 as the separator and 1 M LiPF6 as the electrolyte. Constant current charge–discharge tests were carried out on a Land Battery Measurement System (CT2001A) at various current densities with a cut off voltage of 1–2.5 V at room temperature. Cyclic voltammograms (CV) at a scan rate of 0.2 mV s−1 and electrochemical impedance spectra over a frequency range of 100 kHz to 0.1 Hz were measured on a CHI660E electrochemical work station at room temperature.Results and discussion
Morphology and structural characterization
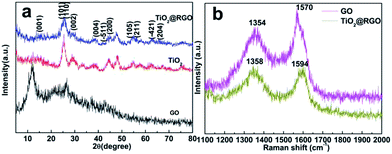
The crystallographic structure of the samples can be provided by X-ray diffraction (XRD) patterns. As shown in Fig. 1a, the pure TiO2 exhibits good crystallinity. The peaks at 25.3°, 37.8°, 48.1°, 55.1° and 62.8° correspond to the lattice planes of (101), (004), (200), (211), (204), respectively,19 indicating that the TiO2 is anatase phase (JCPDS no. 21-1272).20,21 At the same time, the XRD patterns of the TiO2@RGO nanocomposite retain the same position of the diffraction peaks.However, the diffraction peaks of the TiO2 in the TiO2@RGO nanocomposite become broader and lower, demonstrating a small crystallite size. Meanwhile, the XRD spectrums of hybrid nanocomposite and pure TiO2 all display a typical TiO2–B diffraction peaks (space group C2/m, JCPD no. 35-0088) at 14.3°, 25.0°, 28.7°, 44.7° and 58.4° corresponding to the (001), (110), (002), (−511), (−421) reflections, respectively.22 The skeleton of the TiO2–B structure is consisted of corrugated sheets of edge and corner-sharing TiO6 octahedra that are linked by bridging oxygen atoms, formed a three-dimensional network. This nanostructure is more open than those of rutile and anatase, which makes the material an effective host for lithium ions storage.23,24 One diffraction peak centered at 2θ = 11.41° corresponds to the (001) reflection of GO with an interlayer spacing of 7.75 Å.25 The peak disappeared in the following compound process, indicating that the GO nanosheets have been completely reduced to RGO nanosheets using the current hydrothermal treatment. In the same position, the TiO2@RGO nanocomposite don't have the characteristic peaks of GO, showing that the TiO2 uniformly dispersed on the GO nanosheets. Fig. 1b shows the Raman spectra of GO before and after deposition of TiO2. The GO exhibited Raman shifts at approximately 1354 and 1570 cm−1 corresponding to the D and G bands, respectively. After heat-treatment at 450 °C, the D and G bands of TiO2@RGO located at about 1358 and 1594 cm−1. The intensity of D band to G band (ID/IG) for the TiO2@RGO (1.06) is a bit higher than that of GO (0.85). The intensity of D band to G band (ID/IG) for the TiO2@RGO (1.06) is a bit higher than that of GO (0.85), indicating the reduction of GO in the TiO2@RGO nanocomposite.
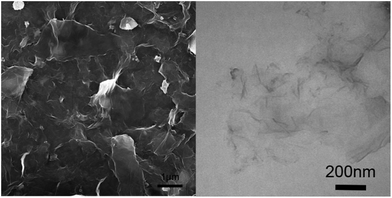
When TBT was added into GO sheets, the TiO2 nanoparticles homogeneously anchored on RGO nanosheets. The morphology of TiO2@RGO hybrid electrode material, GO and pure TiO2 were observed via scanning electron microscopy (SEM). It can be clearly seen that GO has a wrinkled flake-like structure in Fig. 2a and b, which is in accorded with the results in the recent article.45,46 As shown in the Fig. 3a and c, the TiO2 were regularly spherical. Fig. 3c shows that the TiO2 nanospheres are well-dispersed and uniformly attached on the surface of the RGO nanosheets. The TiO2 exhibited good dispersibility in the pure phase and composite electrode materials. To further explore the microstructure of the materials, the products were investigated by transmission electron microscopy (TEM). It can be seen that the TiO2 exhibits a hollow sphere structure with uniform particle size in Fig. 3b. The hollow structure of the TiO2 nanocomposite remained unchanged as shown in Fig. 3d. There is no structure collapse before and after the composite. The hollow structure can be seen clearly in Fig. 3b and d. The wall thickness of TiO2 hollow nanostructures is about 2–4 nm. The TiO2 possesses nearly spherical structure with the size of particle about 10 nm and deliver good features, such as more stable, active site distribution more uniform, high specific surface area, wall thickness in 2–4 nm, which are contribute to the ions and electrons transfer, beneficial to the improvement of the capacity. The combination of TiO2 materials with such structure advantages and graphene materials will greatly increase the performance of TiO2 as anode material. The selected area electronic diffraction nanostructure pattern (SAED) of the hollow spheres TiO2@RGO nanostructure delivers a set of diffraction rings of the anatase and TiO2–B structure of the TiO2, indicating the polycrystalline nature of the products, which can be clearly assigned to the anatase TiO2 and TiO2–B, respectively. This result is consistent with the XRD results. As shown in Fig. 3d, the TiO2@RGO composites, in which the hollow spheres were uniformly and well dispersedly attached on the surface of RGO sheets. Fig. 3e is the High-Resolution TEM(HRTEM) image of TiO2@RGO. As shown in Fig. 3e, the lattice fringes with the spaces of 0.35 nm and 0.62 nm correspond to the (101) and (001) of anatase TiO2 and TiO2–B, respectively. Elemental mapping and EDX spectrum for TiO2@RGO nanocomposite are also shown in Fig. S1 (in the ESI†). The corresponding element mapping images (Fig. S1†) of C, Ti, and O in the TiO2@RGO nanocomposite overlapped with each other, indicating the uniform distribution of these elements and the nanohollow sphere TiO2 are evenly distributed across the surfaces of rGO. The corresponding EDX of the selected area is also depicted in Fig. S1e,† which agrees well with the mapping results, except for the Si peaks that originated from silicon substrate. Based on the EDS elements mapping analysis, we confirm that it has a unique hollow structure.
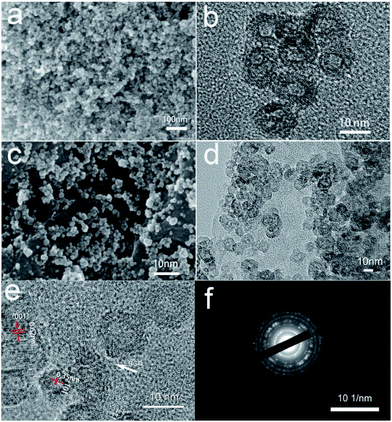 | ||
| Fig. 3 SEM (a) and TEM (b) images of pure TiO2, SEM (c) and TEM (d) images of TiO2@RGO nanocomposite, HRTEM (e) and SAED (f) images of TiO2@RGO. | ||
Nitrogen isotherm adsorption–desorption curves with the pore size distributions of the pristine TiO2 and TiO2@RGO are presented in Fig. 4a and b. For TiO2@RGO, a type IV isotherm is observed, which is characteristic of mesoporous materials.49 Based on the Barrett–Joyner–Halenda (BJH) equation, the main pore size (inset in Fig. 4b) in TiO2@RGO is 8.5 nm less than 11.6 nm of the pure TiO2(inset in Fig. 4a). It is in agreement with the pore size determined from the TEM images and the results described in the XRD, which further confirms a uniform pore size distribution. Compared to the specific surface area (105.5 m2 g−1) of the TiO2, the specific surface area of TiO2@RGO is 145.8 m2 g−1. The larger surface area of TiO2@RGO is conductive to increasing contact area of electrode–electrolyte and can improve diffusion of electrolyte ions.
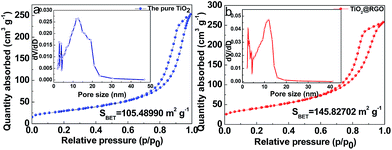 | ||
| Fig. 4 Nitrogen isotherm adsorption–desorption curves of (a) the pure TiO2 and (b) TiO2@RGO. The inset in (a) and (b) show pore-size distributions of the pure TiO2 and TiO2@RGO. | ||
The electrochemical performance of the prepared pure TiO2 and TiO2@RGO materials were investigated as electrode for LIBs. Fig. 5a and b shows the discharge–charge curves of the pure TiO2 and TiO2@RGO at a rate of 0.5C (1C = 168 mA h g−1) in the potential window of 1.0–2.5 V versus Li+/Li in the 1st, 2nd, 10th, 50th and 100th. The initial discharge–charge capacities of the pure TiO2 were 570/399 mA h g−1, and subsequently deceased to just 223 mA h g−1 after 100 cycles. As a comparison, the TiO2@RGO hybrid nanocomposite obtained higher capacities with 634/388 mA h g−1 at the first cycle. The columbic efficiency of the pure TiO2 and TiO2@RGO is comparatively low in the first cycle, which can be attributed to the existence of irreversible Li trapped sites.26 There are two obvious plateaus at 1.75 V and 1.95 V, corresponding to Li+ insertion and Li+ extraction between the TiO2 nanoparticles and Li0.5TiO2, which meet the characteristics of anatase TiO2 lithiation.47,48 Meanwhile, it is obvious to see that there are huge differences of plateau voltage between pure TiO2 and TiO2@RGO hybrid electrode, indicating that the TiO2@RGO nanocomposites possessed excellent reaction kinetics and low polarization. Compared with TiO2@RGO electrode, the redox potential plateaus of pure TiO2 is getting smaller and smaller until it disappeared in the end because of its bigger size and inherently bad electronic conductivity. Fig. 5c and d depicts the cycling performance of the pristine TiO2 and TiO2@RGO electrode at a rate of 0.5C and 5C. Just as showed in Fig. 5d, the TiO2@RGO hybrid composite displays excellent reversible capacity and cycle characteristics. The results demonstrated that the TiO2@RGO electrode obtained high reversible capacity of 352 mA h g−1 (0.5C) and 223 mA h g−1 (5C) up to 100 cycles, which were higher than that of anode materials composed of anatase TiO2 nanospheres/hollow structures, rutile TiO2 nanorods/porous microspheres/nanoparticles, etc.27–32 At the same time, the initial discharge–charge capacities of pure anatase TiO2 were 570/399 mA h g−1, which demonstrate that the pure phase TiO2 has high specific capacity. The first discharge capacity of TiO2 is about 570 mA h g−1, a value much higher than the theoretical capacity of TiO2. It can be explained that the specific surface area of pure TiO2 is 105.5 m2 g−1 and the specific surface area of TiO2@rGO is more than 145.8 m2 g−1. The large specific surface area plays an important role in the consumption of lithium ion at initial discharge process. At the same time, the formation of the SEI film will consume a large amount of lithium ion. The reasons for the above statement will lead to the increase of capacity. Subsequently, discharge capacities of pure anatase TiO2 quickly decreased to 129 mA h g−1 at 5C and about 223 mA h g−1 at 0.5C (after 100 cycles) accompanied by capacities rose and downed which could be attributed to the activation and the structure collapsed of active materials.33 Meanwhile, on the other hand, we can see that the pure TiO2 electrode has the potential value based on its high initial capacities. Compared with pure TiO2 electrode, TiO2@RGO shown a higher rate performance and ultra long cycle life for lithium storage, which could be attributed to its unique hollow nanostructure, relatively large surface areas (the particle size of sample is about 8.5 nm). Also, RGO nanosheets can benefit to restraining grain growth and inhabit anatase TiO2 aggregation. Fig. 6 shows the rate performance of the pure TiO2 and TiO2@RGO hybrid composites at different rates. When cycled at the rate of 0.5, 1, 2 and 5C, the reversible discharge capacities of the pure TiO2 were 263, 229, 198, and 147 mA h g−1, respectively. Compared with pure TiO2 electrode, the TiO2@RGO hybrid composites owned higher reversible capacities of 585, 509, 434, 354 mA h g−1, respectively. Especially, there are no obvious capacity recession when the rate returned to 2, 1 and 0.5C, which demonstrated that TiO2@RGO hybrid composites possess excellent electrochemical properties even at high rates due to the superiority of taken experimental methods and unique features of hybrid nanostructure. The performance of TiO2@RGO hybrid composites were superior to other the report results.34,35 As a typical example, Lee et al. fabricated TiO2 nanorod arrays on RGO as LIB anodes, and the capacity was only 94 mA h g−1 at 5C less than the capacity of 354 mA h g−1 at 5C in this article.36 In order to verify the characteristics of the synthesized electrode materials, the electrochemical performance of the nanohybrid was analyzed by the charge/discharge cycle at a high rate. As shown in Fig. 6b, the charge–discharge curve was well fitted and the capacity remained at 217 mA h g−1 at a rate of 10C after 2000 cycles, indicating a good capacity retention, high specific capacity, good cycle reversibility and stability of the material.
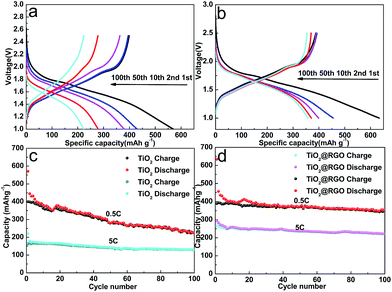 | ||
| Fig. 5 Discharge–charge profiles of (a) pure TiO2 and (b) TiO2@RGO; cycling performance of (c) pure TiO2 and (d) TiO2@RGO at 0.5C and 5C. | ||
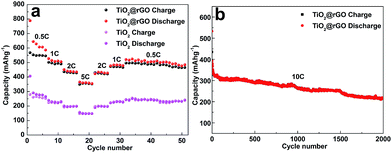 | ||
| Fig. 6 (a) Rate performance of TiO2@RGO nanocomposite and pure TiO2 at various current densities between 0.5C and 5C. (b) Durability test at high 5C and 10C currents of the TiO2@RGO at 5C and 10C. | ||
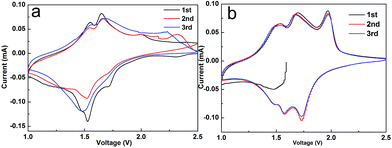
In order to further explore the synergistic effects of RGO nanosheets and the pristine TiO2, the CV curve was tested for the first three cycles of the Li-ion half-cell at a voltage range of 1–2.5 V vs. Li/Li+ at a scanning speed of 0.1 mV s−1. As shown in the figure, hybrid TiO2@RGO spectrums have three pairs of obvious oxidation (insertion) and deoxidization (extraction) peaks, with the first red-ox peaks of 1.49/1.54, 1.57/1.68 and 1.73/1.98 V, respectively. The second and third cycles of red-ox peaks correspond to 1.49/1.54, 1.57/1.68, 1.73/1.98 V. The red-ox peaks appearing on the first cycle are shifted relative to the second and third cycle, which is due to the initial decomposition of the electrolyte in the hybrid electrode and the formation of the mesophase of the solid electrolyte interphase (SEI).37,38 The pair of cathodic/anodic peaks at 1.73/1.98 V correspond to the anatase TiO2 electrode. The relatively weak peaks at 1.49/1.54 and 1.57/1.68 V correspond to the red-ox peaks for Li/Li+ embedded/out in the TiO2–B, indicating the content of Li/Li+ is relatively less than that of anatase TiO2. It agrees with the results of XRD analysis. The CV curve of the first cycle and the next two cycles CV spectrums suggest the first irreversible charge–discharge capacity of hybrid electrode and lost capacity (Fig. 7). The second and third CV curves are well overlapped, which indicate that the hybrid electrode has excellent cycle performance, high reversibility and good capacity retention.
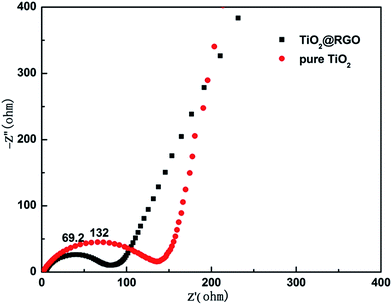
To gain insight into the remarkable rate performance of the TiO2@RGO composites, electrochemical impedance spectroscopy (EIS) was performed on the cells consisting of pure TiO2 and TiO2@RGO composites as the working electrode vs. Li without discharge and charge cycles before cycles. Fig. 8, the Nyquist plots display an inclined line in the low-frequency range and only one semicircle in the high-frequency range. The inclining line and high frequency oblate semicircle correspond to the Li+ diffusion process and charge-transfer impedance in the electrode/electrolyte interface, respectively.39 Compared with pure TiO2 (132 Ω), TiO2@RGO nanostructure has a smaller resistance value of 69.2 Ω that can effectively improve the electron transport.
The enhanced lithium storage performance could be assigned to the following reasons. On the one hand, the fabrication of the anatase TiO2 itself has a unique hollow crystal nanostructure that facilitate the Li ion diffusion owing to the open channels and the shortened transport pathways, a small grain size (less than 10 nm) and a large surface that which benefits to the contact area between the electrode and the electrolyte. On the other hand, the functional active groups on the surface of RGO nanosheets, such as –OH, –COOH, are conductive to adhesion of the hollow anatase TiO2 which can reduce the aggregation of TiO2 and make the TiO2 obtain a good dispersibility. At the same time, it benefits the combination of RGO nanosheets and the hollow anatase TiO2 that can achieve a more stable hybrid nanostructure composite. The aggregation of TiO2 and stacking of GO can be effectively prevented, leading to good cycling performance. Last but not least, the conductivity of RGO nanosheets with large surface and the layered structure is an effective tool for solving the poor electrical conductivity of pure TiO2, enhancing the quality of the electrode–electrolyte contact, providing abundant nanoporous channels for Li+/electron transfer and preventing the aggregation of anatase TiO2.40–43 The synergistic effect of nanostructured TiO2 and RGO is a main factor for the superior rate capability and excellent cycle ability of the TiO2@RGO nanohybrid.
Conclusions
We have developed a facile in situ hydrothermal synthesis approach to construct a hollow TiO2@RGO nanohybrid composite. The combination of the TiO2 has an open crystal structure, a small particle size and a large surface. Compared with the pristine TiO2 and other TiO2@RGO nanocomposites prepared through hydrothermal/solvothermal approaches, the as-prepared TiO2@RGO nanocomposite shown significantly enhanced lithium storage performance, much higher reversible capacity, and better cycling stability. More importantly, the as-prepared TiO2@RGO nanocomposite still showed a higher reversible capacity for 220 mA h g−1 at 5C current after 100 cycles. The simple and steerable synthesis, excellent electrochemical performance, and the hollow sphere structure could also provide a new idea for developing higher-performance lithium storage electrodes and other energy storage applications.Conflicts of interest
There are no conflicts to declare.Acknowledgements
This work was financially supported by National Science Foundation of China (51275203).Notes and references
- P. Meduri, E. Clark, J. H. Kim, E. Dayalan, G. U. Sumanasekera and M. K. Sunkara, Nano Lett., 2012, 12, 1784–1788 CrossRef CAS PubMed.
- B. Scrosati, Nature, 1995, 373, 557–558 CrossRef CAS.
- M. Ling, J. X. Qiu, S. Li, H. Zhao, G. Liu and S. Q. Zhang, J. Mater. Chem. A, 2013, 1, 11543–11547 CAS.
- Z. C. Yan and L. Liu, Electrochim. Acta, 2014, 123, 551–559 CrossRef CAS.
- A. G. Dylla, G. Henkelman and K. J. Stevenson, Acc. Chem. Res., 2013, 46, 1104–1112 CrossRef CAS PubMed.
- J. Xu, C. H. Jia, B. Cao and W. F. Zhang, Electrochim. Acta, 2007, 52, 8044–8047 CrossRef CAS.
- M. Zukalová, M. Kalbáč, L. Kavan, I. Exnar and M. Graetzel, Chem. Mater., 2005, 17, 1248–1255 CrossRef.
- X. B. Wang, Y. Yan, B. Hao and G. Chen, ACS Appl. Mater. Interfaces, 2013, 5, 3631–3637 CAS.
- L. F. He, R. G. Ma, N. Du, J. G. Ren, T. L. Wong, Y. Y. Li and S. T. Lee, J. Mater. Chem., 2012, 22, 19061–19066 RSC.
- H. Kim, M. Kim, T. Shin, H. Shin and J. Cho, Electrochem. Commun., 2008, 10, 1669–1672 CrossRef CAS.
- T. B. Lan, Y. B. Liu, J. Dou, Z. S. Hong and M. D. Wei, J. Mater. Chem. A, 2014, 2, 1102–1106 CAS.
- R. W. Mo, Z. Y. Lei, K. N. Sun and D. Rooney, Adv. Mater., 2014, 26, 2084–2088 CrossRef CAS PubMed.
- W. Li, F. Wang, S. S. Feng, J. X. Wang, Z. K. Sun, B. Li, Y. H. Li, J. P. Yang, A. A. Elzatahry, Y. Y. Xia and D. Y. Zhao, J. Am. Chem. Soc., 2013, 135, 18300–18303 CrossRef CAS PubMed.
- F. Zhang, H. Q. Cao, D. M. Yue, J. X. Zhang and M. Z. Qu, Inorg. Chem., 2012, 51, 9544–9551 CrossRef CAS PubMed.
- G. P. Xiong, K. P. S. S. Hembram, R. G. Reifenberger and T. S. Fisher, J. Power Sources, 2013, 227, 254–259 CrossRef CAS.
- G. P. Xiong, C. Z. Meng, R. G. Reifenberger, P. P. Irazoqui and T. S. Fisher, Adv. Energy Mater., 2014, 4, 1300515 CrossRef.
- N. Li, G. Liu, C. Zhen, F. Li, L. L. Zhang and H. M. Cheng, Adv. Funct. Mater., 2011, 21, 1717–1722 CrossRef CAS.
- M. Zhen, X. Guo and G. Gao, et al., Chem. Commun., 2014, 50(80), 11915–11918 RSC.
- P. D. Cozzoli, A. Kornowski and H. Weller, J. Am. Chem. Soc., 2003, 125, 14539–14548 CrossRef CAS PubMed.
- H. B. Wu, X. W. Lou and H. H. Hng, Chem.–Eur. J., 2012, 18, 2094–2099 CrossRef CAS PubMed.
- J. H. Liu, J. S. Chen, X. F. Wei, X. W. Lou and X. W. Liu, Adv. Mater., 2011, 23, 998–1002 CrossRef CAS PubMed.
- C. J. Chen, X. L. Hu, Z. H. Wang, X. Q. Xiong, P. Hu, Y. Liu and Y. H. Huang, Carbon, 2014, 69, 302–310 CrossRef CAS.
- R. Marchand, L. Brohan and M. Tournoux, Mater. Res. Bull., 1980, 15, 1129–1133 CrossRef CAS.
- Y. D. Yin, R. M. Rioux, C. K. Erdonmez, S. Hughes, G. A. Somorjai and A. P. Alivisatos, Science, 2004, 304, 711–714 CrossRef CAS PubMed.
- J. Zhang, H. Yang, G. Shen, P. Cheng, J. Zhang and S. Guo, Chem. Commun., 2010, 46, 1112–1114 RSC.
- C. Lai, H. Z. Zhang, G. R. Li and X. P. Gao, J. Power Sources, 2011, 196, 4735–4740 CrossRef CAS.
- Y. Wang, X. W. Su and S. Lu, J. Mater. Chem., 2012, 22, 1969–1976 RSC.
- H. Qiao, Y. W. Wang, L. F. Xiao and L. Z. Zhang, Electrochem. Commun., 2008, 10, 1280–1283 CrossRef CAS.
- H. Kaper, F. Endres, I. Djerdj, M. Antonietti, B. M. Smarsly, J. Maier and Y. S. Hu, Small, 2007, 10, 1753–1763 CrossRef PubMed.
- E. Baudrin, S. Cassaignon, M. Koelsch, J. P. Jolivet, L. Dupont and J. M. Tarascon, Electrochem. Commun., 2007, 9, 337–342 CrossRef CAS.
- H. E. Wang, H. Cheng, C. P. Liu, X. Chen, Q. L. Jiang, Z. G. Lu, Y. Y. Li, C. Y. Chung, W. J. Zhang, J. A. Zapien, L. Martinu and I. Bello, J. Power Sources, 2011, 196, 6394–6399 CrossRef CAS.
- M. C. Yang, Y. Y. Lee, B. Xu, K. Powers and Y. S. Meng, J. Power Sources, 2012, 207, 166–172 CrossRef CAS.
- G. X. Hu, X. Cai and Y. H. Rong, Fundamentals of Materials Science, Shanghai Jiao Tong University Press, Shanghai, 1st edn, 2000 Search PubMed.
- H. Cao, B. Li, J. Zhang, F. Lian, X. Kong and M. Qu, J. Mater. Chem., 2012, 22, 9759–9766 RSC.
- R. Giannuzzi, M. Manca, L. D. Marco, M. R. Belviso, A. Cannavale, T. Sibillano, C. Giannini, P. D. Cozzoli and G. Gigli, ACS Appl. Mater. Interfaces, 2014, 6, 1933–1943 CAS.
- L. F. He, R. G. Ma, N. Du, J. G. Ren, T. L. Wong, Y. Y. Li and S. T. Lee, J. Mater. Chem., 2012, 22, 19061–19066 RSC.
- Z. L. Xiong, Y. S. Yun and H. J. Jin, Materials, 2013, 6, 1138–1158 CrossRef CAS PubMed.
- J. Y. Eom, H. S. Kwon, J. Liu and O. Zhou, Carbon, 2004, 42, 2589–2596 CrossRef CAS.
- D. Eder and A. H. Windle, Adv. Mater., 2008, 20, 1787–1793 CrossRef CAS.
- V. Etacheri, Y. Kuo, A. V. D. Ven and B. M. Bartlett, J. Mater. Chem. A, 2013, 1, 12028–12032 CAS.
- V. Etacheri, J. E. Yourey and B. M. Bartlett, ACS Nano, 2014, 8, 1491–1499 CrossRef CAS PubMed.
- P. G. Bruce, B. Scrosati and J.-M. Tarascon, Angew. Chem., Int. Ed., 2008, 47, 2930–2946 CrossRef CAS PubMed.
- C. X. Peng, B. D. Chen, Y. Qin, S. H. Yang, C. Z. Li, Y. H. Zuo, S. Y. Liu and J. H. Yang, ACS Nano, 2012, 6, 1074–1081 CrossRef CAS PubMed.
- W. S. Hummers Jr and R. E. Offeman, J. Am. Chem. Soc., 1958, 80, 1339 CrossRef.
- Y. Wang, Y. Li, L. Tang, J. Lu and J. Li, Electrochem. Commun., 2009, 11, 889–892 CrossRef CAS.
- X. Y. Zhang, H. P. Li, X. L. Cui and Y. H. Lin, J. Mater. Chem., 2010, 20, 2801–2806 RSC.
- X. Xin, X. Zhou, J. Wu, X. Yao and Z. Liu, ACS Nano, 2012, 6, 11035–11043 CrossRef CAS PubMed.
- J. S. Chen, H. Liu, S. Z. Qiao and X. W. Lou, J. Mater. Chem., 2011, 21, 5687–5692 RSC.
- S. J. Gregg and K. S. W. Sing, J. Electrochem. Soc., 1967, 114(11), 279C CrossRef.
Footnote |
| † Electronic supplementary information (ESI) available. See DOI: 10.1039/c7ra10681e |
| This journal is © The Royal Society of Chemistry 2017 |

