DOI:
10.1039/C7RA10933D
(Paper)
RSC Adv., 2017,
7, 53076-53086
Amino organosilane grafted ordered mesoporous alumina with enhanced adsorption performance towards Cr(VI)†
Received
5th October 2017
, Accepted 13th November 2017
First published on 17th November 2017
Abstract
Ordered mesoporous alumina (MA) was successfully modified with three amino organosilanes including 3-aminopropyltriethoxysilane (1N), N-(β-aminoethyl)-γ-aminopropylmethylbimethoxysilane (2N) and N-3-trimethoxysilylpropyldiethylenetriamine (3N) via a facile grafting method, and the as-prepared amino organosilane grafted MA–1N, MA–2N and MA–3N show enhanced adsorption performance towards Cr(VI) removal from wastewater. Their physicochemical properties and the MA before modification were comparatively characterized by FT-IR, TEM, XRD, N2 adsorption–desorption, CHNS elemental analysis, zeta potential measurements and XPS. Their adsorption performance was also comparatively studied along with the effect of contact time, adsorption isotherms, multi-metal ion adsorption, interference of co-existing anions and regeneration ability in batch experiments. It was found that their adsorption kinetics data were better fitted by the pseudo-second order model; adsorption isotherms were better described by the Langmuir isotherm for MA–1N, the Freundlich isotherm for MA–2N and the Temkin isotherm for MA–3N. Among them, MA–2N shows the maximum adsorption capacity of 137.9 mg g−1 which is more than twice the 59.4 mg g−1 of MA. The residual concentration of Cr(VI) with a concentration of 50 mg L−1 when treated with MA–2N meets the emission standard of the World Health Organization (WHO). Moreover, MA–2N shows better selectivity toward Cr(VI), and can reduce relatively more Cr(VI) to low toxicity Cr(III). More results were found that Cr(VI) is adsorbed on the surface through a monodentate ligand or bidentate ligand, and then Cr(VI) is reduced to Cr(III) by an adjacent electron donor, after which Cr(III) is co-precipitated with the adsorbents. All the amine-grafted samples show good reusability for 5 cycles. These results indicated that the amino organosilane grafted ordered MA with high adsorption capacity, good selectivity and favourable reusability is a promising candidate for Cr(VI) removal, in combination with its low cost and energy saving preparation process.
1. Introduction
Heavy metals are persistent, bio-accumulative and very hazardous substances with a deleterious effect on the fauna and flora of lakes and streams, and therefore have to be intensively removed before discharge. Among them, hexavalent chromium Cr(VI) is commonly found in wastewaters originating from the chromic salt industry, alloying electroplating and metal polishing.1 Cr(VI) is a highly soluble, reactive and mobile species in aquatic systems, thus exerting carcinogenicity and toxicity in biological systems due to its strong oxidizing properties.2 Up to now, various methods have been developed to treat Cr(VI) wastewater, including separation, chemical precipitation, reduction, ion exchange and adsorption. Among them, adsorption is prominent for its advantages of low cost, high efficiency, easy operation and low secondary pollution impact. However, it is still difficult to decrease the residual Cr(VI) concentration under its maximum permissible discharge standard of 0.05 mg L−1 recommended by the World Health Organization (WHO) in drinking water. Furthermore, instead of a single component solution, industrial wastewater usually contains a variety of anions and cations. Therefore, developing adsorbent with high adsorption capacity, low residual concentration below the WHO limit and good selectivity toward multiple heavy metal ions is of practical meaning.
In last two decades, various mesoporous materials were developed and applied to heavy metal adsorption.3,4 They are of high surface area, large pore volume, hydroxy-rich surface and highly ordered structures, which are suitable for adsorption and further modification.6,7 Among them, alumina is a popular adsorptive and catalytic material because of its excellent physical and textural properties when compared to other transitional inorganic oxides.8 Its amphoteric nature makes it one of the best candidates to be widely used in water treatment, especially in the adsorption area of anions.9 Modified alumina with amino groups is a common method to enhance its adsorption performance because amino groups have good affinity towards Cr(VI).10,11 Dating back to 1990s, the functionalization of mesoporous materials by grafting method came into the sight of heavy metal removal. X. Feng et al.12 synthesized thiol-functionalized ordered mesoporous silica, and found that it was equipped with high metal loading capacity and high selectivity towards Hg(II). It can bind metallic, inorganic, organic, charged, and neutral compounds and can be used in a variety of media such as water, oil and gas. The advancement of the grafting technology provides a unique opportunity to introduce molecular binding sites and to rationally design the surface properties of mesoporous materials. Therefore, materials are endowed with diversity of functions through varying pendant groups, meeting different requirements. Amino-organosilanes are easily hydrolyzed and silylanized due to their alkaline characteristic; alumina is equipped with abundant –OH groups on its surface and able to adsorb H2O molecule by hydrogen bond, affording large amounts of active groups for reacting. As a result, the organic–inorganic hybrid materials are prepared and chemical bond forms to guarantee stability during adsorption process. Accordingly, the advantages of alumina retain, and its adsorption performance is improved.
Grafting by means of toluene or acetone reflux under heating condition is the most common technique to cross-link organosilanes on the adsorbent surface,6,12,13 whereas a grafting method that magnetically stirs at room temperature in ethanol was proved to be resultful and turned out to be feasible, practical and environmentally friendly.5,14 Several kinds of amino organosilanes were used as modifying agent to enhance the performance of adsorbents.14,15 The amino groups can be protonated after cross-linked on the alumina surface. However, to the best of our knowledge, we have not found studies on the modification of ordered MA with those amino oragnosilanes that focus on their adsorption ability in Cr(VI) removal.
Herein, amino functionalized ordered MAs were successfully prepared by a green method using environmental ethanol instead of acetone or toluene as solvent, to mildly graft amino organosilane. The as-prepared organic–inorganic hybrids show much better adsorption performance towards Cr(VI) than the original ordered MA. It is worth mentioning that the residual concentration of Cr(VI) treated by our adsorbents not only meets the wastewater discharge Standard GB 8978-1996 (0.5 mg L−1) of China, but also meets the maximum permissible discharge standard of Cr(VI) in drinking water (0.05 mg L−1) recommended by the WHO. Hence, the as prepared hybrids are competent candidates that could be used in the field of Cr(VI) removal from waste water.
2. Experimental section
2.1 Materials
(EO)20(PO)70(EO)20, one of the triblock copolymers Pluronic P123 (MW = 5800 Da) was purchased from Sigma Aldrich. Other chemicals used are of analytical reagent grade without further purification. Nitric acid, anhydrous ethanol, aluminium isopropoxide, inorganic salts including K2CrO7, Cd(NO3)2, Ni(NO3)2, Cu(NO3)2, Zn(NO3)2, NaNO3, NaCl, Na2SO4 and Na2HPO4 were purchased from Sinopharm Chemical Reagent Co., Ltd (China). K2CrO7 was dissolved in deionized water (Molecular Co., 18.2 MΩ cm) to form a stock Cr(VI) solution of 1000 mg L−1. In addition, the multi-metal ion solution containing Ni(II), Cd(II), Cu(II), Zn(II) and Cr(VI) was prepared by dissolving the corresponding nitric salts mentioned above into deionized water. The co-anions solution was prepared by dissolving the corresponding sodium salts (NaNO3, NaCl, Na2SO4 and Na2HPO4) and K2CrO7 into deionized water to form bi-anion solutions, respectively. The organosilanes used include 3-aminopropyltriethoxysilane (1N), N-(β-aminoethyl)-γ-aminopropylmethylbimethoxysilane (2N) and N-3-trimethoxysilylpropyldiethylenetriamine (3N), their structures were shown in Fig. 1. All silanes were used as received from Aladdin Industrial Co., Ltd (China).
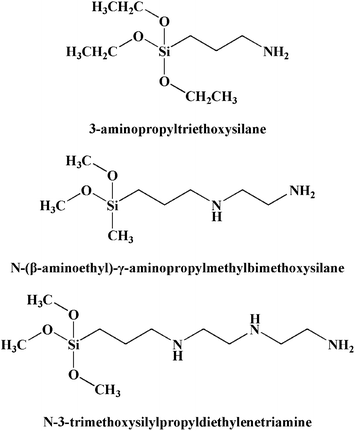 |
| | Fig. 1 Structures of the amino organosilanes. | |
2.2 Synthesis of MA
The MA was synthesized using a solvent-evaporation induced self-organization method which was a slightly modified recipe reported by Yuan et al.16 In a typical synthesis, 1.0 g P123 was dissolved in 10 mL of anhydrous ethanol at room temperature. Simultaneously, 1.6 mL of 67 wt% nitric acid was added into another 5 mL anhydrous ethanol, followed by adding 2.04 g aluminum isopropoxide under vigorous stirring to form a transparent solution, which was poured into the former P123 solution. Another 5 mL anhydrous ethanol was added, to totally transfer the remnant aluminum isopropoxide. The mixed solution was continuously stirred at room temperature for 5 h, followed by solvent-evaporation procedure at 60 °C for 48 h in an oven under atmosphere to form a xerogel. The MA was obtained by calcination of the xerogel in a muffle furnace at 600 °C for 4 h with a ramp rate of 1 °C min−1.
2.3 Grafting aminosilane onto MA
In a typical synthesis, 1 g MA was dispersed in 30 mL anhydrous ethanol, in which 0.5 g amino organosilane was added under ultrasonic condition for 1 min. The solution was then magnetically stirred for 1 h before centrifuge, and the precipitation was washed by anhydrous ethanol for 3 times to rinse redundant organics, dried in an oven for 2 h under 110 °C. The obtained sample was marked as MA–xN, where x representing diverse amino organosilanes. For example, MA–2N represents that the sample was modified by N-(β-aminoethyl)-γ-aminopropylmethylbimethoxysilane (2N), contain two amino groups in a pendant chain.
2.4 Material characterizations
The phase structures of the samples were determined by X-ray diffraction (XRD, Rigaku Ultima III, λ = 1.5406 nm). Other physicochemical properties of the samples were characterized using transmission electron microscopy (TEM, JEM2100F), nitrogen physisorption (Micromeritics TriStar II 3020), Fourier transform infrared spectroscopy (FT-IR, Thermo Electron Scientific Instruments Nicolet 6700, 400 to 4000 cm−1) and CHNS elemental analysis (Elementar Vario EL cube). In addition, X-ray photoelectron spectroscopy (XPS, PANalytical. B.V AXIOS) was used to investigate the chemical state of the samples. Zeta potential measurements were conducted with a zeta voltmeter (Zetasizer Nano ZS90). The residual Cr(VI) concentration was determined by colorimetric measurements on a Shimadzu II UV-vis spectrophotometry at 540 nm using the 1,5-diphenylcarbazide method.17 The concentrations of multi-metal cations were determined using an inductively coupled plasma-atomic emission spectroscopy (ICP-AES, Perkin-Elmer Optima 4300DV).
2.5 Adsorption studies
Batch adsorption experiments were carried out to evaluate the adsorption performance of the samples. To investigate the effect of contact time during the adsorption process, 200 mg sample was added to 100 mL Cr(VI) solution of 50 mg L−1 (by diluting 1000 mg L−1 Cr(VI) solution with water) and kept in a thermostatic oscillation at 25 °C and 180 rpm. The pH of the solution was maintained at 3 by adding 0.1 M NaOH or 0.1 M HNO3 as the pH adjusting agent. The solution was sampled at different time points (0, 5, 15, 30, 60, 90, 120 and 180 min) and filtered by a membrane of 0.45 μm cellulose acetate membranes to execute further detection.
To investigate the adsorption isotherms, parameters including temperature, oscillating rate and pH were kept same and initial concentrations were varied instead of the sampling time points. The concentration of chromium in the initial or equilibrium solutions was determined by UV, and the residual concentrations of cations was determined by the 1,5-diphenylcarbazide method. The adsorption capacity was determined by the following equation:
| |
 | (1) |
where
C0 and
Ce (mg L
−1) are the initial concentration and equilibrium concentration of Cr(
VI), respectively;
m (g) is the mass of the adsorbent added in the solution;
V (L) is the solution volume.
To investigate the selective adsorption for Cr(VI) before and after functionalization, 200 mg sample was suspended in 100 mL mixture solution containing Ni(II), Cd(II), Cu(II), Zn(II) and Cr(VI) with concentration of 50 mg L−1, respectively, to form a multi-component metal ions solution. The solution pH was adjusted to 3 or 6.
To investigate the interference of co-anions toward Cr(VI) adsorption, batch experiments were carried out by contacting the adsorbent with 100 mL binary solution at pH 3 containing both Cr(VI) (50 mg L−1) and one of the interferential anions (50 mg L−1). The Cr(VI) percentage removal or adsorption efficiency was calculated using the following equation:
| |
 | (2) |
where
C0 and
Ce (mg L
−1) are the initial and equilibrium Cr(
VI) concentrations, respectively.
To investigate the potential reusability of the samples, cyclic adsorption-regeneration tests were carried out. Cr(VI) was loaded onto the samples by putting 100 mg adsorbents into 50 mL (2 g L−1), 100 mg L−1 Cr(VI) solution of pH 3 to equilibrium. The Cr(VI) loaded sample was put in to 50 mL of NaOH solution (0.05 M) and shaken for 3 h to desorb the Cr(VI), then washed with deionized water and dried in an oven at 80 °C for 12 h. The procedure was carried out for 5 treatment cycles.
3. Results and discussion
3.1 Physicochemical properties
The FT-IR results were shown in Fig. 2. It was found most band positions do not change after modification, suggesting that the original chemical structure of the alumina nearly remains stable. However, the peak intensities change and shift, indicating that partly chemical change occurs. For all samples, the peaks around 3445 cm−1 and 1640 cm−1 could be attributed to the stretching vibrations of –OH groups in the hydroxide structure as well as in physical adsorbed water.18 The broad peak from 500–750 cm−1 could be ascribed to Al–O vibrations and Al–OH wagging mode of the molecular water in amorphous alumina.18,19 Weak peaks at 1511 and 1411 cm−1 could be attributed to the trace of P123 added during the synthesis process. For all the samples, the peaks at 3443 and 1657 cm−1 belonging to stretching vibration and bending vibration, respectively for –NH and –NH2 become insignificant. This may be due to their merging with the peak of –OH and surface water. Likewise, the Al–O–Si peak also merges with the Al–O–Al band by virtue of closely spaced vibrational frequencies resulting from the insignificant atomic mass difference of Al and Si.20,21
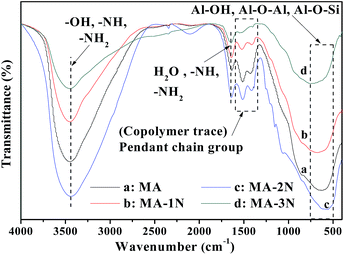 |
| | Fig. 2 FT-IR spectra of the samples. | |
TEM images of the samples were shown in Fig. 3. They all show porous nature in the presence of P123 during the preparation process of alumina. Well-ordered pore network were observed in all samples with an average diameter of ∼8 nm; the highly ordered hexagonal arrangement of pores along [001] (Fig. 3(b)–(d)) direction and the alignment of cylindrical pores along [110] (Fig. 3(a)) direction appear.16 After functionalization by 1N, 2N and 3N, respectively, no obvious damage or distortion of the pores occurs, and the highly ordered hexagonal arrangement of pores and cylindrical pores remain unchanged, which means that the mild functionalization process does not change the structural skeleton of MA. This is due to the peculiarity of the grafting method that functionalization mainly occurs on material surface because the size of organic groups is pretty small.
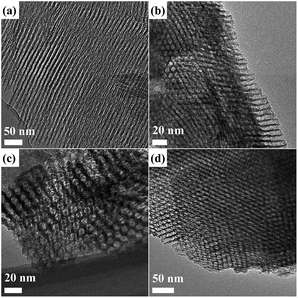 |
| | Fig. 3 TEM images of the samples: MA (a), MA–1N (b), MA–2N (c) and MA–3N (d). | |
Their wide-angle and small-angle XRD patterns were shown in Fig. S1(a) and (b),† respectively. Fig. S1(a)† shows that the origin MA shows amorphous nature due to the fact that the crystalline state appears via calcination above 800 °C.16,22 Fig. S1(b)† shows that all the samples show a very strong peak around 1.0°. Fig. S1† shows that the structure of MA does not obviously change after grafting, which accords with the results of TEM images in Fig. 3.
Their pore properties were investigated by N2 adsorption and desorption isotherms at −196 °C as shown in Fig. 4. Their isotherms show type IV with distinct H1 type hysteresis loops which is the characteristic of mesoporous materials. In comparison with MA–1N and MA–3N, the N2 uptake of MA–2N is the highest, indicating an increase in the volume of mesopores. Their corresponding pore parameters were listed in Table 1. After grafting with organosilane containing two amino groups, MA–2N shows a specific surface area of 249.8 m2 g−1 and a pore volume of 0.59 cm3 g−1, which are higher than those of MA–1N, MA–3N and MA. Combining with the CHNS elemental analysis results listed in Table 2, it is explicable in terms of higher specific surface area of MA–2N than MA, as the grafting procedure could remove part of the residue carbon caused by incomplete combustion of P123, which leads to 0.7% carbon content of MA. This phenomenon of surface area increase is not conspicuous for MA–1N and MA–3N because the length of pendant groups and terminal oxygen-containing groups change.23,24
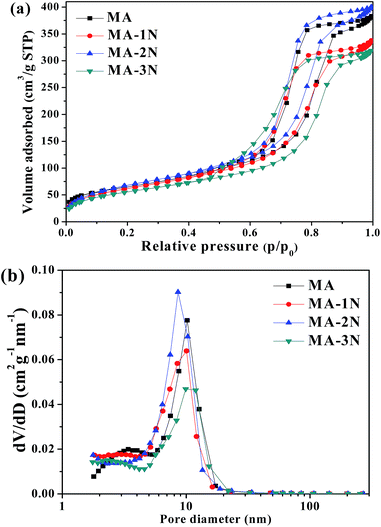 |
| | Fig. 4 N2 adsorption–desorption isotherms (a) and the corresponding pore size distributions (PSD) (b) of the samples. | |
Table 1 The pore structure parameters of the samplesa
| Sample |
dp, nm |
SBET, m2 g−1 |
Vt, cm3 g−1 |
| dp = average pore size. SBET = specific surface area calculated from adsorption data in the relative pressure range of 0.05–0.3. Vt = total pore volume calculated by integration of the PSD curve. |
| MA |
8.74 |
230.6 |
0.59 |
| MA–1N |
7.83 |
225.1 |
0.50 |
| MA–2N |
8.13 |
249.8 |
0.59 |
| MA–3N |
8.70 |
202.3 |
0.49 |
Table 2 CHNS elemental analysis results and zeta potential IEP
| Sample |
% C |
% H |
% N |
IEP |
| MA |
0.71 |
1.49 |
0.00 |
7.7 |
| MA–1N |
3.01 |
1.19 |
0.65 |
9.4 |
| MA–2N |
3.72 |
1.81 |
0.91 |
9.7 |
| MA–3N |
3.65 |
1.29 |
1.55 |
10.2 |
The solution pH significantly influences the surface charge and the protonation degree of an adsorbent. The zeta potential titrations of the samples were shown in Fig. 5 and the isoelectric point (IEP) was listed in Table 2. It was found that the IEPs of all the amino organosilane modified samples shift to higher pH value of 9.4, 9.7 and 10.2, respectively, which are higher than 7.7 of MA. This indicates that the functionalized MA–1N, MA–2N and MA–3N surfaces were successfully modified with positively charged amino groups. After grafting, both of the raised positive potential and the right-shifted IEP forecast the better adsorption behaviour. In particular, a positive platform (marked in dashed frame) appears in all modified samples, showing buffer effect to defend acid and base. The buffer effect was brought by amino groups (–NH2, –NH) in the pendant chain, and with increasing the amount of amino groups, the buffer effect was more notable. This means they have better acid and base resistance and wider pH range application, and is able to interact with the corresponding Cr(VI) species at different pH value.7,20,25,26 Hence, a more stable adsorption condition could be afforded during the adsorption process. In consequence, the initial pH value was selected as pH = 3; for the Cr(VI) species are composed more of HCrO4−, and the degree of protonation is more thoroughly, which are effective and profitable for adsorption of Cr(VI). At lower pH, the adsorbent has the risk to be dissolved, causing mass loss.
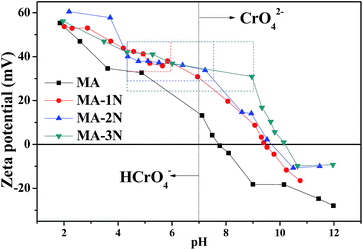 |
| | Fig. 5 Zeta potential analysis results of the samples. | |
3.2 Adsorption behaviour of Cr(VI) ions
3.2.1 Effect of contact time and adsorption kinetics. Adsorption kinetics of all the samples was carried out using 50 mg L−1 Cr(VI) solution at 298 K and a pH of 3. As shown in Fig. 6(a), their adsorption capacities increase with increasing contact time. Most Cr(VI) was adsorbed within first 60 min for all the samples, and the amine functionalized samples (MA–1N, MA–2N and MA–3N) show much better adsorption performance than MA. The time needed to reach equilibrium is 180 min, and the residual Cr(VI) concentration for MA–2N is <0.03 mg L−1, meeting the standard of water pollutants discharge of WHO. The rapid adsorption process in the beginning could be attributed to the greater concentration gradient and more available sites for adsorption.2 Then the adsorption rate becomes subdued owing to occupation of adsorption sites and a charge balance was reached between amine groups and Cr(VI).27
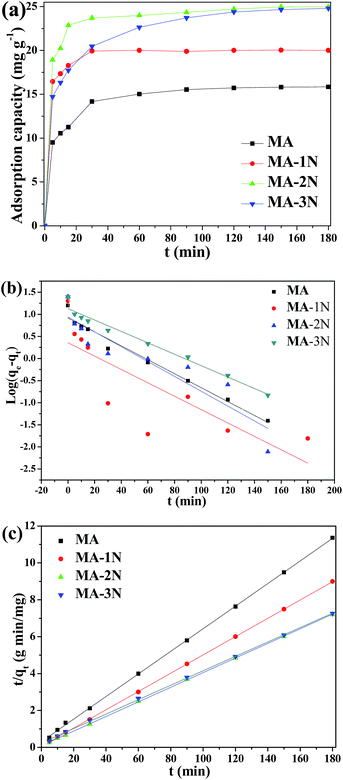 |
| | Fig. 6 Kinetic adsorption curves (a), linear fitting curves of the pseudo-first order (b) and the pseudo-second order (c) of the samples. | |
In order to investigate the rate-controlling mechanism of the adsorption process, the kinetic data were correlated to linear forms of the pseudo-first-order model and pseudo-second-order model as follows, respectively:
| |
 | (3) |
| |
 | (4) |
where
qt and
qe are the amounts of metal ions adsorbed at time
t (min) and equilibrium, respectively;
k1 (min
−1) and
k2 (g (mg min)
−1) are the pseudo-first-order and pseudo-second order rate constants of adsorption, respectively. The simulation data of pseudo-first order and pseudo-second order were listed in
Table 3. The correlation coefficient (
R2) of both models are >0.9, while the consistency of pseudo-second order simulation are more close to 1, and the theoretical
qe of values pseudo-second order are more close to the experimental values, indicating that the adsorption process is more of chemical adsorption.
28
Table 3 The correlated kinetic parameters of Cr(VI) adsorption on the samples according to the pseudo-first-order and pseudo-second-order equation
| Sample |
qe,exp (mg g−1) |
Pseudo-first-order model |
Pseudo-second-order model |
| qe,cal (mg g−1) |
k1 (min−1) |
R2 |
qe,cal (mg g−1) |
k2 × 10−3 (g min−1 mg−1) |
R2 |
| MA |
15.85 |
15.27 |
0.298 |
0.948 |
16.33 |
1.2 |
>0.999 |
| MA–1N |
20.01 |
19.64 |
0.740 |
0.983 |
20.17 |
45.7 |
>0.999 |
| MA–2N |
24.98 |
24.15 |
0.600 |
0.981 |
25.23 |
17.9 |
>0.999 |
| MA–3N |
24.80 |
23.33 |
0.307 |
0.936 |
25.58 |
6 |
>0.999 |
3.2.2 Cr(VI) adsorption isotherms. The effect of the initial Cr(VI) concentration was investigated by contacting 200 mg adsorbent with 100 mL Cr(VI) solution in the concentration range of 20–500 mg L−1 with a contact time of 3 h and pH of 3 shown in Fig. 7. It was observed that with increasing the initial concentration, their adsorption capacities increase until reaching the equilibrium due to the limited active sites. Obviously, the amino functionalized samples show higher adsorption capacities than that of MA due to introducing –NH2 and –NH groups, and for MA–2N, its adsorption capacity is 137.86 mg g−1. When the initial concentration of Cr(VI) is below 50 mg L−1, its residual concentration qualifies the water pollutants discharge standard of WHO. Unexpectedly, although MA–3N has higher amine loading, it does not perform better among the functionalized ones.
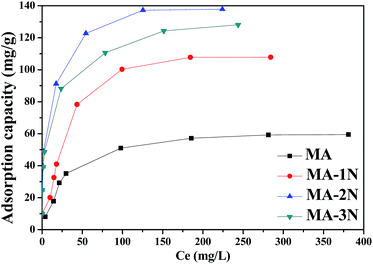 |
| | Fig. 7 Cr(VI) adsorption isotherms of the samples. | |
To further investigate the adsorption behaviour, their equilibrium adsorption was described by the Langmuir, Freundlich and Temkin models as follows:
| |
 | (5) |
| |
 | (6) |
| |
Temkin equation: qe = B![[thin space (1/6-em)]](https://www.rsc.org/images/entities/char_2009.gif) ln ln![[thin space (1/6-em)]](https://www.rsc.org/images/entities/char_2009.gif) kTCe kTCe
| (7) |
| |
 | (8) |
where
Ce is the equilibrium concentration of adsorbate in solution (mg L
−1);
qe and
qm (mg g
−1) are the amounts adsorbed at equilibrium and the maximum adsorption capacity for monolayer formation on adsorbent, respectively.
kL (L mg
−1) is the Langmuir constant related to the maximum adsorption capacity and the energy of adsorption.
kF is the Freundlich constant and
n is the heterogeneity factor. (ln
![[thin space (1/6-em)]](https://www.rsc.org/images/entities/char_2009.gif) kT
kT) is correlated to the maximum binding energy, and
B was a constant related to the heat of adsorption.
The value of theoretical parameters and constants could be calculated from equation fitting, and the results were listed in Table 4. Their Langmuir isotherm correlates better for MA and MA–1N than the other two models (R2 > 0.995), while MA–2N and MA–3N better fit Freundlich and Temkin models, respectively. For MA–1N, its surface was grafted with amino silane, which affords more adsorption sites than MA. Therefore its maximum adsorption capacity increases to 107.84 mg g−1 from 59.45 mg g−1 of MA. For MA–2N, with moderate amino content and higher surface area, its maximum adsorption capacity is 137.86 mg g−1 which is higher than its peer. Chun-Jae Yoo et al.29 summarized that the amino organosilanes containing two amino groups in a chain has the larger average radius of silane domain, meaning that for two amine grafted sample like MA–2N, the amine coverage effect is prominent than MA–1N and MA–3N. This is another aspect which subsidiarily exhibits the superiority of MA–2N. The value of n in the Freundlich isotherm is in the range of 1–10 which represents a good adsorption. Herein, the exponent of n is 4.72 (1 < n < 10), indicating that the adsorption system is favourable for Cr(VI) adsorption. The Temkin model assumes that the activity of the surface active sites is non-uniform, both strong and weak active sites exist. In addition, the interaction between the adsorbate and the adsorbent are uneven. On these premises, the adsorbates are adsorbed by strong active sites at the beginning. While with the surface coverage increases, the adsorption is getting weaker, and the required activation energy is growing, making the adsorption process harder. MA–3N was grafted with the longest functional group, and has the lowest surface area. Based on Temkin model, although MA–3N has the highest amino group content, its amine efficiency (mg Cr(VI) adsorbed/mmol N content) is only 1.2 which is much lower than 2.4 of MA–1N and 2.1 of MA–2N. This means that not all the amino groups of MA–3N are involved in the adsorption process, probably due to the overlong pendant chain which hinders the movement of Cr species to the active sites.
Table 4 Parameters of adsorption isotherms of the samples towards Cr(VI)
| Adsorbent |
qe,exp (mg g−1) |
Langmuir model |
Freundlich model |
Temkin model |
| qm (mg g−1) |
kL |
R2 |
kF |
n |
R2 |
ln![[thin space (1/6-em)]](https://www.rsc.org/images/entities/char_2009.gif) A A |
B |
R2 |
| MA |
59.45 |
65.25 |
0.035 |
0.991 |
10.722 |
3.275 |
0.896 |
−0.749 |
12.246 |
0.967 |
| MA–1N |
107.84 |
128.77 |
0.027 |
0.968 |
15.723 |
2.761 |
0.841 |
−1.401 |
28.145 |
0.941 |
| MA–2N |
137.86 |
132.41 |
0.298 |
0.899 |
47.463 |
4.719 |
0.965 |
3.565 |
15.231 |
0.922 |
| MA–3N |
128.09 |
120.58 |
0.262 |
0.932 |
39.068 |
4.405 |
0.976 |
2.081 |
17.040 |
0.993 |
3.3 Multi-metal ion adsorption
In water system, Cr(VI) often exist with some other metal ions. Therefore, adsorption selectivity of MA–2N and MA towards Cr(VI) was comparatively studied. The corresponding interference experiments in 100 mL solution containing Cu(II), Zn(II), Ni(II), Cd(II) and Cr(VI) of 50 mg L−1, respectively, at pH of 3 and 6 were carried out as shown in Fig. 8(a). For MA, it has lower adsorption capacity in the single component solution and does not show particular selectivity toward Cr(VI) in the multi-metal ion solution both at pH of 3 and 6, while its adsorption capacities towards all the cations increase at a higher pH of 6. For MA–2N, its adsorption capacity has little difference regardless the change of pH in the single component solution; while in the multi component solution, its adsorption capacity almost remains the same. The differences result from the amino groups of MA–2N and the discrepancy between metal ions. An important issue to be considered when discussing the stability of the metal–ligand complexes formed is related to Pearson's hard-soft, acid–base theory. Cd(II) is sorted as soft acid cation and tends to bind preferentially with ligands containing S (e.g. thiol groups), whereas the borderline acids cations Zn(II) and Cu(II) prefer to bond to ligands containing N donor atoms. In addition, solution pH also has a markedly influence on the sorption capacity, and at low pH, cations are difficult to form stable coordination complex onto amino groups. Thus, on one hand, at low pH, amino groups (–NH, –NH2) on the surface of MA–2N are protonated, showing higher affinity towards Cr(VI) through electrostatic attraction and electrostatic repulsion toward cations. On the other hand, at high pH, Cu(II) and Zn(II) show higher affinity towards amino groups containing N donor atoms. However, the affinity of MA–2N toward Cr(VI) is still higher than other metal ions for the special affinity between amino groups and Cr(VI). Likely, Ni(II) is unable to form stable coordination complex on MA–2N. As a result, amino functionalization can not only enhance the adsorption capacity, but also afford exclusive removal of Cr(VI).7,15,30,31
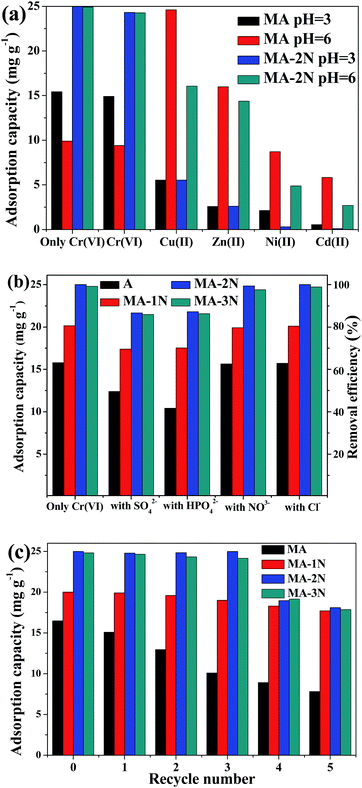 |
| | Fig. 8 Results of multi-metal ion adsorption (a), interference of co-anions study (b) and regeneration study (c). | |
3.4 Interference of co-anions
Since industrial effluents often contain various additives such as inorganic salts, the effect of SO42−, HPO42−, NO3− and Cl− on their adsorption properties towards Cr(VI) was further studied as shown in Fig. 8(b). It was shown that their adsorption performance was undermined by SO42− and HPO42−. Due to the suppressive effect of SO42−, it tends to strike and detach Cr(VI) from adsorbents, thus the adsorbed Cr(VI) starts to mobile again in the solution rather than fix on the adsorbents surface.32 Meanwhile, phosphates possess affinity towards amino groups for its biological activity,33 therefore parts of active sites were taken by SO42− and HPO42−, causing the loss of adsorption efficiency of Cr(VI). NO3− and Cl− only slightly affect the adsorption ability because of their lower ionic radius as well as electric valence state. However, the unique strong oxidative ability of Cr(VI) among the anions makes its overwhelming competitiveness during the adsorption process. Both MA–2N and MA–3N exhibit better adsorption performance than MA, due to their higher amine content. These amino groups are able to affording much more adsorption sites than MA. The performance difference between MA–2N and MA–3N may result from the disparity of amine efficiency, and some amines on MA–3N do not participate in the adsorption process, as mentioned above.
3.5 Regeneration and reuse of the composites
Regeneration and reuse ability is an important factor to evaluate the feasibility and cost-effectiveness of an adsorbent. The desorption agent was 50 mL, 0.05 M NaOH solution. The results were shown in Fig. 8(c). Compared to the functionalized samples, the adsorption ability of MA starts to decrease at the first re-adsorption procedure, and gradually decreases until its adsorption capacity only reaches 47.5% of its fresh ability. In contrast, the adsorption capacities of MA–1N, MA–2N and MA–3N are relatively stable, and the adsorption capacities of MA–2N and MA–3N can remain stable for the first 3 cycles. This is because organosilane functionalized samples with Si–O–Si–R bond are very stable, and Al–O–Si–R bond are similar to Si–O–Si–R bond. Furthermore, aminopropyl group could shield alumina and avoid its dissolution.25 The decrease of their adsorption capacities may result from the desorption treatments and re-adsorption processes or the strong oxidation ability of Cr(VI) species.30
3.6 XPS results analysis/chromium species on the composite after adsorption and mechanism of Cr(VI) removal
XPS analysis helps in identifying the oxidative state of various elements. The XPS full surveys of the MA and MA–2N were shown in Fig. S5.† New peaks attributed to N 1s (399.9 eV) and Si 2p (100 eV) were observed in Fig. 9(b). The high resolution XPS spectrum of N 1s and C 1s was shown in Fig. 9(a)–(c), and the two deconvoluted peaks were identified to –NH and –NH2. In Fig. 9(b), the C 1s spectrum of MA could be deconvoluted into three individual peaks at 284.5 eV, 285.6 eV and 289.6 eV, which were attributed to carbon groups (C![[double bond, length as m-dash]](https://www.rsc.org/images/entities/char_e001.gif) C, CHx, C–C), hydroxyl groups or ethers (–C–OR) and carboxylic groups (–COOR), respectively.34 This verifies the imperfect combustion of the copolymer. For MA–2N, in Fig. 9(c), the C 1s spectrum could be similarly deconvoluted into three individual peaks at 284.5 eV, 285.6 eV and 289.7 eV, and the peak area of carboxylic groups decreases. These results are in accordance with the results of FT-IR spectra, N2 adsorption–desorption and CHNS elemental analysis. The grafting process successfully combines MA with amino organosilane through chemical bond, and is able to simultaneously partly remove the residuary carbon brought by copolymers in the pore structures so that the surface area of MA–2N increases. With the nitrogen content of the grafting pendant group increasing, the nitrogen content from 0.65% of MA–1N to 1.55% of MA–3N was also improved. However, the adsorption capacity does not simply increase with the amino content, and MA–2N shows the fastest adsorption kinetics and the highest adsorption capacity among the modified samples (see Fig. 6 and 7). Furthermore, the same method was used to modify commercial alumina powder (purchased from Zibo Senchi Chemical Co., Ltd) and test its adsorption performance under the same condition in Section 3.2.1, shown in Fig. S2.† It was found that its adsorption performance was also enhanced after grafting of 2N.
C, CHx, C–C), hydroxyl groups or ethers (–C–OR) and carboxylic groups (–COOR), respectively.34 This verifies the imperfect combustion of the copolymer. For MA–2N, in Fig. 9(c), the C 1s spectrum could be similarly deconvoluted into three individual peaks at 284.5 eV, 285.6 eV and 289.7 eV, and the peak area of carboxylic groups decreases. These results are in accordance with the results of FT-IR spectra, N2 adsorption–desorption and CHNS elemental analysis. The grafting process successfully combines MA with amino organosilane through chemical bond, and is able to simultaneously partly remove the residuary carbon brought by copolymers in the pore structures so that the surface area of MA–2N increases. With the nitrogen content of the grafting pendant group increasing, the nitrogen content from 0.65% of MA–1N to 1.55% of MA–3N was also improved. However, the adsorption capacity does not simply increase with the amino content, and MA–2N shows the fastest adsorption kinetics and the highest adsorption capacity among the modified samples (see Fig. 6 and 7). Furthermore, the same method was used to modify commercial alumina powder (purchased from Zibo Senchi Chemical Co., Ltd) and test its adsorption performance under the same condition in Section 3.2.1, shown in Fig. S2.† It was found that its adsorption performance was also enhanced after grafting of 2N.
 |
| | Fig. 9 High resolution of XPS spectra: N 1s of MA–2N (a), C 1s of MA (b), C 1s of MA–2N (c), Cr 2p of MA after adsorption of Cr(VI) (d) and Cr 2p of MA–2N after adsorption of Cr(VI) (e). | |
It was reported that chromate forms a mixture of mono-protonated and non-protonated outer-sphere adsorption complexes on the hydrated γ-Al2O3 surface;35 the ethanol can solubilize all hydrogen-bonded species during the grafting process and subsequent washing procedures.36 So after a fixed time (1 h in our research), the amount of amino silanes immobilized on the surface of alumina were also fixed, and this immobilization depends on the number of silanol groups. The MA–2N possesses a medium molecule size, medium nitrogen content and the highest hydrogen content, which balance the amino groups and the hydroxyl groups. For MA–2N, the grafted model is more likely to form dimers by condensation (two covalent bonds to the surface) rather than long polymer of MA–1N and MA–3N. However, the long polymer may turn out to present a coping effect of the alumina surface that –NH2 and –OH are unavailable for cooperative interactions. By virtue of –OH, the protonated –NH2 and –NH– of MA–2N are more activated and able to attract more Cr(VI) onto the composites surface, thus its adsorption driving force with quite faster adsorption kinetic is much higher than MA–1N and MA–3N, respectively. With increase of the equilibrium concentration of Cr(VI) in the solution, although the activated sites of MA–2N are gradually taken by adsorbates, the immobilization effect for adsorbates is still strong, resulting in its higher adsorption capacity than that of MA–1N and MA–3N, respectively. Furthermore, because the balance between –OH and the protonated –NH2 and –NH– is different with variety of organosilanes, the adsorption isotherms of the samples varying from MA to MA–1N, MA–2N and MA–3N successively, change to fit the Freundlich model better. In addition, the moderate grafting amount was found as shown in Fig. S3.† This may be due to that lower loading amount limits the active sites and higher loading amount causes steric hindrance effect. All the factors result in the best performance of MA–2N among the amino organosilane modified samples.
After adsorption of MA and MA–2N towards Cr(VI), the peaks of Cr 2p emerges. The high resolution Cr 2p XPS patterns of both MA and MA–2N after adsorption were shown in Fig. 9(d) and (e). From Fig. 9(d), Cr 2p1/2 and Cr 2p 3/2 peaks were located around 589 eV and 579.7 eV after differentation-imitating analysis. The broad peak of Cr 2p3/2 was deconvoluted into two peaks at binding energies of 577.2 eV and 579.7 eV, which were attributed to Cr(III) and Cr(VI), respectively. Whereas from Fig. 9(e), Cr 2p1/2 and Cr 2p3/2 peaks were located around 588.6 eV and 579.6 eV, and the broad peak of Cr 2p3/2 was deconvoluted into two peaks at binding energies of 577 eV and 579.6 eV, which shift to lower binding energy compared to the Cr states on MA. The results reveal that MA–2N is able to enhance the adsorption capacity of Cr(VI) and capability of detoxifying more Cr(VI) to Cr(III), according to the Handbook of X-ray Photoelectron Spectroscopy, 2nd edition.37 The functional groups on the surface of MA–2N participates in Cr(VI) adsorption. According to Pearson's principle of hard and soft acids and bases, chromium is categorized as a hard acid and nitrogen is classified as hard base. Herein, the Cr(VI) solution was adjusted to pH of 3. At pH of 1–3, the predominant form of Cr(VI) is HCrO4−, and the free energy for adsorbing HCrO4− is higher than Cr2O72− and CrO42−. At the same time, groups such as –OH, –NH2 and –NH– are protonated to –OH2+, –NH3+ and –NH2+–. Due to its higher surface area and being positively charged of MA–2N, more Cr(VI) are adsorbed on its surface by electrostatic attraction. The interaction could be depicted as follows:2,38
| | |
–NH3+ + HCrO4− → NH3+–HCrO4−
| (9) |
| | |
2(–NH2+–) + CrO42− → –NH2+–CrO42−–NH2+–
| (10) |
| | |
Al–OH+ + HCrO4− → AlOCrO3− + H2O (mono-dentate)
| (11) |
| | |
2(Al–OH+) + HCrO4− → 2(AlO)CrO2 + 2H2O (bi-dentate)
| (12) |
Monodentate ligand and bidentate ligand form, thus the surface concentration of Cr(VI) increase. Then, Cr(VI) was reduced to Cr(III) by adjacent electron donor, after which Cr(III) was in co-precipitation of the adsorbents, mixed with adsorbed Cr(VI). In general, the reaction was carried on as follows:2
| | |
HCrO4− + 7H+ + 3e ↔ Cr3+ + 4H2O
| (13) |
| | |
Cr3+ + 4H2O ↔ Cr(OH)2+ + H+
| (14) |
The adsorption mechanism was depicted in Fig. 10. The digital picture insets are the batch solutions that reach equilibrium after contacting 200 mg MA and MA–2N with 100 mL Cr(VI) solution of 50 mg L−1 and pH of 3. The solution treated by MA–2N on the left becomes colourless, while the solution treated by MA on the right is still bright yellow. Therefore, MA–2N is obviously more efficacious than MA.
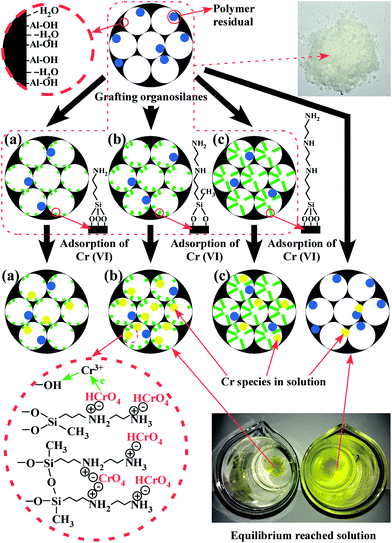 |
| | Fig. 10 MA grafting with (a) 1N, (b) 2N and (c) 3N and overall mechanism of MA–2N toward Cr(VI) adsorption. | |
4. Conclusions
MA grafted by amino organosilanes with a simple, energy saving and environmentally friendly method was successfully prepared and assessed for the removal of Cr(VI) ions from aqueous solution. The functionalization and loading of amino organosilanes was tracked by FT-IR, XPS and CHNS elemental analysis. The adsorption rate and adsorption capacity were significantly enhanced after functionalization, and the residual concentration of Cr(VI) is under the limit of WHO. Amino functionalization endows the MA with far more better reuse ability, exclusive adsorption affinity toward Cr(VI) in multi-metal ions and multi anions solution. The adsorption ability of amino functionalized samples is a comprehensive effect which results from the combination of surface area and the amount of amino groups. The results show that the amino functionalized MA–2N from N-(β-aminoethyl)-γ-aminopropylmethylbimethoxysilane with fairly good reusability is a good candidate which could be used for remediation and selective extraction of Cr(VI) from wastewater.
Conflicts of interest
There are no conflicts to declare.
Acknowledgements
This work was financially supported by the National Natural Science Foundation of China (21476179), 2016 Wuhan Yellow Crane Talents (Science) Program and one hundred talents project of Guangzhou University.
References
- Y. Z. Yan, Q. D. An, Z. Y. Xiao, S. R. Zhai, B. Zhai and S. Zhan, J. Mater. Chem. A, 2017, 5, 17073 CAS.
- L. F. Zhang, W. Xia, L. Xin and W. Q. Zhang, J. Mater. Chem. A, 2015, 3, 331 CAS.
- W. Q. Cai, L. J. Tan, J. G. Yu, M. Jaroniec, X. Q. Liu, B. Cheng and F. Verpoort, Chem. Eng. J., 2014, 239, 207 CrossRef CAS.
- Y. G. Xia, L. Zhang, Y. Wang, X. L. Jiao and D. R. Chen, Mater. Lett., 2015, 143, 294 CrossRef CAS.
- G. L. Li, Z. S. Zhao, J. Y. Liu and G. B. Jiang, J. Hazard. Mater., 2011, 192, 277 CAS.
- X. Q. Chen, W. K. Ching, K. F. Lam, W. Wei and K. L. Yeung, J. Phys. Chem. C, 2016, 120, 18365 CAS.
- I. Sierra and D. Pérez-Quintanilla, Chem. Soc. Rev., 2013, 42, 3792 RSC.
- W. Q. Cai, J. G. Yu and M. Jaroniec, J. Mater. Chem., 2010, 20, 4587 RSC.
- E. Kumar, A. Bhatnagar, W. Hogland, M. Marques and M. Sillanpää, Chem. Eng. J., 2014, 241, 443 CrossRef CAS.
- V. Linsha, P. S. Suchithra, A. Peer Mohamed and S. Ananthakumar, Chem. Eng. J., 2013, 220, 244 CrossRef CAS.
- W. Q. Cai, L. J. Tan, J. G. Yu, M. Jaroniec, X. Q. Liu, B. Cheng and F. Verpoort, Chem. Eng. J., 2014, 239, 207 CrossRef CAS.
- X. Feng, G. E. Fryxell, L. Q. Wang, A. Y. Kim and J. Liu, Science, 1997, 276, 923 CrossRef CAS.
- M. Etienne and A. Walcarius, Talanta, 2003, 59, 1173 CrossRef CAS PubMed.
- Z. Zhu, X. X. Yang, L.-N. He and W. Li, RSC Adv., 2012, 2, 1088 RSC.
- S. A. Idris, K. Alotaibi, T. A. Peshkur, P. Anderson and L. T. Gibson, J. Colloid Interface Sci., 2012, 386, 344 CrossRef CAS PubMed.
- Q. Yuan, A. X. Yin, C. Luo, L. D. Sun, Y. W. Zhang, W. T. Duan, H. C. Liu and C. H. Yan, J. Am. Chem. Soc., 2008, 130, 3465 CrossRef CAS PubMed.
- J. S. Cao and W. X. Zhang, J. Hazard. Mater., 2006, 132, 213 CrossRef CAS PubMed.
- T. Kim, J. B. Lian, J. M. Ma, X. C. Duan and W. J. Zheng, Cryst. Growth Des., 2010, 10, 2928 CAS.
- G. X. Xue, X. Huang, N. Zhao, F. K. Xiao and W. Wei, RSC Adv., 2015, 5, 22972 RSC.
- W. A. W. Razali, V. K. A. Sreenivasan, E. M. Goldys and A. V. Zvyagin, Langmuir, 2014, 30, 15091 CrossRef CAS PubMed.
- L. F. Koong, K. F. Lam, J. Barford and G. McKay, J. Colloid Interface Sci., 2013, 395, 230 CrossRef CAS PubMed.
- W. Q. Cai, J. G. Yu, C. Anand, A. Vinu and M. Jaroniec, Chem. Mater., 2011, 23(5), 1147 CrossRef CAS.
- J. M. Rosenholm and M. Lindén, Chem. Mater., 2007, 19, 5023 CrossRef CAS.
- P. C. Pinheiro, D. S. Tavares, A. L. Daniel-da-silva, C. B. Lopes and E. Pereira, ACS Appl. Mater. Interfaces, 2014, 6, 8274 CAS.
- M. Sakeye and J.-H. Smått, Langmuir, 2012, 28, 16941 CrossRef CAS PubMed.
- Y. Pang, G. M. Zeng, L. Tang, Y. Zhang, Y. Y. Liu, X. X. Lei, Z. Li, J. C. Zhang, Z. F. Liu and Y. Q. Xiong, Chem. Eng. J., 2011, 175, 222 CrossRef CAS.
- P. Luo, J. S. Zhang, B. Zhang, J.-H. Wang, Y.-F. Zhao and J.-D. Liu, Ind. Eng. Chem. Res., 2011, 50, 10246 CrossRef CAS.
- H. Li, D.-L. Xiao, H. He, R. Lin and P.-L. Zuo, Trans. Nonferrous Met. Soc. China, 2013, 23, 2657 CrossRef CAS.
- C. J. Yoo, L. C. Lee and C. W. Jones, Langmuir, 2015, 31, 13350 CrossRef CAS PubMed.
- A. S. K. Kumar, S.-J. Jiang and W.-L. Tseng, J. Mater. Chem. A, 2015, 3, 7044 Search PubMed.
- X. Chen, K. F. Lam, Q. Zhang, B. Pan, M. Arruebo and K. L. Yeung, J. Phys. Chem. C, 2009, 113, 9804 CAS.
- C. H. Wu, S. L. Lo and C. F. Lin, Colloids Surf., A, 2000, 166, 251 CrossRef CAS.
- L. Li, W. Y. Gu, J. Liu, S. Y. Yan and Z. P. Xu, Nano Res., 2015, 8, 682 CrossRef CAS.
- Y. J. Qi, B. Y. Song and Y. Qi, RSC Adv., 2016, 6, 102428 RSC.
- E. J. Elzinga, Y. Z. Tang, J. McDonald, S. DeSisto and R. J. Reeder, J. Colloid Interface Sci., 2009, 340, 153 CrossRef CAS PubMed.
- T. G. Waddell, D. E. Leyden and M. T. DeBello, J. Am. Chem. Soc., 1981, 103, 5303 CrossRef CAS.
- J. F. Moudler, W. F. Sticle, P. E. Sobol and K. D. Bomben, in Handbook of XPS, ed. J. Chastain, Perkin-Elmer, Eden Prairie, MN, 1992, p. 41 Search PubMed.
- L. Luo, W. Q. Cai, J. B. Zhou and Y. Li, J. Hazard. Mater., 2016, 318, 452 CrossRef CAS PubMed.
Footnote |
| † Electronic supplementary information (ESI) available. See DOI: 10.1039/c7ra10933d |
|
| This journal is © The Royal Society of Chemistry 2017 |
Click here to see how this site uses Cookies. View our privacy policy here.  Open Access Article
 *ab and
Zhijun Caic


![[thin space (1/6-em)]](https://www.rsc.org/images/entities/char_2009.gif) ln
ln![[thin space (1/6-em)]](https://www.rsc.org/images/entities/char_2009.gif) kTCe
kTCe

![[thin space (1/6-em)]](https://www.rsc.org/images/entities/char_2009.gif) kT) is correlated to the maximum binding energy, and B was a constant related to the heat of adsorption.
kT) is correlated to the maximum binding energy, and B was a constant related to the heat of adsorption.
![[thin space (1/6-em)]](https://www.rsc.org/images/entities/char_2009.gif) A
A
![[double bond, length as m-dash]](https://www.rsc.org/images/entities/char_e001.gif) C, CHx, C–C), hydroxyl groups or ethers (–C–OR) and carboxylic groups (–COOR), respectively.34 This verifies the imperfect combustion of the copolymer. For MA–2N, in Fig. 9(c), the C 1s spectrum could be similarly deconvoluted into three individual peaks at 284.5 eV, 285.6 eV and 289.7 eV, and the peak area of carboxylic groups decreases. These results are in accordance with the results of FT-IR spectra, N2 adsorption–desorption and CHNS elemental analysis. The grafting process successfully combines MA with amino organosilane through chemical bond, and is able to simultaneously partly remove the residuary carbon brought by copolymers in the pore structures so that the surface area of MA–2N increases. With the nitrogen content of the grafting pendant group increasing, the nitrogen content from 0.65% of MA–1N to 1.55% of MA–3N was also improved. However, the adsorption capacity does not simply increase with the amino content, and MA–2N shows the fastest adsorption kinetics and the highest adsorption capacity among the modified samples (see Fig. 6 and 7). Furthermore, the same method was used to modify commercial alumina powder (purchased from Zibo Senchi Chemical Co., Ltd) and test its adsorption performance under the same condition in Section 3.2.1, shown in Fig. S2.† It was found that its adsorption performance was also enhanced after grafting of 2N.
C, CHx, C–C), hydroxyl groups or ethers (–C–OR) and carboxylic groups (–COOR), respectively.34 This verifies the imperfect combustion of the copolymer. For MA–2N, in Fig. 9(c), the C 1s spectrum could be similarly deconvoluted into three individual peaks at 284.5 eV, 285.6 eV and 289.7 eV, and the peak area of carboxylic groups decreases. These results are in accordance with the results of FT-IR spectra, N2 adsorption–desorption and CHNS elemental analysis. The grafting process successfully combines MA with amino organosilane through chemical bond, and is able to simultaneously partly remove the residuary carbon brought by copolymers in the pore structures so that the surface area of MA–2N increases. With the nitrogen content of the grafting pendant group increasing, the nitrogen content from 0.65% of MA–1N to 1.55% of MA–3N was also improved. However, the adsorption capacity does not simply increase with the amino content, and MA–2N shows the fastest adsorption kinetics and the highest adsorption capacity among the modified samples (see Fig. 6 and 7). Furthermore, the same method was used to modify commercial alumina powder (purchased from Zibo Senchi Chemical Co., Ltd) and test its adsorption performance under the same condition in Section 3.2.1, shown in Fig. S2.† It was found that its adsorption performance was also enhanced after grafting of 2N.


