 Open Access Article
Creative Commons Attribution 3.0 Unported Licence
Effect of oxide on surface tension of molten metal
Chunkai Liabc,
Yu Shi*a,
YuFen Gua and
Fuqian Yang *c
*c
aState Key Laboratory of Advanced Processing and Recycling Non-ferrous Metals, Lanzhou University of Technology, Lanzhou 730050, P. R. China. E-mail: shiyu@lut.cn
bKey Laboratory of Non-ferrous Metal Alloys and Processing, Ministry of Education, Lanzhou University of Technology, Lanzhou 730050, P. R. China
cMaterials Program, Department of Chemical and Materials Engineering, University of Kentucky, Lexington, KY 40506, USA. E-mail: fyang2@uky.edu
First published on 23rd November 2017
Abstract
Oxides as one of the commonly activating fluxes used in active tungsten inert gas welding (A-TIG welding) can dramatically increase the penetration depth to 2–4 times that of conventional welding. Using the oscillation principle of inviscid fluid, a robust method is developed to measure the average surface tension of molten metal during A-TIG welding for four different oxide activating fluxes of B2O3, TiO2, SiO2, and MgO. The experimental results suggest that the oxygen released from the decomposition of oxides is the dominant factor contributing to the change of the surface tension, which can result in the change of the temperature coefficient from negative to positive and alter the Marangoni convection, leading to the increase in the penetration depth. However, oxygen of small amount or large amount has a negligible effect on the sign change of the temperature coefficient. For oxides of low melting points, the interaction between the electrons outside the arc and the neutral particles (atoms and molecules) formed from the dissolution of the oxides causes the constriction of the arc; for oxides of high melting points, the decrease of the spot area in the anode due to high resistivity of the oxides leads to the constriction of the arc.
1. Introduction
Tungsten inert gas (TIG) or gas tungsten arc (GTA) welding have been widely used in pressure vessels, aerospace and nuclear components due to the stable welding arcs, high quality of the weld, and lower cost of equipment. However, there are a variety of inherently unfavorable features, such as low deposition rate and shallow penetration depth, which have limited the applications of TIG in the joining of workpieces with thicknesses of less than approximately 3 mm.1 For workpieces with thicknesses of larger than 3 mm, edge preparation and multi-pass welding are needed, which has greatly reduced the production efficiency for industrial use.To increase the penetration depth in TIG welding, a method of placing a thin layer of powder of inorganic compounds on the surface of workpieces before welding has been developed and named active tungsten inert gas welding or A-TIG welding. Using the A-TIG welding can significantly increase the penetration depth to 2–4 times that of conventional welding.2 Oxides have been widely used as activating fluxes in A-TIG welding. In comparison with the activating fluxes of fluorides and chlorides, oxides have low toxicity and can significantly increase the penetration depth.3–5 It has been believed that the increase in the penetration depth is due to the role of oxides in controlling the arc constriction and Marangoni convection.
Howse et al.6 suggested that the increase in the penetration depth is due to the interaction between the neutral particles (molecules and atom) from vaporized oxides and the electrons outside the arc, which causes the confinement of the arc plasma, leading to the increase of the current density and heat input. Tseng et al.7 studied the effect of SiO2 and TiO2 activating fluxes on the arc behavior and penetration depth during A-TIG welding and observed the increase of the penetration depth. They found that SiO2 exhibits better arc constriction than TiO2 since SiO2 is more electronegative than TiO2, and has stronger interaction with electron than TiO2. However, Lowke et al.8 did not observe the effect of oxide fluxes on the arc constriction over the water-cooled copper anode. Using oxides as activating fluxes in A-TIG welding, Tanaka et al.9 investigated the arc spectrum, and did not detect the presence of oxygen for some oxides of high melting points, including TiO2 and SiO2. They suggested that the arc constriction is not the main factor contributing the increase of the penetration depth in the A-TIG welding with oxides as activating fluxes. Heiple10 proposed that the oxygen from the decomposition of oxides can change the sign of the surface tension gradient from negative to positive and reverse the Marangoni convection in the weld pool. Lu et al.11 examined the amount of oxygen in a weld pool for different oxide activating fluxes used in the A-TIG welding, and suggested that the penetration depth and Marangoni convection in the weld pool are dependent on the amount of oxygen. Using X-ray, Katayama et al.12 found that oxygen can change the mode of fluid flow from centrifugal mode to centripetal mode. However, the small size of the weld pool and high temperature of the weld arc have made it very difficult, if not impossible, to measure the important parameters for the quantitative description of the welding arc and weld pool, which are dependent on the welding parameters and the coating thickness of activating fluxes. The contribution of activating fluxes to A-TIG welding remains elusive.
Considering the difficulty in experimentally quantifying the effect of activating fluxes on the penetration depth in A-TIG welding, numerical method has been used to simulate the welding process involving the use of activating fluxes. Dong et al.13 constructed a mathematical model of the welding arc and weld pool, and studied the oxygen effect on the convection in the weld pool and the weld shape in a TIG welding process. They found that oxygen can cause the sign change of the temperature coefficient of surface tension, and Marangoni convection is responsible for the increase of the penetration depth in A-TIG welding. Most of numerical analyses have been focused on the oxygen effect on the surface tension of liquid metal without addressing the effect of activating fluxes on the arc behavior and the interaction between the welding arc and the weld pool.14,15 Also, the data and the temperature coefficient of surface tension used in the analysis are based on the condition of thermal equilibrium, which differs greatly from those presented during the welding. Thus, the numerical results cannot reveal the fundamental mechanism controlling the increase of the penetration depth in A-TIG welding.
In this work, a simple method is used to measure the surface tension of a weld pool during A-TIG welding. The principle behind this method is the dependence of the oscillation frequency on the size of the weld pool and the average surface tension of the molten metal in the weld pool.16–18 Four different oxides of B2O3, TiO2, SiO2, and MgO are used as activating fluxes in the welding of stainless steel. The effects of the oxides on the surface tension of molten metal and the arc behavior are studied in order to clarity the effect of oxygen. The effects of surface tension on the size of the weld bead and the penetration depth in A-TIG welding process are also discussed.
2. Theoretical model and sensing system
2.1 Theoretical model
The oscillation of a weld pool is related to the interaction between the pool surface and external loading, including the impact of droplet, current pulse, etc.19 Assuming that the molten metal in a weld pool is inviscid, the oscillation frequency of the pool surface has been correlated to the surface tension of molten metal and the size of the weld pool. Such a relationship has been verified by several experiments in TIG welding.16–18 In general, the surface oscillation of a weld pool can be approximated as a free surface standing wave.16 The dispersion relationship can be expressed as
 | (1) |
For TIG welding of stainless steel in stationary and partially penetrated weld pool, there are λ ∼ O(W) and λ/h > 1/3. These results lead to
 | (2) |
Using eqn (2), eqn (1) can be approximated as
 | (3) |
2.2 Sensing system
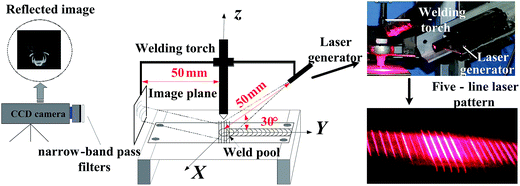
Generally, it is very difficult, if not possible, to measure the oscillation frequency directly during the TIG welding process due to small oscillation amplitude. Shi and his co-workers20,21 have developed a laser-vision sensing system for the measurement of the oscillation frequency of a weld pool. Fig. 1 shows schematic of the sensing system. Using a beam splitter, a laser beam of 669.5 nm in wavelength is split into five laser beams of line type. These five laser beams strike the surface of the weld pool. Any surface change (oscillation) of the weld pool can cause the change in the reflection of the incident laser beams, which is tracked by a high speed camera. The sampling frequency of the high speed camera is 1 kHz. A band-pass filter (670 nm) matching the laser wavelength is used to reduce the effect of the welding arc on the images.3. Experimental detail
A pulsed TIG welding with electrode of negative polarity was utilized to trigger the weld pool into oscillation. The welding torch with a standard 2% thoriated tungsten electrode of a 2.4 mm in diameter was used. Stainless steel of SUS 304 with thickness of 10 mm was used as base metal, and Table 1 list the composition of SUS 304. Four different oxides of B2O3, SiO2, TiO2, and MgO were used as activating flux, respectively in the welding. Prior to welding, the base metal was ground with 300 grit silicon carbide paper and cleaned with acetone. The slurry of flux (oxide powder) in acetone was placed on the surface of the base metal to form a layer of oxide powder.| C | Si | Mn | P | S | Cr | Mo | Ni | Al | Co | Cu | Ti | V | Fe |
|---|---|---|---|---|---|---|---|---|---|---|---|---|---|
| 0.013 | 0.53 | 1.61 | 0.017 | 0.011 | 19.67 | 0.08 | 9.95 | 0.005 | 0.072 | 0.11 | 0.019 | 0.046 | Bal. |
Weld pools of different sizes were produced without moving the welding torch, i.e. the torch speed is 0 mm s−1. The heat input to the base metal, temperature, and the geometry of weld pool were controlled by the arc time of t. Table 2 lists the welding parameters used. After the welding, the sectioning of the weld beads was performed, and the geometry of the weld (width/diameter: W, and the penetration depth: D) was measured by an optical microscope.
| Parameter | Value | Unit |
|---|---|---|
| Material (stainless steel 304L) | 10 | mm |
| Density of stainless steel SUS 304 | 7.93 | g cm−2 |
| Arc length | 3 | mm |
| Average current | 113.64 | A |
| Peak current (Ip) | 193 | A |
| Base current (Ib) | 65 | A |
| Duty rate (σ) | 38% | — |
| Pulse frequency | 3.5 | Hz |
| Welding time | Variable (5–25) | s |
| Welding speed | 0 | mm s−1 |
| Shielding gas (Ar) | 7 | CFH |
4. Results and discussion
4.1 Size of weld beads
In the pulsed TIG welding, all the welding parameters and the mass per unit surface area (coating density) for all the oxides maintained the same. The coating density is 1.76 mg cm−2, and the arc time varied in a range of 5 to 25 s.Fig. 2 shows optical images of the transverse cross-sections of the weld beads formed with and without activating flux at two arc times of 10 and 15 s. The weld beads formed with activating fluxes of B2O3, SiO2 and TiO2 are narrower and deeper than those formed without any activating flux and with the MgO activating flux. There is no significant difference of the transverse cross-sections of the weld beads formed without activating fluxes and with the MgO activating flux. Such a result suggests that using the activating fluxes of B2O3, SiO2 and TiO2 increases the penetration depth and decreases the width of the weld pools in comparison with the one without activating flux.
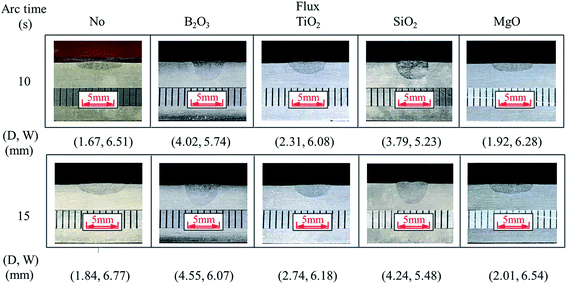 | ||
| Fig. 2 Cross-section of weld beads with and without activating flux (coating density of activating flux: ∼1.76 mg cm−2) (D: penetration depth, W: width of weld bead). | ||
From Fig. 2, we can measure the penetration depth and the width/diameter of the weld beads. Fig. 3 shows the time dependence of the dimensions of weld beads for the TIG welding with and without activating flux. It is evident that both the penetration depth and pool width (width of beads) are proportional to the welding time. Such results are in accord with the numerical results given by Traidia and Roger22 and likely due to the convection flow and the heat input, which leads to the increase in both the penetration depth and the pool width.
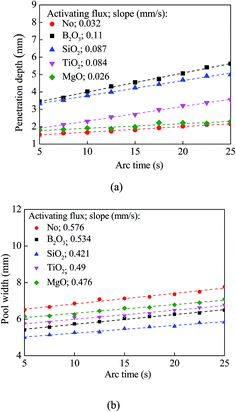 | ||
| Fig. 3 Time dependence of the dimensions of weld beads for the TIG welding with and without activating flux; (a) penetration depth, and (b) pool width. | ||
In comparison with the geometric dimensions of the weld beads formed without activating flux, the use of the activating fluxes of B2O3, SiO2 and TiO2 causes the increase of the penetration depth for the same welding conditions, while the activating flux of MgO has little effect on the penetration depth. The activating flux of B2O3 has the best capability to increase the penetration depth for the TIG welding.
From Fig. 3, one can find the increase rates of the penetration depth and the pool width for constant heat input. Both the increase rate of the penetration depth with the activating flux of B2O3, SiO2, or TiO2 is significantly larger than with MgO and without activating flux. That is to say, the activating fluxes of B2O3, SiO2, or TiO2 have a great effect on the size of the weld bead (the penetration depth). The composition of oxides plays an important in controlling the sizes of weld beads.
Using the results given in Fig. 3, we can calculate the ratio of the penetration depth to the pool width. The largest ratio is ∼0.8 for the TIG welding with the activating flux of either B2O3 or SiO2, and the smallest ratio is ∼0.2 for the TIG welding without activating flux. Under such a condition, we have h/λ > 0.2, and tanh(0.4π) = 0.85. This result suggests that eqn (3) can be approximately used to calculate the average surface tension of the molten metal in a weld pool for the TIG welding.
4.2 Oscillation frequency of welding pool
A high-speed camera was used to capture laser-line patterns during the pulsed TIG welding. Fig. 4 shows temporal evolution of laser-line pattern for the pulsed TIG welding with SiO2 as activating flux (Ip = 193 A, Ib = 65 A, σ = 38%, f = 3.5 Hz, t = 10 s, coating density is 1.4 mg cm−2). The laser-line images exhibit quasi-periodic patterns, suggesting the presence of the surface oscillation of the weld pool during the pulsed TIG welding. Using the brightness value image-processing algorithm developed by Shi et al.,20 the oscillation frequency of the weld pool was determined from the laser-line pattern images.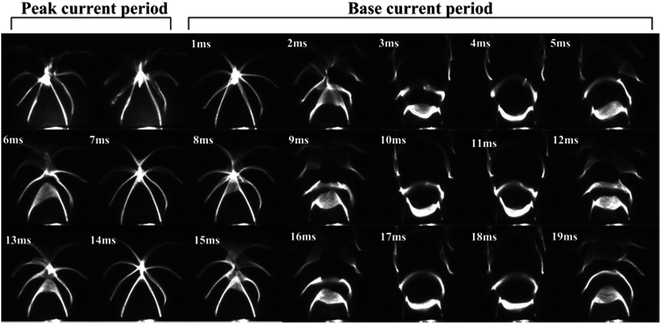 | ||
| Fig. 4 Temporal evolution of laser-line pattern for the pulsed TIG welding with SiO2 as activating flux (Ip = 193 A, Ib = 65 A, σ = 38%, f = 3.5 Hz, t = 10 s, coating density is 1.4 mg cm−2). | ||
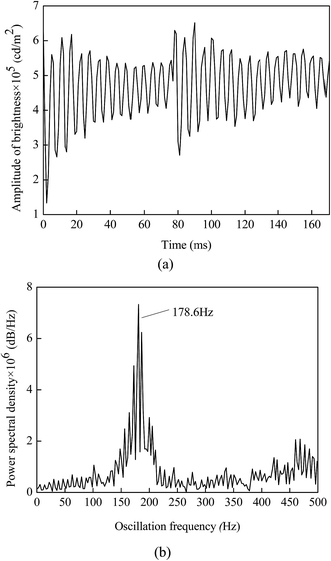
Fig. 5a shows the temporal evolution of the amplitude of the brightness value during the pulsed TIG welding with SiO2 as activating flux (Ip = 193 A, Ib = 65 A, σ = 38%, f = 3.5 Hz, t = 10 s, coating density is 1.4 mg cm−2), which exhibits periodic behavior, as expected. Using the data in Fig. 5a, the variation of the power spectral density with frequency was calculated from the fast Fourier analysis of the amplitude of the brightness value by the brightness value image-processing algorithm. Fig. 5b depicts the distribution of the power spectral density for the pulsed TIG welding with SiO2 as activating flux (Ip = 193 A, Ib = 65 A, σ = 38%, f = 3.5 Hz, t = 10 s, coating density is 1.4 mg cm−2). The oscillation frequency of the pool surface is 178.6 Hz.
4.3 Surface tension of molten metal in weld pool
Using the measured frequency and the geometric dimensions of the weld beads, we can use eqn (3) to calculate the average surface tension of the molten metal in a weld pool. Fig. 6 shows temporal evolution of the average surface tension 〈γ〉 of the molten metal in the welding with different activating fluxes for the welding conditions given in Table 2 and the coating density of ∼1.76 mg cm−2.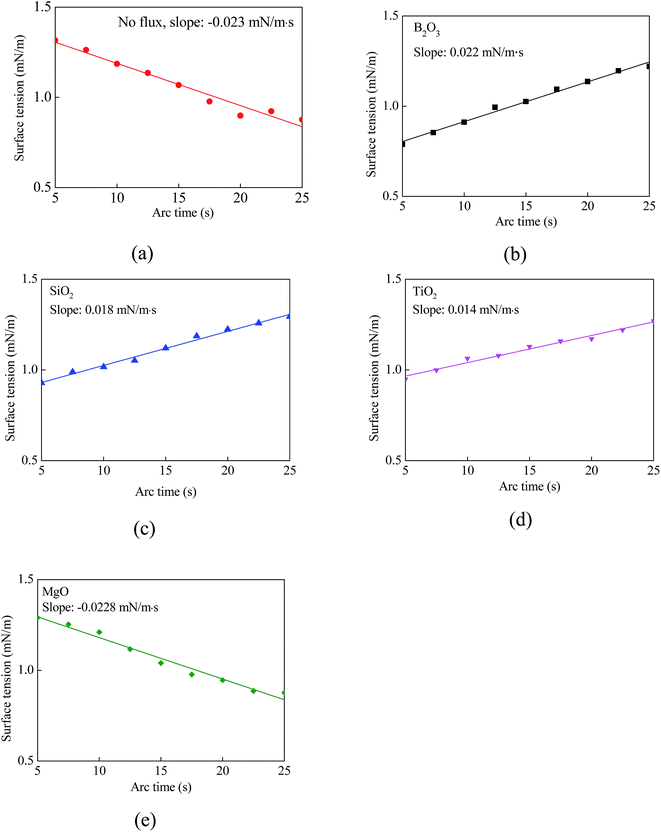 | ||
| Fig. 6 Temporal variation of average surface tension for the TIG welding with and without activating flux (coating density: ∼1.76 mg cm−2). | ||
It is evident that the average surface tension is a linear function of the arc time, independent of the activating flux. There are two different trends for the temporal evolution of the average surface tension; one corresponds to the decrease of the average surface tension with time, i.e. K (slope) < 0, and the other corresponds to the increase of the average surface tension with time, i.e. K > 0. For the welding without activating flux or with MgO activating flux, K < 0. The MgO activating flux is the least efficient in changing the size of the weld beads for the welding of stainless steel SUS 304, in accord with the optical images shown in Fig. 3. For the welding with B2O3, SiO2, or TiO2 activating flux, K > 0. These activating fluxes cause the change of K from negative value for the welding without activating flux to positive value, indicating the possibility to significantly change the size of the weld bead for the welding of stainless steel SUS 304, as revealed by Fig. 3.
It is known that the temperature coefficient of surface tension, dγ/dT (T is absolute temperature), is an important parameter determining the size of weld beads for the TIG welding. There are various methods developed to measure the temperature distribution of a weld pool during welding, including infrared method,23 optical emission spectrometry,4,6 etc. Currently, there is no precise method available to directly and accurately measure the temperature of a weld pool during welding because of the influence of hot arc plasma. Instead, numerical method has become a viable method of analyzing the temperature distribution of a weld pool.22,24 Traidia et al.22 studied the temperature distribution of a weld pool in stationary pulsed TIG welding, and found that both the maximum and average temperatures of the weld pool are linearly dependent on arc time in a range of the arc time, which suggests d〈γ〉/dT ∝ d〈γ〉/dt (t is the arc time). Here, the 〈·〉 represents average value. Thus, the slope of K calculated from Fig. 6 can be used to approximately represent the trend of the average temperature coefficient of surface tension, d〈γ〉/d〈T〉, of the weld pool during the welding. According to the data shown in Fig. 6, the average temperature coefficient of surface tension of the weld pool with the activating flux of B2O3, SiO2, or TiO2 is positive, and the average temperature coefficient of surface tension of the weld pool with the activating flux of MgO or without activating flux is negative. The activating fluxes of B2O3, SiO2, and TiO2 cause the sign change of the average temperature coefficient of surface tension of the weld pool, which likely alters the flow pattern in the weld pool.
It is known that both the flow pattern in a weld pool determines the size of weld beads. The fluid pattern in the weld pool is mainly dependent on the gradient of surface tension, buoyancy force and Lorentz force, in which the gradient of surface tension is the dominant factor determining the flow pattern.13,22 In the TIG welding without activating flux, d〈γ〉/d〈T〉 < 0, and the flow pattern is centrifugal. Under such a condition, both the heat from the welding arc and mass are easily transferred to the edge of the weld pool, leading to the formation of relatively wide and shallow weld beads. Heiple et al.10 suggested that oxygen can change the temperature coefficient of surface tension from negative value to positive value and influence the fluid flow in the weld pool. In the TIG welding with B2O3, SiO2, or TiO2 as activating flux, the oxygen dissociated from the activating flux change the sign of the temperature coefficient of surface tension and the gradient of surface tension, which causes the change of the flow pattern from flowing away the arc to flowing towards the arc. The heat from the welding arc is readily transferred to the bottom of the weld pool, and a narrow and deep weld bead is formed. Such a trend is in accord with the optical images shown in Fig. 2. It is the flow pattern in the weld pool that determines the size of weld beads.
4.4 Effect of coating density
As discussed above, oxygen can cause the change of the temperature coefficient of surface tension, which plays an important role in determining the flow pattern in a weld pool. It is of great importance to examine if the surface tension of molten metal is dependent on the amount of oxygen, i.e. the amount of activating flux.Fig. 7 shows variation of the average surface tension and the penetration depth with the coating density for all four activating fluxes. It is evident that both the average surface tension and the penetration depth are dependent on the amount of activating flux placed on the surface of the weld pool. With the activating flux, the average surface tension initially decreases with the increase of the coating density, and reaches plateau. The average surface tensions corresponding to the plateaus with the activating fluxes of B2O3, SiO2, TiO2 and MgO are 0.81, 0.88, 0.96 and 1.16 mN m−1, respectively. In comparison with the average surface tension of 1.186 mN m−1 for the TIG welding without flux, the activating fluxes of B2O3 and SiO2 are able to reduce the average surface tension of the molten metal with reasonable amount of the oxides. The oxide of MgO has limited effect on the reduction of the surface tension of the molten metal.
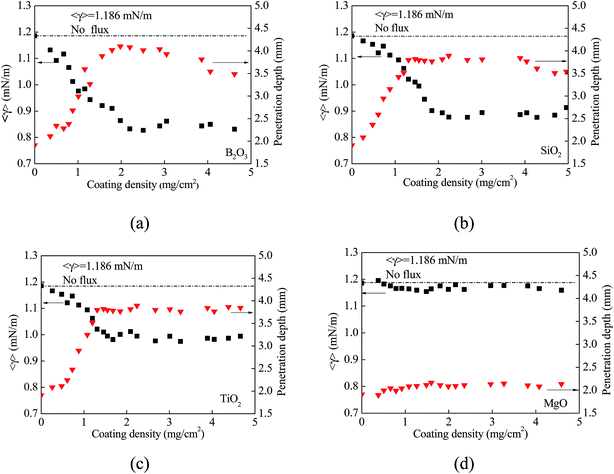 | ||
| Fig. 7 Variation of average surface tension and penetration depth with coating density (arc time: 10 s); (a) B2O3, (b) SiO2, (c) TiO2, and (d) MgO. | ||
The penetration depths with the activating fluxes in the TIG welding exhibit opposite trend from the average surface tension. For all the fluxes, the penetration depth firstly increases, reaches the maximum, and then decreases (B2O3, SiO2) or remains unchanged (TiO2, and MgO) with the increase of the amount of the coating density. Such a trend suggests that there exists an optimal coating density at which the penetration depth is maximum.
Tseng25 suggested that increasing the coating density can cause the increase of the consumption of the arc energy and reduce the heat input into the weld pool for the decrease of the penetration depth with the increase of the coating density. On the other side, Tamatsu et al.26 pointed out that the excess oxygen in molten metal can change the temperature coefficient of surface tension from positive value to nearly zero or negative value. All of these reveal the combination effect of oxide on the welding and the topology of weld beads.
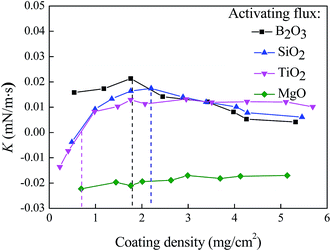
As discussed above, the use of the activating fluxes of oxides causes the change of the temperature coefficient of surface tension for the coating density of ∼1.76 mg cm−2. Using the relationship of d〈γ〉/dT ∝ d〈γ〉/dt, the effect of the coating density on d〈γ〉/dT can be approximately described by the effect of the coating density on d〈γ〉/dt (the slope of K in Fig. 6). Fig. 8 shows the variation of K with the coating density with the other welding parameters being given in Table 2. For the activating flux of MgO, the slope of K is negative, and the magnitude of the K decreases with the increase of the coating density. For the activating flux of TiO2, the slope of K is negative for the coating density less than 0.69 mg cm−2, becomes positive, increases with the increase of the coating density, and reaches plateau. Such a result suggests that there exists a critical coating density, at which K = 0. For the coating density less than the critical coating density, the molten metal flows towards the edge of the weld pool, and for the coating density larger than the critical coating density, the molten metal flows towards the center of the weld pool and leads to the increase of the penetration depth.
For the coating densities of the activating fluxes of B2O3 and SiO2 used in this work, the K values are always positive, increase with the increase of the coating density, reach the maximums, and decrease to approximately zero with further increase of the coating density. These results reveal the significant role of the coating density for the activating fluxes of B2O3 and SiO2 in controlling the surface tension of the molten metal through the temperature coefficient of surface tension. There exists an optimal coating density, which produces the largest temperature coefficient of surface tension, and the Marangoni convection causes the largest flow speed towards to the center of the weld pool. The excess amount of the activating flux of B2O3 or SiO2 can cause the decrease of the penetration depth due to the decrease of the temperature coefficient of surface tension and the flow associated with the Marangoni convection.
Lu11 and Leconte et al.4,5 studied the oxygen content in the weld pool with oxide fluxes, and found the dependence of the oxygen content on the melting point and the coating density of the oxide fluxes. The oxygen content in the weld pool increases with the coating density of the oxide fluxes to a certain extent, and the largest oxygen content is correlated with the melting point. According to the Ellingham diagram, the stability of oxides decreases with the increase in temperature. The higher the melting point of an oxide, the more stable is the oxide. The oxides of low melting points can easily decompose under the action of the welding arc. This trend suggests that, for the welding using oxides with the same coating density, the oxygen content in a weld pool has the highest amount of oxygen for B2O3 (lowest melting point of 732 K) and the least amount of oxygen for MgO (the highest melting point of 3125 K), in accord with the results given by Lu11 and Leconte et al.4,5 One can conclude that an oxide has only a marginal effect on the surface tension and the temperature coefficient of surface tension if the melting point of the oxide is too high or the oxygen content in the weld pool is too low (such as MgO or the case without oxide). For the activating flux of TiO2, SiO2, or B2O3, it is the oxygen content which determines the temperature coefficient of surface tension. The temperature coefficient of surface tension first increases with the increase of the coating density or oxygen content in the weld pool, reaches the maximum, and decreases with the increase of the coating density or oxygen content in the weld pool, as shown schematically in Fig. 9. It needs to point out that TiO2 has a higher melting point (2011 K) than those of SiO2 (1873 K) and B2O3 (734 K), and the maximum amount of oxygen in the weld pool with the use of TiO2 may be less than that with the use of either SiO2 or B2O3. Thus, the activating flux of TiO2 cannot produce enough oxygen during the wielding to reach the critical amount of oxygen in the weld pool required to cause the decrease of d〈γ〉/dT, as shown in Fig. 9. This behavior is consistent with the results given by Tamatsu and Nogi26 in the measurement of the surface tension of pure iron via the method of sessile drop. In addition, the ions adsorbed on the surface of the weld pool likely cause the change of the surface tension.
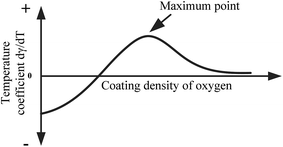 | ||
| Fig. 9 Schematic of the variation of the temperature coefficient of surface tension with oxygen content. | ||
4.5 Effect of oxide on arc behavior and arc voltage
To analyze if there exists interaction between the oxide coating and the welding arc, a high speed camera and a digital data acquisition system were used to record the arc shape and the arc voltage, respectively. Both the sampling rates of the high speed camera and the digital data acquisition system are 1 kHz. The coating density was 1.82 mg cm−2, and the arc time was 10 s.Fig. 10 shows the arc images and the profile of the arc plasma without and with oxides as activating fluxes, which were captured in the peak current period. All the arc columns consist of two regions: arc plasma and outer flame. The arc plasma carries the major fraction of electric current and has the highest temperature, and the behavior of the arc plasma plays the dominant role in determining the properties of the welding arc. To limit the effect of the outer flame in the analysis, the images were first processed by a binarization algorithm to obtain the profile of the arc plasma. The analysis reveals that the activating fluxes of MgO and TiO2 have little effect on the shape of the arc plasma, and the activating fluxes of B2O3 and SiO2 cause the constriction of the arc plasma, as shown in Fig. 10b.
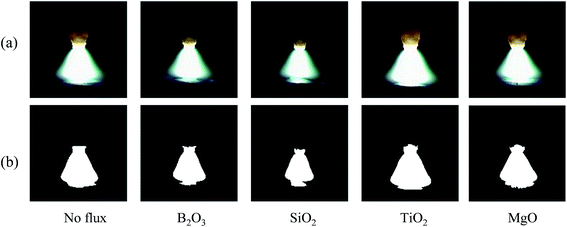 | ||
| Fig. 10 Effect of activating flux on the arc profile (coating density: 1.82 mg cm−2, arc time: 10 s); (a) images of welding arcs, and (b) profile of the arc plasma. | ||
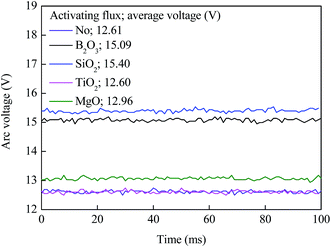
Fig. 11 shows the temporal variation of the arc voltage with and without activating flux in the peak current period. The arc voltage remains constant during the TIG welding. In comparison with the welding without activating flux, the activating flux of TiO2 has no effect on the arc voltage, the activating flux of MgO causes a slight increase of the arc voltage, and the activating fluxes of SiO2 and B2O3 cause large increase of the arc voltage. The increases of the arc voltages are ∼2.79, ∼2.48, ∼0.35, and 0 V for the activating fluxes of SiO2, B2O3, MgO, and TiO2, respectively, which have the same sequence as the constriction of the arc plasma shown in Fig. 10b. There likely exists one to one relationship between the increase of the arc voltage and the constriction of the arc plasma.
The little effect of the activating fluxes of MgO and TiO2 on the arc voltage and the shape of the arc plasma is in accord with the observation by Tanaka et al.9 Such behavior is due to high melting points of MgO (3125 K) and TiO2 (1996 K), which indicates the difficulty for the decomposition and vaporization of both activating fluxes during the TIG welding.
Both the activating fluxes of SiO2 and B2O3 had greatly constricted the arc plasma and increased the arc voltage. For the activating flux of B2O3, the welding arc causes the vaporization of B2O3 to form neutral molecules, which interact with the electrons in the outer flame of the welding arc, leading to the constriction of the arc plasma. It has been reported that the spectrum analysis of the welding arc has not revealed the presence of oxygen, silicon or SiO2 in the welding arc column for the welding with the activating flux of SiO2. Generally, SiO2 is more stable than B2O3 and is relatively difficult to be decomposed. The high resistivity of SiO2 has limited the conducting paths to the center region of the arc plasma, in which the temperature likely is much higher than the melting point of SiO2. Thus, the constriction of the arc plasma for the activating flux is due to the decrease of the spot area in anode associated with the high resistivity of SiO2. The constriction of the arc plasma leads to the increase of the electric current density into the weld pool, which produces large Lorentz force and arc pressure on the weld pool, resulting in a large penetration depth.
5. Summary
One of important parameters controlling the welding quality is the geometrical dimensions of the weld beads, which depend on the surface tension of molten metal and the arc behavior. Using a laser-vision sensing system for the measurement of the oscillation frequency of a weld pool, the effects of the activating fluxes of oxides on the surface tension of molten metal, the temperature coefficient of surface tension and the arc behavior during the TIG welding were investigated. The following is the summary of the results.(1) Both the melting point and resistivity of oxides play important roles in controlling the change of the average surface tension of the molten metal, the Marangoni convection and the arc behavior during the TIG welding. The melting points are correlated with the vaporization and decomposition of oxides that determine the oxygen content in the weld pool. The lower the melting point of an oxide, the more unstable is the oxide. For oxides of low melting points, oxides can readily decompose to form oxygen and to increase the oxygen content in the weld pool.
(2) The oxygen content in the weld pool or the coating density of oxides play a dominant role in determining the average temperature coefficient of surface tension, which affects the Marangoni convection and the penetration depth. Low oxygen content (such as the use of MgO) has little effect on the sign of the average temperature coefficient of surface tension. With the increase of the oxygen content for the use of TiO2, SiO2, or B2O3 in the TIG welding, the average temperature coefficient of surface tension first increase and reach maximum. Further increase of the oxygen content (coating density) can lead to the decrease of the average temperature coefficient of surface tension. The average temperature coefficient of surface tension determines the flow pattern of the molten metal in the weld pool, which changes from the flow towards the edge of the weld pool to the flow towards the center of the weld pool, leading to the increase of the penetration depth.
(3) The variation of the arc plasma during the TIG welding is dependent on the oxides used. For oxides of low melting points (B2O3), the vapored particles (oxygen, atom, and molecule) formed from the decomposition of the oxides interact with the electrons in outer region of the welding arc, which causes the arc constriction. For oxides of high melting points and high resistivities (SiO2), it is the reduction of the spot area in anode, which controls the arc constriction.
Conflicts of interest
There are no conflicts to declare.Acknowledgements
This work was supported by National Natural Science Foundation of China (#51765037), State Key Laboratory of Advanced Processing and Recycling of Nonferrous Metals of China (SKLAB 020114208), the Hong Liu outstanding Talent Training Plan of Lanzhou University of Technology of China (#J201201), Plan for Basic Research Creative Group of Gansu Province (17JR5RA107) and Outstanding Students Overseas Exchange Foundation of Lanzhou University of Technology of China, and Project for Collaborative Innovation Team of Universities in Gansu Province (2017C-07).References
- K.-H. Tseng and C.-Y. Hsu, J. Mater. Process. Technol., 2011, 211, 503–512 CrossRef CAS.
- H. Huang, S. Shyu, K. Tseng and C. Chou, Sci. Technol. Weld. Join., 2005, 10, 566–573 CrossRef CAS.
- S. Leconte, P. Paillard, P. Chapelle, G. Henrion and J. Saindrenan, Sci. Technol. Weld. Join., 2007, 12, 120–126 CrossRef CAS.
- S. Leconte, P. Paillard, P. Chapelle, G. Henrion and J. Saindrenan, Sci. Technol. Weld. Join., 2006, 11, 389–397 CrossRef CAS.
- S. Leconte, P. Paillard and J. Saindrenan, Sci. Technol. Weld. Join., 2006, 11, 43–47 CrossRef CAS.
- D. Howse and W. Lucas, Sci. Technol. Weld. Join., 2000, 5, 189–193 CrossRef CAS.
- K.-H. Tseng and K.-L. Chen, J. Nanosci. Nanotechnol., 2012, 12, 6359–6367 CrossRef CAS PubMed.
- J. Lowke, M. Tanaka and M. Ushio, J. Phys. D: Appl. Phys., 2005, 38, 3438 CrossRef CAS.
- M. Tanaka, T. Shimizu, T. Terasaki, M. Ushio, F. Koshiishi and C.-L. Yang, Sci. Technol. Weld. Join., 2000, 5, 397–402 CrossRef CAS.
- C. Heiple, Weld. J., 1982, 61, 975–1025 Search PubMed.
- S. Lu, H. Fujii, H. Sugiyama, M. Tanaka and K. Nogi, Mater. Trans., 2002, 43, 2926–2931 CrossRef CAS.
- S. Katayama, M. Mizutani and A. Matsunawa, Proc. 7th Int. Welding Symp., Japan Welding Soc, Kobe, 2001, pp. 125–130 Search PubMed.
- W. Dong, S. Lu, D. Li and Y. Li, Int. J. Heat Mass Transfer, 2011, 54, 1420–1431 CrossRef CAS.
- C. Zhao, C. Kwakernaak, Y. Pan, I. Richardson, Z. Saldi, S. Kenjeres and C. Kleijn, Acta Mater., 2010, 58, 6345–6357 CrossRef CAS.
- K. Yamamoto, M. Tanaka, S. Tashiro, K. Nakata, K. Yamazaki, E. Yamamoto, K. Suzuki and A. Murphy, Surf. Coat. Technol., 2008, 202, 5302–5305 CrossRef CAS.
- Y. Xiao and G. Den Ouden, Weld. J., 1990, 69, 289s–293s Search PubMed.
- Y. Xiao and G. Den Ouden, Weld. J., 1993, 72, 428s–434s Search PubMed.
- Y. Xiao and G. Den Ouden, Mater. Sci. Technol., 1997, 13, 791–794 CrossRef CAS.
- D. Kotecki, D. Cheever and D. Howden, Weld. J., 1972, 51, 386s–391s Search PubMed.
- Y. Shi, G. Zhang, X. Ma, Y. Gu, J. Huang and D. Fan, Weld. J., 2015, 94, 176s–187s Search PubMed.
- Y. Shi, C. K. Li, L. M. Du, Y. Gu and M. Zhu, J. Manuf. Process., 2016, 24, 145–151 CrossRef.
- A. Traidia and F. Roger, Int. J. Heat Mass Transfer, 2011, 54, 2163–2179 CrossRef CAS.
- K. Yamazaki, E. Yamamoto, K. Suzuki, F. Koshiishi, S. Tashiro, M. Tanaka and K. Nakata, Sci. Technol. Weld. Joining, 2010, 15, 40–47 CrossRef CAS.
- A. Traidia, F. Roger and E. Guyot, Int. J. Therm. Sci., 2010, 49, 1197–1208 CrossRef CAS.
- K.-H. Tseng, Powder Technol., 2013, 233, 72–79 CrossRef CAS.
- H. Tamatsu, K. Nogi and K. Ogino, J. High Temp. Soc., 1992, 18, 14–19 Search PubMed.
| This journal is © The Royal Society of Chemistry 2017 |

