 Open Access Article
Creative Commons Attribution 3.0 Unported Licence
Molecular dynamics study on the formation of self-organized core/shell structures in the Pb alloy at the nanoscale
Tao Li ,
ZhiChao Wang,
YunRui Duan,
Jie Li and
Hui Li*
Key Laboratory for Liquid-Solid Structural Evolution and Processing of Materials, Ministry of Education, Shandong University, Jinan 250061, People's Republic of China. E-mail: lihuilmy@hotmail.com; Fax: +86 531 88395011; Tel: +86 531 88395011
First published on 22nd November 2017
Abstract
Herein, we report a self-organized core/shell (CS) structure consisting of an Al core and a Pb shell in the liquid Pb alloys at a constant temperature. This is contrary to a believed opinion that the thermal gradient acts as the only driving force for the formation of this kind of structure. The results show that its forming ability greatly depends on the composition and temperature. Importantly, when the alloys are placed in the confined space, a structure of Al–Pb–Al sandwich construction and a completely different CS structure composed of a Pb core and an Al shell are obtained; this suggests a new strategy for controlling the phase-separated structures at the nanoscale. More interestingly, an abnormal phenomenon in the low Pb alloys with the amorphous thin Pb shell and the crystal Al core is observed after solidification, which does not occur in the high Pb alloys that just possess a secondary wrapped structure that never appears in the liquid state. The result of this study may help to shed light on understanding the formation of this core/shell structure and controlling it at an atomic view that have a potential application in the fabrication of these structural materials through nanotechnology.
1. Introduction
Great efforts have been devoted to studying the liquid structure because of its fundamental scientific importance and engineering application potential. Recently, liquid–liquid transition (LLT), especially the first-order transitions between two liquid states characterized by different local structures, has attracted significant attention and research activity1–5 since it has a counter-intuitive nature and is contradictory to the common opinion that there is only one liquid state for a single-component liquid. Typically, the existence of an LLT has been suggested in water,3,4,6,7 supercooled silicon,1,8 and phosphorus.2 However, existing studies about the LLT mainly focus on the non-metallic materials, and the understanding of the liquid phase transition in the metallic liquid is very limited. From a new viewpoint, the phase separation commonly defined as a transition from one uniform phase to two distinct phases is actually a type of LLT. On the basis of this idea, the investigation of liquid structural evolution in the phase-separated alloys is a suitable way to understand the LLT of liquid metals.From a broader viewpoint, the phenomenon of phase separation is not only found in liquid alloys but also very common in numerous materials including cyclohexanol–methanol, succinonitrile–water, and oil–water systems9 and polymers.10,11 Indeed, this phenomenon has attracted significant attention because of its importance in physical and chemical research. Metallic alloys with phase separation are called monotectic alloys, which are well-known in a rich variety of fields related to structural and functional materials. For example, some of them can act as potential materials for bearings in automotive industry with a lower friction coefficient and a good wear resistance.12 Some can be used to fabricate the electrochemical materials as the promising candidates for modern electronic packaging technology,13 battery materials,14 and superconducting materials.15 Therefore, study of the phase separation is promising, and many experimental studies have been conducted to explain the phase-separated structure.16–23 Wang et al.24 suggested that the interfacial energies caused by the temperature gradient induced the phase separation of the Cu–Fe alloy. Zhao reported the formation of a minor phase shell structure, which was caused by the heterogeneous nucleation of the minor phase and the transfer of a solute.25 Moreover, other concurrent processes such as surface wetting, droplet drifting, collision, coagulation,26 and non-gravity-relevant Marangoni convection27–29 contribute to the formation of these structures. However, the explanations mainly focused on the macroscopic solid structure that underwent a cooling process and emphasized the role of the thermal gradient in the formation of this phase-separated structure. The real separation process in the liquid and which structure evolves at a constant temperature are poorly described. Moreover, the details about the phase separation under different conditions are worth to be further studied.
In this study, molecular dynamic (MD) simulations were performed to study the phase separation process and the structural evolution of liquid Al–Pb alloys at various compositions and temperatures. As is known, the Al–Pb binary alloy is most fundamental and representative of the monotectic alloys that are characterized by the appearance of a stable liquid miscibility gap over a wide range of compositions. On the other hand, the Al–Pb alloy is a convenient model system for studies because it displays a simple monotectic phase diagram. Importantly, it is believed that the confinement condition can restrict the movement and the distribution of atoms.30–37 Thus, we also explored the structure of the liquid alloy under the confined conditions and anticipated to obtain new separated structures for some applications. Furthermore, the cooling process has been considered to investigate the formation of the solidified structures. Our study would provide more details about the formation and control of the phase-separated structure on the order of nanoscale and guidance for fabricating these kinds of materials.
2. Models and methods
MD simulations were carried out to study the liquid structure of Pb alloys using the large-scale atomic/molecular massively parallel simulator (LAMMPS) package in the NVT ensemble (the number of particles N, volume V, and temperature T are constant). The Nose–Hoover thermostat38,39 is adopted to control the temperature, and the velocity-Verlet algorithm is used to integrate the equation of motions with a time step of 1.0 fs.Initially, the Al–Pb alloy with the size of 25 × 25 × 4 Å3 had the cubic shape, comprising 10![[thin space (1/6-em)]](https://www.rsc.org/images/entities/char_2009.gif) 000 Al and Pb atoms. Several different compositions of alloys are designed systematically for study by varying the atomic fractions of Pb, which is given in units of atomic% including xPb = 10%, 15%, 20%, 25%, 35%, 50%, and 75%. After equilibrating all the alloys at 1500 K for 500 ps, we placed them on the double graphene (DG, 40
000 Al and Pb atoms. Several different compositions of alloys are designed systematically for study by varying the atomic fractions of Pb, which is given in units of atomic% including xPb = 10%, 15%, 20%, 25%, 35%, 50%, and 75%. After equilibrating all the alloys at 1500 K for 500 ps, we placed them on the double graphene (DG, 40![[thin space (1/6-em)]](https://www.rsc.org/images/entities/char_2009.gif) 005C atoms) for relaxation for about 600 ps to obtain their final structures. Moreover, the structural evolution of the alloy on the confinement constructed by two parallel walls or carbon nanotubes is investigated with an approximate relaxation time of 1000 ps. On the other hand, the selected alloys Al–20Pb, Al–35Pb, Al–50Pb, and Al–75Pb are cooled to the target temperature of 100 K at a cooling rate of 1 K ps−1 to study their solidified structures. During the simulation process, all the substrates are fixed to improve the computational efficiency and accuracy. The Al–Al, Pb–Pb, and Al–Pb interactions are described by an embedded atom method (EAM) potential,40 which can be written as follows:
005C atoms) for relaxation for about 600 ps to obtain their final structures. Moreover, the structural evolution of the alloy on the confinement constructed by two parallel walls or carbon nanotubes is investigated with an approximate relaxation time of 1000 ps. On the other hand, the selected alloys Al–20Pb, Al–35Pb, Al–50Pb, and Al–75Pb are cooled to the target temperature of 100 K at a cooling rate of 1 K ps−1 to study their solidified structures. During the simulation process, all the substrates are fixed to improve the computational efficiency and accuracy. The Al–Al, Pb–Pb, and Al–Pb interactions are described by an embedded atom method (EAM) potential,40 which can be written as follows:  , where F is the embedding energy and ϕ is pair potential interaction. This empirical many-body potential for the Al–Pb system is constructed using the force matching method, which is fitted to the experimental data and physical quantities. Therefore, it is suitable for computer simulations of the Al–Pb system over a wide temperature range from 0 to 2000 K, as validated by the computed Al–Pb phase diagram.41 The C–C interaction is modeled by an adaptive intermolecular reactive empirical bond order (AIREBO) potential.42,43 Due to the fact that metal and carbon can only form soft bonds via charge transfer from the π electrons in the sp2 hybridized carbon to the empty 4s states of metal,44 the 12-6 Lennard-Jones (L-J) potential is utilized to describe the metal–substrate interactions with the following parameters: εC–Al = 0.0309 eV, σC–Al = 3.422 Å,45 εC–Pb = 0.01751 eV, and σC–Pb = 3.288 Å.46–49 The perpendicular of the substrate is considered as the z-direction. The periodic boundary conditions are applied in the x and y directions.
3. Results and discussion
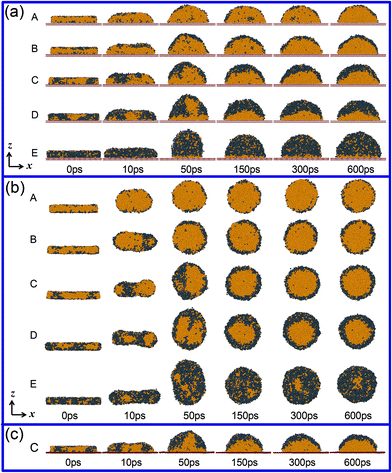
Fig. 1(a) shows the structural evolution of the liquid Al–Pb alloys with various Pb compositions on the double graphene at 1500 K. As the simulation starts, the cubic shape of the liquid alloy gradually converts into a hemisphere due to the decrease of its surface energy. Simultaneously, the inner atoms undergo a transition from the irregular distribution of one liquid state to two-single phases, such as the Al-rich and Pb-rich phases, induced by the diffusion of atoms. Based on this phase separation process, there is an abnormal core/shell (CS) structure formed with the Al core and the Pb shell. Previous investigations have interpreted that the thermal gradient can produce the interfacial tension gradient, driving one-rich phase to migrate from the cold side to the warm side and thus form this structure.24 However, in our study, the CS structures are unexpectedly obtained at a constant temperature; this suggests that the thermal gradient is not the only driving force. In fact, as abovementioned, the formation of this core/shell separated structure is reasonable to indicate a liquid–liquid transition (LLT) process characterized by one liquid state transforming into two coexisting liquid states. According to our simulation results, however, not all compositions of alloys finally possess the CS structure. It can be seen that the alloys with the compositions varying from xPb = 20 to =50% exhibit the typical CS structure, which is formed after 150 ps. At the Pb concentration higher than 50%, although the transformation from one liquid phase into the Al-rich and Pb-rich phases still exists, the CS structure starts to be unclear and eventually disappears with a further increase in Pb concentration. Al–75Pb is just a critical compositional point since most of Al atoms are trapped by the Pb-rich phase, and only a very thin Al layer remains near the graphene substrate. Therefore, without the formation of two clear separated phases, the alloy does not exhibit the CS structure. On the other hand, in the case of a low fraction of Pb, such as Al–10Pb, the CS structure can be formed in the end, but requires a longer time. If there are many Al atoms and few Pb atoms in the disordered liquid alloy, the distance for the movement of Pb atoms from the interior in the bulk liquid to the surface is long, and the movement would be hampered seriously by Al. Therefore, the Pb atoms can hardly escape from the Al-rich phase to congregate to a Pb-rich shell and need enough time to form the CS structure. Interestingly, it is worth mentioning that the Pb cladding layer seems to be a monolayer atomic structure in the Al–10Pb alloy that may have some potential applications in the fabrication of two-dimensional nanomaterials.To eliminate the effect of the substrate, we then studied the structure of the Al–Pb alloys in the free space. As presented in Fig. 1(b), a full egg-type structure consisting of the Al core and the Pb shell is formed after about 150 ps, which is considered as a special form of the CS-type. Similar to the abovementioned analysis, for the Pb concentration smaller than 50%, the egg-type wrapped structure is typical and quite clear. With regard to the Al–75Pb alloy, since a large percentage of Al atoms is dispersed and fails to aggregate inside of the Pb phase, it no longer belongs to the wrapped structure. It should be pointed out that without the support of the substrate, the Pb atoms are responsible to encase the whole Al core; thus, the Pb shell is thinner than that on the DG substrate under the same composition. Why does Pb usually wrap Al even when the substrate is removed? The most possible reason is that the surface energy of liquid Pb is much lower than that of the liquid Al.50 Actually, this egg-type structure indeed exists as a liquid droplet in the composite powders obtained from the liquid immiscible alloy via gas atomization processing.17,26,51 Moreover, we carried out another simulation to study the structural evolution of Al–35Pb on a non-fixed substrate, and the core–shell structure was still obtained, as shown in Fig. 1(c); this assured that the final results were unaffected by the non-fixed substrate.
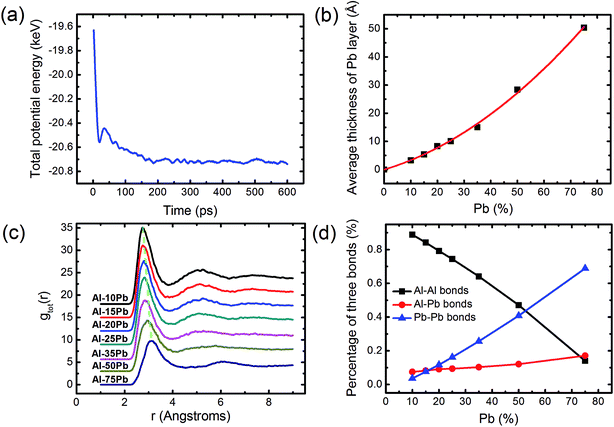
Fig. 2(a) shows the variation of total potential energy of Al–50Pb during the structural evolution process. In the beginning, the energy curve gradually decreases with time. At about 150 ps, the systemic potential energy remains nearly unchanged; this indicates that the whole system is in its equilibrium state. Thus, it is concluded that the formation of this CS structure is perhaps a self-generating process. To further analyze the self-organized CS structure on the DG substrate under different compositions, we calculated the thickness of the Pb layer in the centre section of the alloy. As presented in Fig. 2(b), the curve obviously increases with an increase in the Pb concentration but it displays an unexpected non-linear increasing tendency, which reveals that more and more Al atoms are dissolved in the Pb-rich phase to enlarge the Pb layer at high Pb alloy. This behavior undoubtedly contributes to obscuring the boundary between two kinds of phases and, thereby results in the non-CS structure. Then, we preferred to use the atomic view to explain the different formation abilities of this structure by introducing the pair distribution function52 (PDF), as shown in Fig. 2(c). The PDF curves clearly indicate that with the increasing concentration of Pb, the intensity of the first peak gradually decreases, and the abscissa value R1 of the first peak gradually shifts to the right; this implies that the nearest neighbouring atoms become less and less, and the average first nearest-neighbor distances become larger and larger. As a consequence, we propose that the resulting larger interatomic distance is inevitable to produce more available vacancies or empty area in the Pb-rich phase; this larger interatomic distance perhaps provides more opportunities for these two kinds of atoms to mix quite well and thereby weakens the formation ability of the CS structure. This can also be confirmed by the change of three kinds of bonds. As presented in Fig. 2(d), the percentage of the Al–Pb bonds increases with an increase in the Pb concentration, accompanied by a decrease of the Al–Al bonds; this provides a convincing evidence to support the assumption that more and more Al atoms can stay in the cavity between Pb atoms to form the Al–Pb bonds and the liquid alloy would no longer exhibit the feature of the co-existence of two individual phases at high Pb concentrations, for example, the CS structure is not formed in Al–75Pb, as observed in the images.
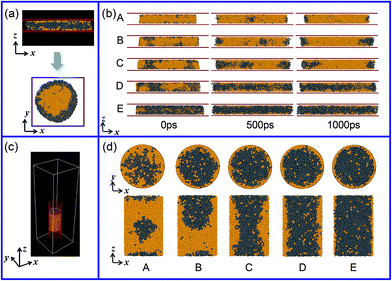
The abovementioned simulations mainly explore the formation ability of the CS structure in the free space. Herein, we would like to study the effect of the confined space on the final structure of the Al–Pb alloys. As presented in Fig. 3(a), the confinement of two graphene walls is first considered. Because of the restriction effect of the confined walls and the reduction of the liquid surface energy, the final alloy exhibits an approximate cylinder shape, where the Al atoms are surrounded by the Pb atoms through the top view. The distribution of atoms along the radial direction suggests that the wrapped structure is also formed with the Al core and the Pb periphery, similar to that of the CS structure under free conditions. Next, we focused on the inner distribution of atoms in the axial (z) direction. As shown in Fig. 3(b), when the fraction of Pb is below 50%, the Pb atoms only gather in the marginal region, whereas the Al atoms occupy the central position to form an Al-rich phase. However, with an increase in the Pb concentration, it is worth noting that the Pb atoms have the tendency to enter the Al-rich phase. For example, at the Pb contents higher than 50%, it can be seen that two sides of the Pb atoms can contact with each other throughout the middle region to separate the Al-rich phase, and an Al–Pb–Al sandwich construction structure is obtained in these alloys. The layer near the graphene wall mainly contains the Al atoms; this indicates that most Pb atoms avoid being in contact with carbon in the confined walls; this is perhaps associated with the weaker wettability between liquid Pb and the carbon surface. The distribution of Pb atoms in the two-wall confinement instructs us that a new structure would be formed in the confinement of the carbon nanotube. Fig. 3(d) shows the final structure of the Al–Pb alloys, which are confined in the carbon nanotube. For the alloys with a low Pb concentration, although some inner Pb atoms are encased by the Al atoms, other dispersive Pb atoms are present on the surface, which does not exhibit the feature of the CS structure. With the increasing Pb content, the Pb atoms gradually evolve into a columnar Pb-rich phase in the centre covered by the Al periphery; this shows an entirely distinct separation structure. These observations are a strong indication of the significant role of the confinement conditions in controlling the liquid structure. By employing a suitable confinement condition, the desirable structure may be achieved. For example, we can speculate that a different egg-type structure with the Pb core and the Al cladding shell would be fabricated if we solidify the alloy in the spherical carbon cavity.
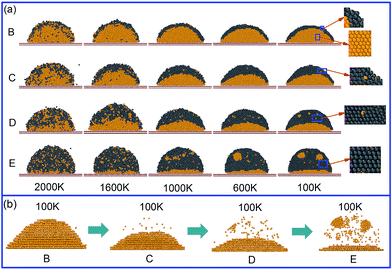
To reveal how the solidified structure forms with respect to the liquid structure, Fig. 4(a) displays the solidification process of the Al–Pb melts from 2000 to 100 K. It can be seen that the inner morphological structure of the alloys undergoes a great change at different temperatures. At 2000 K, for all alloys, the liquid cannot transform into two individual phases and tends to be more homogenous, losing the ability to form the CS structure. This should be reasonable because the enhanced mutual solubility at high temperatures results in the good mixture behavior between two kinds of atoms and confines the LLT process. When the temperature decreases to 1600 K, apart from Al–75Pb, the CS structures are observed in other alloys. However, the exterior Pb layer of these alloys consists of a certain amount of mixed Al atoms instead of pure Pb atoms, and the rest of Al atoms still assemble as the Al-rich phase and occupy the central position. Thus, this CS structure is considered as a pseudo-CS type. To testify the stronger solubility between two kinds of phases at 2000 K, we plotted the time–MSD curve of Pb and Al atoms, as shown in Fig. 5. It should be pointed out that the diffusivity, considered as one significant physical quantity to describe the behavior of liquid metals on the substrate, can be expressed by the slope of the MSD curve. Contrary to the case at 1600 K, both Al and Pb atoms exhibit a larger diffusion at 2000 K, especially for the Pb atoms, which contributes to enhancing the mutual solubility between them and thereby eliminating the CS structure.
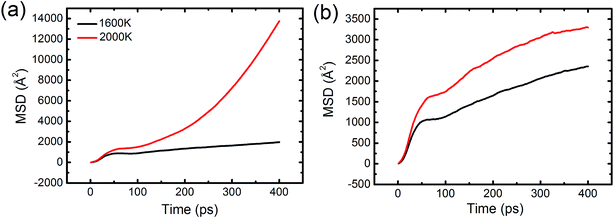 | ||
| Fig. 5 Time-evolution mean square displacement (MSD) of (a) Pb atoms and (b) Al atoms in the Al–50Pb alloy. | ||
As the temperature continuously decreases, the solidified structures gradually appear via the liquid–solid phase transition, and the core/shell boundary is even clearer. Further insight into the formation of the solidified structure originates from the consideration of the atomic distribution of inner Al and its composition-dependence structural evolution, as shown in Fig. 4(b). The inner Al consists of two parts: one is the layered Al phase in the crystal structure and the other is the isolated Al atoms encased by the Pb phase. With the increasing concentration of Pb, the Al atoms become more and more isolated. In particular, as shown in Fig. 4(a), a minor Al-rich region gathered by the isolated Al atoms is observed in the Al–75Pb alloy, where its structure does not become the typical CS type. However, it is reasonable to consider this region as the secondary wrapped structure. Notably, this structure is not found in the liquid state. In terms of the formation of the solid CS structure, there are some different solidification behaviors between the Al and Pb phases with the same cooling rate. For the Al–20Pb alloy, according to the magnified images presented herein, it is obvious that the outer Pb layer displays a disordered and amorphous structure different from the inner Al core that exhibits a crystal structure. To the best of our knowledge, the disordered structure is soft, whereas the crystal structure is hard. Therefore, these solidified alloys with fewer Pb atoms are found to be composed of a hard core and a soft shell. With an increase of the Pb contents, however, the disordered structure in the Pb alloy gradually decreases and completely turns into the crystal structure at the end, as indicated by the magnified images. This phenomenon can be clarified through the PDFs. To study the Al-rich phase and the Pb-rich phase in detail, we divided the Al–Pb alloy into the inner Al atoms and the outer Pb atoms. Fig. 6(a) and (b) show the PDF curves of Al and Pb in the Al–20Pb alloy. With a decrease in temperature, the PDF of the Al solid indicates complete crystallization, whereas that of the Pb solid reveals that the amorphous feature becomes increasingly obvious. Why does the solidification behavior of Pb differ from that of Al? Herein, two factors should be taken into consideration. The first factor is the different melting points and the second factor is that the thin Pb layer with few atoms are more easily affected by the core Al and its nucleation process may be greatly restricted such that the Pb hardly or incompletely forms the crystal structure. By contrast, we also considered the structure of Al–75Pb, as shown in Fig. 6(c) and (d). It can be seen that the PDFs of both Al and Pb represent the evidence of the crystal feature at low temperatures. This is because when the fraction of Pb is high, this restriction effect is not strong enough to prevent the solidification behavior of Pb, such that the structure becomes more ordered.
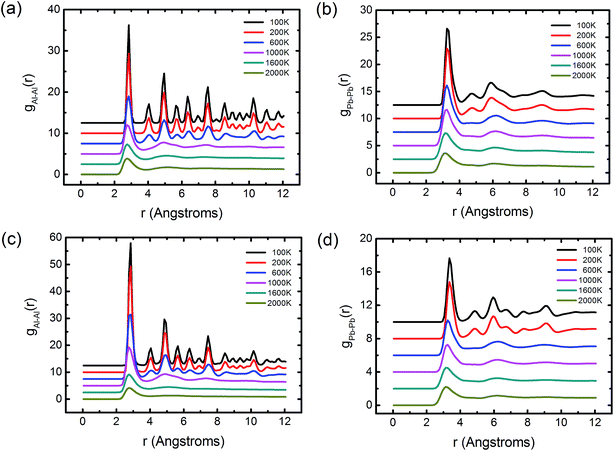 | ||
| Fig. 6 PDFs of (a) the inner Al and (b) the outside Pb in the Al–20Pb alloy, and PDFs of (c) the inner Al and (d) the outside Pb in the Al–75Pb alloy. | ||
4. Conclusion
In summary, we have observed an abnormal self-organized CS structure in the liquid Pb alloy that is composed of an Al core and a Pb shell formed through phase separation. At high Pb concentrations or high temperatures, the CS structure would disappear. Importantly, this structure can be tuned with the aid of confined conditions. For example, a novel structure of Al–Pb–Al sandwich construction is obtained in the two-wall confinement, whereas a completely different CS structure with Pb in the centre surrounded by Al occurs in the carbon nanotube. More interestingly, a solidified structure composed of the amorphous thin Pb shell and the crystal Al core is found to be formed in the low Pb alloys, which may have the potential for developing new materials. At the Pb contents higher than 75%, however, Pb also becomes an ordered crystal, where the solid CS structure disappears, and a secondary wrapped structure is not formed in the liquid phase. These findings may help to shed light on the understanding of the CS structure formation in phase-separated alloys at the atomic level and open up a new view to control the phase separation, which has guiding significance in the fabrication of these materials.Conflicts of interest
There are no conflicts to declare.Acknowledgements
The authors would like to acknowledge the support received from the National Natural Science Foundation of China (Grant No. 51671114). This work was also supported by the Special Funding in the Project of the Taishan Scholar Construction Engineering and National Key Research Program of China (Grant No. 2016YFB0300501).References
- S. K. Deb, M. Wilding, M. Somayazulu and P. F. McMillan, Nature, 2001, 414, 528–530 CrossRef CAS PubMed.
- Y. Katayama, T. Mizutani, W. Utsumi, O. Shimomura, M. Yamakata and K.-i. Funakoshi, Nature, 2000, 403, 170–173 CrossRef CAS PubMed.
- C. A. Angell, Science, 2008, 319, 582–587 CrossRef CAS PubMed.
- P. H. Poole, F. Sciortino, U. Essmann and H. E. Stanley, Nature, 1992, 360, 324–328 CrossRef CAS.
- O. Mishima and H. E. Stanley, Nature, 1998, 392, 164–168 CrossRef CAS.
- O. Mishima, L. Calvert and E. Whalley, Nature, 1985, 314, 76–78 CrossRef CAS.
- O. Mishima and H. E. Stanley, Nature, 1998, 396, 329–335 CrossRef CAS.
- P. F. McMillan, M. Wilson, D. Daisenberger and D. Machon, Nat. Mater., 2005, 4, 680–684 CrossRef CAS PubMed.
- B. Smit, P. Hilbers, K. Esselink, L. Rupert, N. Van Os and A. Schlijper, Nature, 1990, 348, 624–625 CrossRef CAS.
- J. Sun, A. A. Teran, X. Liao, N. P. Balsara and R. N. Zuckermann, J. Am. Chem. Soc., 2013, 135, 14119–14124 CrossRef CAS PubMed.
- C. LoPresti, M. Massignani, C. Fernyhough, A. Blanazs, A. J. Ryan, J. Madsen, N. J. Warren, S. P. Armes, A. L. Lewis and S. Chirasatitsin, ACS Nano, 2011, 5, 1775–1784 CrossRef CAS PubMed.
- M. Wu, A. Ludwig and L. Ratke, Metall. Mater. Trans. A, 2003, 34, 3009–3019 CrossRef.
- E. Bradley and K. Banerji, IEEE Trans. Compon., Packag., Manuf. Technol., Part B, 1996, 19, 320–330 CrossRef CAS.
- C. Zhang, C. Guo, Y. Wei and L. Hou, Phys. Chem. Chem. Phys., 2016, 18, 4739–4744 RSC.
- J. S. Moodera and R. Meservey, Phys. Rev. B: Condens. Matter Mater. Phys., 1990, 42, 179–183 CrossRef CAS.
- G. Jingjie, L. Yuan, J. Jun, S. Yanqing, D. Hongsheng, Z. Jiuzhou and X. Xiang, Scr. Mater., 2001, 45, 1197–1204 CrossRef.
- R. Shi, C. Wang, D. Wheeler, X. Liu and Y. Wang, Acta Mater., 2013, 61, 1229–1243 CrossRef CAS.
- W. Wang, Z. Li and B. Wei, Acta Mater., 2011, 59, 5482–5493 CrossRef CAS.
- S. Fölling, A. Widera, T. Müller, F. Gerbier and I. Bloch, Phys. Rev. Lett., 2006, 97, 060403 CrossRef PubMed.
- J.-R. Huo, X.-X. Wang, L. Li, H.-X. Cheng, Y.-J. Su and P. Qian, Sci. Rep., 2016, 6, 35464 CrossRef CAS PubMed.
- M. Grünwald, K. Lutker, A. P. Alivisatos, E. Rabani and P. L. Geissler, Nano Lett., 2012, 13, 1367–1372 CrossRef PubMed.
- K. D. Beard, D. Borrelli, A. M. Cramer, D. Blom, J. W. V. Zee and J. R. Monnier, ACS Nano, 2009, 3, 2841–2853 CrossRef CAS PubMed.
- A. Khanal, Y. Inoue, M. Yada and K. Nakashima, J. Am. Chem. Soc., 2007, 129, 1534–1535 CrossRef CAS PubMed.
- C. Wang, X. Liu, I. Ohnuma, R. Kainuma and K. Ishida, Science, 2002, 297, 990–993 CrossRef CAS PubMed.
- J. Zhao, Scr. Mater., 2006, 54, 247–250 CrossRef CAS.
- R. Shi, Y. Wang, C. Wang and X. Liu, Appl. Phys. Lett., 2011, 98, 204106 CrossRef.
- D. R. Liu, N. Mangelinck-Noël, C.-A. Gandin, G. Zimmermann, L. Sturz, H. N. Thi and B. Billia, Acta Mater., 2014, 64, 253–265 CrossRef CAS.
- A. S. Basu and Y. B. Gianchandani, Appl. Phys. Lett., 2007, 90, 034102 CrossRef.
- C. Zhao, C. Kwakernaak, Y. Pan, I. Richardson, Z. Saldi, S. Kenjeres and C. Kleijn, Acta Mater., 2010, 58, 6345–6357 CrossRef CAS.
- W. Y. Choi, J. W. Kang and H. J. Hwang, Phys. Rev. B: Condens. Matter Mater. Phys., 2003, 68, 193405 CrossRef.
- Z. Liu, Y. Bando, M. Mitome and J. Zhan, Phys. Rev. Lett., 2004, 93, 095504 CrossRef PubMed.
- R. Shi, J. Shao, X. Zhu and X. Lu, J. Phys. Chem. C, 2011, 115, 2961–2968 CAS.
- J. Shao, C. Yang, X. Zhu and X. Lu, J. Phys. Chem. C, 2010, 114, 2896–2902 CAS.
- M. Dijkstra, Phys. Rev. Lett., 2004, 93, 108303 CrossRef PubMed.
- S. Liu, X. Zhou, W. Wu, X. Zhu, Y. Duan, H. Li and X. Wang, Nanoscale, 2016, 8, 4520–4528 RSC.
- X. Zhou, S. Liu, L. Wang, Y. Li, W. Wu, Y. Duan and H. Li, Nanoscale, 2016, 8, 12339–12346 RSC.
- C. Yang, M. Zhou and Q. Xu, Nanoscale, 2014, 6, 11863–11870 RSC.
- W. Shinoda, R. DeVane and M. L. Klein, Mol. Simul., 2007, 33, 27–36 CrossRef CAS.
- H. Watanabe and H. Kobayashi, Phys. Rev. E: Stat., Nonlinear, Soft Matter Phys., 2007, 75, 040102 CrossRef PubMed.
- T. P. C. Klaver, S.-E. Zhu, M. H. F. Sluiter and G. C. A. M. Janssen, Carbon, 2015, 82, 538–547 CrossRef CAS.
- A. Landa, P. Wynblatt, D. Siegel, J. Adams, O. Mryasov and X.-Y. Liu, Acta Mater., 2000, 48, 1753–1761 CrossRef CAS.
- X. Zhou, H. Wadley, R. A. Johnson, D. Larson, N. Tabat, A. Cerezo, A. Petford-Long, G. Smith, P. Clifton and R. Martens, Acta Mater., 2001, 49, 4005–4015 CrossRef CAS.
- H. Zhao, K. Min and N. Aluru, Nano Lett., 2009, 9, 3012–3015 CrossRef CAS PubMed.
- P. Sutter, M. Hybertsen, J. Sadowski and E. Sutter, Nano Lett., 2009, 9, 2654–2660 CrossRef CAS PubMed.
- R. R. Fang, Y. Z. He, K. Zhang and H. Li, J. Phys. Chem. C, 2014, 118, 7622–7629 CAS.
- S. J. Stuart, A. B. Tutein and J. A. Harrison, J. Chem. Phys., 2000, 112, 6472 CrossRef CAS.
- G. Hudson and J. McCoubrey, Trans. Faraday Soc., 1960, 56, 761–766 RSC.
- T. Li, W. Wu and H. Li, Phys. Chem. Chem. Phys., 2016, 18, 27500–27506 RSC.
- T. Li, J. Li, L. Wang, Y. Duan and H. Li, Sci. Rep., 2016, 6, 34074 CrossRef CAS PubMed.
- V. Kumikov and K. B. Khokonov, J. Appl. Phys., 1983, 54, 1346–1350 CrossRef CAS.
- I. Ohnuma, T. Saegusa, Y. Takaku, C. Wang, X. Liu, R. Kainuma and K. Ishida, J. Electron. Mater., 2009, 38, 2–9 CrossRef CAS.
- S. Auer and D. Frenkel, Nature, 2001, 409, 1020–1023 CrossRef CAS PubMed.
| This journal is © The Royal Society of Chemistry 2017 |

