 Open Access Article
A miniaturised 3D printed polypropylene reactor for online reaction analysis by mass spectrometry†
Gianmario
Scotti‡
 a,
Sofia M. E.
Nilsson‡
 a,
Markus
Haapala
 a,
Päivi
Pöhö
a,
Gustav
Boije af Gennäs
a,
Jari
Yli-Kauhaluoma
a and
Tapio
Kotiaho
a,
Päivi
Pöhö
a,
Gustav
Boije af Gennäs
a,
Jari
Yli-Kauhaluoma
a and
Tapio
Kotiaho
 *ab
*ab
aDivision of Pharmaceutical Chemistry and Technology, Faculty of Pharmacy, University of Helsinki, P.O. Box 56, FI-00014, Finland. E-mail: tapio.kotiaho@helsinki.fi
bDepartment of Chemistry, University of Helsinki, P.O. Box 55, FI-00014, Finland
First published on 17th March 2017
Abstract
A miniaturised polypropylene reactor was fabricated by 3D printing using fused deposition modeling. A stainless steel nanoelectrospray ionisation capillary and a magnetic stir bar were integrated into the reactor during the printing process. The integrated nanoelectrospray ionisation capillary allows direct sampling of a reaction solution without external pumping. It also allows ionisation of the analytes. Therefore, very rapid online mass spectrometric chemical reaction monitoring is possible. Operation of the miniaturised reactor is shown by the online nanoelectrospray mass spectrometry characterisation of a Diels–Alder reaction and the subsequent retro Diels–Alder reaction.
The development of microfluidic devices has benefited from the advances in microfabrication technologies.1,2 Microfabrication technologies present a number of challenges for a researcher who requires analytical equipment made out of 3D structures: (i) several process steps are required with several iterations of photolithography, (ii) various etching and masking materials are involved in the process, and (iii) a trained operator is needed to use the necessary equipment, which is typically situated in clean room facilities. This instrumentation is usually very expensive. Additive manufacturing (commonly called 3D printing) solves these issues as 3D printing processes create the structures directly from a CAD drawing, allowing for a much faster prototyping and testing cycle.3–5 Furthermore, 3D printing enables the reproduction of structures of almost any complexity. A great variety of 3D printers and materials are ubiquitous and are becoming affordable, and the processes involved in 3D design and printing are easier to learn than conventional microfabrication methods. However, 3D printing technologies have also some disadvantages compared to traditional microfabrication: most of the 3D printing technologies have worse resolution and accuracy, and produce surfaces with higher macro- and microroughness than the traditional microfabrication techniques.
The rapid growth in availability and increasing affordability of 3D printers coupled with the other advantages of 3D printing have resulted in a rapidly expanding community of researchers using 3D printers for the production of microfluidic devices.6–12 Examples of 3D printed microfluidic reactors for studying chemical reactions include those described by Kitson et al.,13 which were fabricated by fused deposition modeling (FDM) from polypropylene (PP) and combined online with IR and UV-vis spectroscopy. In another study, a microreactor with an integrated stir bar was printed from acetoxysilicone polymer and combined with UV-vis spectroscopy for reaction monitoring.14 Stereolithography has been used to fabricate a microreactor with embedded optical fibers for UV-vis detection.15 3D printing has also been used to fabricate devices for mass spectrometry. For example, a microfluidic chip was 3D printed from PP and coupled online to a commercial electrospray ionisation (ESI) mass spectrometer for real-time reaction monitoring.16 Additionally, 3D printing has been used to create a cartridge for solvent delivery for paper spray ionisation17 and a microfluidic device to hold a paper tip for paper spray ionisation.18
As far as we are aware, reports on 3D printed microreactors with a mass spectrometric ionisation component, here a nanoelectrospray ionisation (nano-ESI) capillary, embedded during the printing process have not been found in the literature. The integrated nano-ESI capillary allows direct sampling of the reaction solution without external pumping, since the electrospray process automatically pulls liquid from the reaction chamber via the nano-ESI capillary.19 This allows very fast reaction monitoring since the volume between the reaction chamber and the ion source is minimised (i.e. only the volume of the nano-ESI capillary) and in addition minimal dead volume is obtained. Microreactors with integrated ion sources for reaction analysis have hitherto been fabricated by the “classic” microfabrication methods and they typically utilise ESI.20–27 A forerunner of our work can be considered to some extent to be the study in which a quartz capillary for nanoelectrospray ionisation was inserted into a bottle that contained a reaction solution and reactions occurring were analysed online using nano-ESI mass spectrometry.28
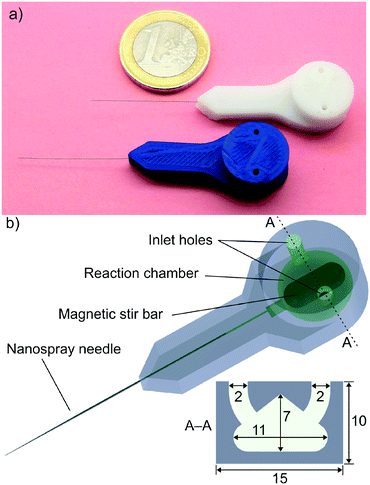
We describe in this work the fabrication of a miniaturised reactor for mass spectrometric online chemical reaction analysis by 3D printing with FDM (Fig. 1). The reactor was 3D printed from PP, which is rarely used for FDM because it has relatively weak mechanical properties compared to the more commonly used materials poly(lactic acid), acrylonitrile butadiene styrene, poly(ethylene terephthalate), and nylon.26 Moreover, PP exhibits extremely poor adhesion to most built platforms. Due to this, a polypropylene sheet was used as the building surface to provide consistent and repeatable printing results. However, PP does have very desirable properties for manufacturing chemical devices: it is tolerant to virtually all solvents used in chemical analysis and synthesis, and it is inert towards a large number of organic and inorganic reagents, including concentrated acids and bases. A special feature of FDM is that it allows the 3D printing process to be interrupted at a desired point, and it can be recommenced later.27 We utilised this stop–start capability to integrate a polytetrafluoroethylene-coated magnetic stir bar (length = 10 mm, diameter = 3 mm) and a stainless steel nano-ESI capillary (length = 50 mm, i.d. = 30 μm, o.d. = 150 μm, Thermo Fisher Scientific) into the reactor. The volume of the reaction chamber, with the stir bar inserted, was measured to be 250 μL (the calculated volume is ∼270 μL).
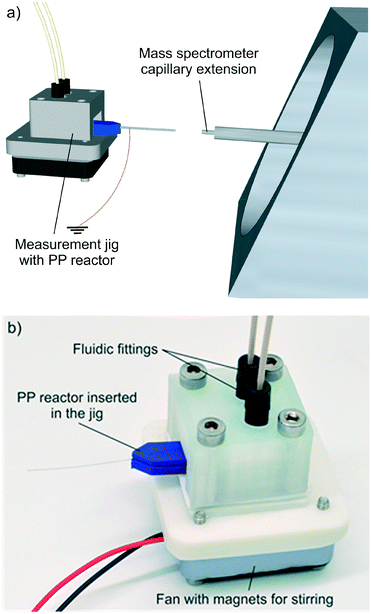
A jig for interfacing the 3D printed reactor with a mass spectrometer was also 3D printed (Fig. 2). The jig holds the reactor in place, has connectors for fluidic introduction and a small fan with magnets, which are used for activating the stir bar. More detailed instructions for 3D printing of the miniaturised reactor and the jig, and the model files are provided in the ESI† (section 1). The MS measurement set-up details are also presented in the ESI† (section 2).
 | ||
| Fig. 2 a) 3D schematic of the measurement setup. b) Photograph of the measurement jig with a miniaturised reactor inserted. | ||
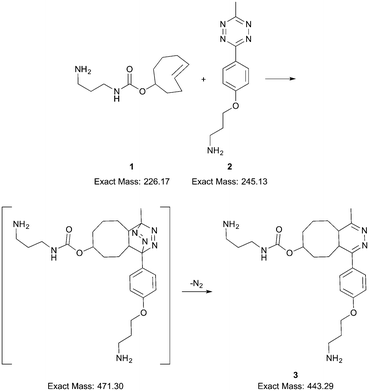
An inverse electron-demand Diels–Alder reaction between trans-cyclooctene 1 and methyltetrazine 2 followed by a retro Diels–Alder reaction of the initial cycloadduct (Scheme 1) was selected to show the operation of the reactor. The double-bond strain of trans-cyclooctene is released during the Diels–Alder reaction, which makes the reaction energetically favored and fast.29 Therefore, it is an optimal proof-of-concept reaction to demonstrate the feasibility of our miniaturised 3D printed reactor: a fast reaction provides a reasonable time-window for the online monitoring of its products. The online and offline mass spectrometric measurements were mainly carried out using an ion trap mass spectrometer operated in positive ESI mode. Offline measurements with an Orbitrap mass spectrometer in positive ESI mode were conducted to obtain accurate mass information for the ions observed with the ion trap mass spectrometer. The detailed mass spectrometric measurement conditions are presented in the ESI† (section 3).
 | ||
| Scheme 1 The Diels–Alder and retro Diels–Alder reactions as studied using the 3D printed miniaturised reactor. | ||
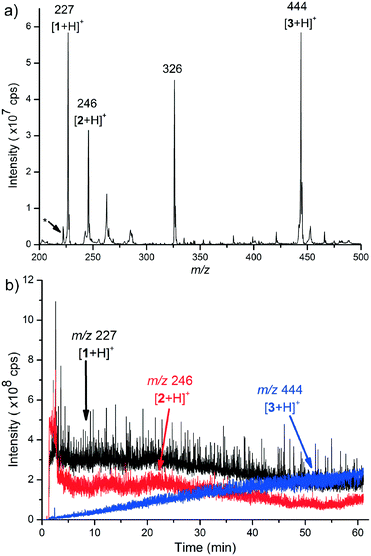
Online reaction measurements started by infusion of the reactant solutions 1 and 2 from separate syringes and via separate inlets into the reactor (details, ESI† sections 2 and 4). The infusion flow rate was 125 μL min−1 and both reactant solutions were infused for one minute, which resulted in the complete filling of the reaction chamber. Mass spectra were recorded continuously from the start of the reactant infusion. The reactants (1 and 2) and the product, i.e. ring-fused 4,5-dihydropyridazine 3, were observed as protonated molecules at m/z 227, 246 and 444, respectively (Fig. 3a and S3–S9†). The extracted ion profiles of the ions [1 + H]+, [2 + H]+, and [3 + H]+ presented in Fig. 3b show an increase in the ion current of the protonated product and decreases in ion currents of the protonated starting materials, which demonstrate that the reaction occurred in the 3D printed reactor.
MSn and accurate mass measurements were performed to study the structures of the reactants (1 and 2) and to confirm the structure of the reaction product 3 (Tables S2 and S3, Fig. S11–S17, and Schemes S2–S6†). MSn measurements (online and offline) were carried out using both an ion trap mass spectrometer and an Orbitrap mass spectrometer. Both mass spectrometers allow measurement of MS2 and MS3 product ion mass spectra and in addition the Orbitrap mass spectrometer allows accurate mass measurement of product ions in both measurement types. The Orbitrap mass spectrometer was used to confirm the identity of the ions observed in the ion trap measurements.
The [1 + H]+ (m/z 227) ion mainly fragments to m/z 119, 102, and 75 (Fig. S12 and Scheme S3†). The product ion with m/z 119 was interpreted to be [1 + H–C8H12]+, m/z 102 was [1 + H–C8H12–NH3]+, and m/z 75 was [1 + H–C9H12O2]+. The precursor ion [2 + H]+ (m/z 246) mainly yields the product ions m/z 177, 160, and 120 (Fig. S13 and Scheme S4†). The product ion with m/z 177 is feasibly explained as [2 + H–N2–CH3CN]+, the fragment with m/z 160 as [2 + H–NH3–C2H3N3]+, and the one with m/z 120 as [2 + H–NH3–C2H3N3–C3H4]+. The protonated product, [3 + H]+ (m/z 444), mainly fragments to m/z 326, which is interpreted as [3 + H–C4H10N2O2]+ (Fig. S15 and Scheme S5†). However, the peak with m/z 326 is also present as one of the main peaks in the mass spectrum presented in Fig. 3a. The product ion mass spectrum (MS2) of the ion m/z 326 selected directly from the mass spectrum was observed to be almost identical to the product ion mass spectrum (MS3) of the ion m/z 326, which was formed in the MS2 measurement of the [3 + H]+ precursor ion (Fig. S14 vs. S17, Scheme S6†). This observation indicates that the ion m/z 326 manifested in the mass spectrum presented in Fig. 3a is a fragment ion of m/z 444 that was formed during the ionisation. A further indication that supports this interpretation is the observation that the increase in intensity of the ion m/z 326 was similar to that of the protonated product as the reaction proceeded (Fig. S10†). An additional interesting ion seen in the mass spectra in Fig. 3a (and S6–S9†) is the ion m/z 222, which was identified to be a doubly charged product, [3 + 2H]2+, when we used MS2, MS3 and accurate mass measurements (Scheme S2 and ESI† section 5.6).
The functional capability of the integrated stir bar was ascertained by infusing testosterone and partially deuterated testosterone-d3 into the miniaturised reactor and using the same mass spectrometric set-up as that in the online reaction studies with the ion trap mass spectrometer (ESI† section 6). These compounds were used because they produce comparably intense peaks for their protonated molecules in electrospray ionisation. In addition, the fact that these two species will not react with each other helps to decouple the mixing from possible chemical phenomena. Fig. S18–S20† show the extracted ion profiles of testosterone and testosterone-d3 and their ratios, with and without the stirring activated, from the experiments in which the stirring effect was clearly seen. The stirring effect was not observed clearly all the time, which was possibly due to the relatively small volume of the reaction chamber and randomness of the liquids' flow behavior during the filling process. Hence, the results of the stirring experiment are not entirely conclusive. After the stirrer was activated at t = 1 min, or due to diffusion mixing of the analytes in the case of no mechanical stirring, the analyte signals started to stabilise. We observed that the signals of the analytes stabilise faster when the stirrer is used compared to when it is inactive (Fig. S18–S20†).
In conclusion, a miniaturised 3D printed reactor with an integrated nano-ESI capillary and a magnetic stir bar is presented for the first time. The reactor is fabricated from PP, thus it is resistant to a great number of inorganic and organic reagents and solvents. The price of one reactor is approximately 100 €, which is almost entirely due to the price of the nano-ESI capillary. On the other hand, the necessity of expensive clean room facilities is avoided by using an affordable 3D printer, which allows rapid and cheap prototyping of new reactor designs when needed. The benefits of integrating a nano-ESI capillary within the miniaturised reactor structure are minimal distance and volume between the reactor chamber and ESI capillary tip as well as minimisation of dead volumes. More importantly, the integrated nano-ESI capillary allows direct and fast MS analysis of the reaction mixture without external pumps, since the electrospray process itself pulls the reaction solution from the reaction chamber. Here, operation of the miniaturised reactor is shown by online analysis of a Diels–Alder reaction and the subsequent retro Diels–Alder reaction. Furthermore, thanks to the inert nature of PP, the device can be reused and its applications can be extended to many other reaction studies, such as enzymatic reactions and inorganic reactions.
Acknowledgements
Dr. Anu Vaikkinen is thanked for laboratory tutoring. Financial support was provided by the Academy of Finland (projects 276627, 257685, and 257316) and the TEKES Large Strategic Research Opening project (40395/13). The authors declare no competing financial interest.References
- M. J. Madou, Fundamentals of Microfabrication: The Science of Miniaturization, 2nd edn, CRC Press, 2002 Search PubMed.
- G. M. Whitesides, Nature, 2006, 442, 368–373 CrossRef CAS PubMed.
- A. Bonyár, H. Sántha, B. Ring, M. Varga, J. Gábor Kovács and G. Harsányi, Procedia Eng., 2010, 5, 291–294 CrossRef.
- M. Vaezi, H. Seitz and S. Yang, Int. J. Adv. Manuf. Technol., 2013, 67, 1721–1754 CrossRef.
- P. F. O’Neill, A. Ben Azouz, M. Vázquez, J. Liu, S. Marczak, Z. Slouka, H. C. Chang, D. Diamond and D. Brabazon, Biomicrofluidics, 2014, 8, 052112 CrossRef PubMed.
- K. C. Hribar, P. Soman, J. Warner, P. Chung and S. Chen, Lab Chip, 2014, 14, 268–275 RSC.
- C. M. B. Ho, S. H. Ng, K. H. H. Li and Y.-J. Yoon, Lab Chip, 2015, 15, 3627–3637 RSC.
- A. K. Au, W. Huynh, L. F. Horowitz and A. Folch, Angew. Chem., Int. Ed., 2016, 55, 3862–3881 CrossRef CAS PubMed.
- S. K. Anciaux, M. Geiger and M. T. Bowser, Anal. Chem., 2016, 88, 7675–7682 CrossRef CAS PubMed.
- A. A. Yazdi, A. Popma, W. Wong, T. Nguyen, Y. Pan and J. Xu, Microfluid. Nanofluid., 2016, 20, 50 CrossRef.
- R. Amin, S. Knowlton, A. Hart, B. Yenilmez, F. Ghaderinezhad, S. Katebifar, M. Messina, A. Khademhosseini and S. Tasoglu, Biofabrication, 2016, 8, 022001 CrossRef PubMed.
- Y. Zhang, S. Ge and J. Yu, TrAC, Trends Anal. Chem., 2016, 85(Part C), 166–180 CrossRef CAS.
- P. J. Kitson, M. H. Rosnes, V. Sans, V. Dragone and L. Cronin, Lab Chip, 2012, 12, 3267–3271 RSC.
- M. D. Symes, P. J. Kitson, J. Yan, C. J. Richmond, G. J. T. Cooper, R. W. Bowman, T. Vilbrandt and L. Cronin, Nat. Chem., 2012, 4, 349–354 CrossRef CAS PubMed.
- T. Monaghan, M. J. Harding, R. A. Harris, R. J. Friel and S. D. R. Christie, Lab Chip, 2016, 16, 3362–3373 RSC.
- J. S. Mathieson, M. H. Rosnes, V. Sans, P. J. Kitson and L. Cronin, Beilstein J. Nanotechnol., 2013, 4, 285–291 CrossRef PubMed.
- G. I. Salentijn, H. P. Permentier and E. Verpoorte, Anal. Chem., 2014, 86, 11657–11665 CrossRef CAS PubMed.
- L. C. Duarte, T. C. de Carvalho, E. O. Lobo-Júnior, P. V. Abdelnur, B. G. Vaz and W. K. T. Coltro, Anal. Methods, 2016, 8, 496–503 RSC.
- M. Wilm and M. Mann, Anal. Chem., 1996, 68, 1–8 CrossRef CAS PubMed.
- P. Hoffmann, U. Häusig, P. Schulze and D. Belder, Angew. Chem., Int. Ed., 2007, 46, 4913–4916 CrossRef CAS PubMed.
- S. Fritzsche, S. Ohla, P. Glaser, D. S. Giera, M. Sickert, C. Schneider and D. Belder, Angew. Chem., Int. Ed., 2011, 50, 9467–9470 CrossRef CAS PubMed.
- C. Benz, M. Boomhoff, J. Appun, C. Schneider and D. Belder, Angew. Chem., Int. Ed., 2015, 54, 2766–2770 CrossRef CAS PubMed.
- X. Hu, Y. Dong, Q. He, H. Chen and Z. Zhu, J. Chromatogr., B, 2015, 990, 96–103 CrossRef CAS PubMed.
- X. Feng, B.-F. Liu, J. Li and X. Liu, Mass Spectrom. Rev., 2015, 34, 535–557 CrossRef CAS PubMed.
- C. Dietze, T. Scholl, S. Ohla, J. Appun, C. Schneider and D. Belder, Anal. Bioanal. Chem., 2015, 407, 8735–8743 CrossRef CAS PubMed.
- C. Dietze, S. Schulze, S. Ohla, K. Gilmore, P. H. Seeberger and D. Belder, Analyst, 2016, 141, 5412–5416 RSC.
- C. Lotter, E. Poehler, J. J. Heiland, L. Mauritz and D. Belder, Lab Chip, 2016, 16, 4648–4652 RSC.
- Y. Yang, F. Han, J. Ouyang, Y. Zhao, J. Han and N. Na, Anal. Chim. Acta, 2016, 902, 135–141 CrossRef CAS PubMed.
- F. Liu, R. S. Paton, S. Kim, Y. Liang and K. N. Houk, J. Am. Chem. Soc., 2013, 135, 15642–15649 CrossRef CAS PubMed.
Footnotes |
| † Electronic supplementary information (ESI) available: Instructions on 3D printing of the miniaturised reactor and the measurement jig (3D design files for the miniaturised reactor and the measurement jig included (STL)), MS measurement set-up and conditions, reagents, mass spectra, MSn mass spectra, fragmentation tables and schemes, accurate mass data and the mixer experimental results (PDF). See DOI: 10.1039/c7re00015d |
| ‡ G. S. and S. M. E. N. contributed equally. |
| This journal is © The Royal Society of Chemistry 2017 |


