 Open Access Article
Pressure induced polymerization of acetylide anions in CaC2 and 107 fold enhancement of electrical conductivity†
Haiyan
Zheng‡
a,
Lijuan
Wang‡
a,
Kuo
Li
*ab,
Youyou
Yang
c,
Yajie
Wang
a,
Jiajia
Wu
d,
Xiao
Dong
a,
Chun-Hai
Wang
e,
Christopher A.
Tulk
f,
Jamie J.
Molaison
f,
Ilia N.
Ivanov
g,
Mikhail
Feygenson
f,
Wenge
Yang
abh,
Malcolm
Guthrie§
b,
Yusheng
Zhao
i,
Ho-Kwang
Mao
ab and
Changqing
Jin
jk
aCenter for High Pressure Science and Technology Advanced Research (HPSTAR), PO Box 8009, Beijing, 100088, China. E-mail: likuo@hpstar.ac.cn
bGeophysical Laboratory, Carnegie Institution of Washington, Washington DC, 20015, USA
cCOFCO Nutrition & Health Research Institute, Beijing Key Laboratory of Nutrition Health and Food Safety, Beijing 100209, China
dAgilent Technologies (China) Co., Ltd., Wangjingbei Road, Chaoyang District, Beijing 100102, China
eDepartment of Chemistry, Durham University, South Road, Durham, DH1 3 LE, UK
fSpallation Neutron Source, Oak Ridge National Laboratory, Oak Ridge, TN 37830, USA
gCentre for Nanophase Materials Sciences, Oak Ridge National Laboratory, Oak Ridge, TN 37831, USA
hHPSynC, Geophysical Laboratory, Carnegie Institution of Washington, Argonne, IL 60439, USA
iDept. of Physics, Southern University of Science and Technology, ShenZhen, China.
jInstitute of Physics, Chinese Academy of Sciences, Beijing 100190, China
kCollaborative Innovation Centre of Quantum Matter, Beijing, China
First published on 17th August 2016
Abstract
Transformation between different types of carbon–carbon bonding in carbides often results in a dramatic change of physical and chemical properties. Under external pressure, unsaturated carbon atoms form new covalent bonds regardless of the electrostatic repulsion. It was predicted that calcium acetylide (also known as calcium carbide, CaC2) polymerizes to form calcium polyacetylide, calcium polyacenide and calcium graphenide under high pressure. In this work, the phase transitions of CaC2 under external pressure were systematically investigated, and the amorphous phase was studied in detail for the first time. Polycarbide anions like C66− are identified with gas chromatography-mass spectrometry and several other techniques, which evidences the pressure induced polymerization of the acetylide anions and suggests the existence of the polyacenide fragment. Additionally, the process of polymerization is accompanied with a 107 fold enhancement of the electrical conductivity. The polymerization of acetylide anions demonstrates that high pressure compression is a viable route to synthesize novel metal polycarbides and materials with extended carbon networks, while shedding light on the synthesis of more complicated metal organics.
Introduction
The metal carbide family is a large one containing several groups, including the materials based on extended 2D carbon structures, like the graphene-based Li-battery anode material LiC6, and 0D ionic compounds like the C60-based superconductor K3C60, acetylide-based salts CaC2 and Mg2C, as well as other groups. Their numerous intriguing physical and chemical properties are related to their structural peculiarities, which benefit from the rich chemistry of carbon. Compressing carbides to tens of gigapascals will facilitate the bonding between the isolated carbon groups, which will hence change the electrical properties significantly. For example, BeC2 and MgC2 are predicted to contain five-membered carbon rings,1 and Li2C2 and BaC2 are predicted to have polyanionic structures,2,3 but only a few of these topics have been investigated experimentally.3CaC2 is the most important and common metal carbide used in industry. It is part of a large group of metal carbides that are composed of M2+ and the dumbbell-shaped C22− anion. The polymorphs of CaC2 have been studied for almost a century,4–6 and four crystalline phases have been identified at ambient pressure, named CaC2-I (space group (SG) I4/mmm); CaC2-II (SG C2/c); CaC2-III (SG C2/m); and CaC2-IV (SG Fm![[3 with combining macron]](https://www.rsc.org/images/entities/char_0033_0304.gif) m). All of these phases are composed of Ca2+ and C22− in various configurations. Recently, several new polymorphs of CaC2 stable under external pressure were predicted by theoretical researchers, with the C22− dumbbell-shaped anions connecting to one another to form carbon chains, graphene ribbons or sheets, which are actually Ca-graphenide, Ca-polyacenide and Ca-polyacetylide.7–9 These polymorphs are expected to be metallic, and superconductive at low temperature.7 However, up to now, experimental investigations of the high pressure transformation of CaC2 have been subject to controversy. Two phase transitions were reported, with the first at 10–12 GPa, followed by an amorphization at a pressure above ∼18 GPa.10,11 Very recently, another report suggested the existence of the predicted Cmcm phase (Ca polyacetylide) above 7 GPa, and confirmed the amorphization upon further compression again.12 The amorphization hindered almost all further investigations. In this work, we experimentally probed both the crystallized phases before the amorphization and the amorphous phase using several cutting-edge techniques, and evidenced the existence of linear and cyclic polycarbide anions in the product of the pressure induced polymerization of CaC2.
m). All of these phases are composed of Ca2+ and C22− in various configurations. Recently, several new polymorphs of CaC2 stable under external pressure were predicted by theoretical researchers, with the C22− dumbbell-shaped anions connecting to one another to form carbon chains, graphene ribbons or sheets, which are actually Ca-graphenide, Ca-polyacenide and Ca-polyacetylide.7–9 These polymorphs are expected to be metallic, and superconductive at low temperature.7 However, up to now, experimental investigations of the high pressure transformation of CaC2 have been subject to controversy. Two phase transitions were reported, with the first at 10–12 GPa, followed by an amorphization at a pressure above ∼18 GPa.10,11 Very recently, another report suggested the existence of the predicted Cmcm phase (Ca polyacetylide) above 7 GPa, and confirmed the amorphization upon further compression again.12 The amorphization hindered almost all further investigations. In this work, we experimentally probed both the crystallized phases before the amorphization and the amorphous phase using several cutting-edge techniques, and evidenced the existence of linear and cyclic polycarbide anions in the product of the pressure induced polymerization of CaC2.
Results and discussion
Variation of crystal structure
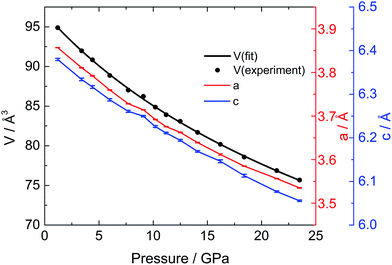
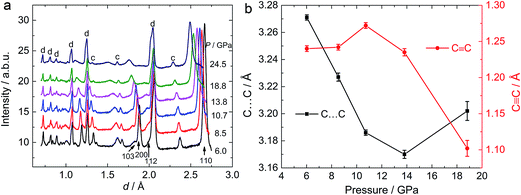
To investigate the phase transitions under high pressure, multiple in situ techniques including high pressure X-ray diffraction (XRD), neutron diffraction and Raman spectroscopy were employed. The lattice parameters of CaC2-I under high pressure were determined by in situ XRD. In similarity to previous reports,10,11 CaC2 starts to amorphize above 18–20 GPa, above which the XRD peaks start to broaden and become indistinguishable. The unit cell parameters of CaC2 under external pressure were determined by Rietveld refinement (Fig. 1). The reported phase transition at 10–12 GPa is too subtle to be confirmed in the plot of the pressure dependent lattice parameters, and the lattice parameter of the whole pressure range before amorphization can be fitted to a 3rd order Birch–Murnaghan (B–M) Equation of State (EOS), with V0 = 96.7(2) Å3, B0 = 62(2) GPa, and B1 = 3.6(2).To understand the structural details of CaC2 under high pressure, in situ neutron diffraction was carried out (Fig. 2a), which is more sensitive to the positions of carbon atoms. The diffraction patterns below 10 GPa can be well fitted using the CaC2-I structural model. The refined results are shown in Table S1† and a selected plot of Rietveld refinement is shown in Fig. S1.† However, above 10–12 GPa, the hkl peaks with l ≠ 0 are significantly broadened, the C![[triple bond, length as m-dash]](https://www.rsc.org/images/entities/char_e002.gif) C bond length decreases significantly to unreasonable values and the nearest C⋯C intergroup distances increase correspondingly (Fig. 2b). This indicates that the CaC2-I model is not suitable for the data above 10–12 GPa, though the averaged structure does not deviate from CaC2-I dramatically. The reason for peak broadening comes from strain or disordering, most likely in the sub-structure of C instead of Ca, because the broadening is more pronounced in neutron diffraction.
C bond length decreases significantly to unreasonable values and the nearest C⋯C intergroup distances increase correspondingly (Fig. 2b). This indicates that the CaC2-I model is not suitable for the data above 10–12 GPa, though the averaged structure does not deviate from CaC2-I dramatically. The reason for peak broadening comes from strain or disordering, most likely in the sub-structure of C instead of Ca, because the broadening is more pronounced in neutron diffraction.
The anomaly at 10–12 GPa was also found in the impedance spectrum, which will be discussed later. This can probably be attributed to the instability and interruption of the CaC2-I lattice, because CaC2-VI is more stable at this pressure, as predicted by theoretical investigations.7,8,10 Our Density Functional Theory (DFT) calculations also show that CaC2-VI is more stable than CaC2-I above 9 GPa (Table S2†). As shown in Fig. 3, CaC2-VI (Fig. 3b) is a distortion of CaC2-I (Fig. 3a), with β deviating from 90° and its space group I2/m being a subgroup of I4/mmm. Because no characteristic peak of CaC2-VI can be identified under current experimental conditions, it seems the I–VI phase transition did not really go through, and the sample still stays in an intermediate state, like that shown in Fig. 3c. In this state, CaC2-I is unstable; the phase transition starts locally (local disordering), but the new phase is not crystallized and cannot be identified.
Spectroscopic investigation
To probe the functional groups, Raman spectroscopy was employed to detect the transition of the carbon–carbon bonds. In similarity to the reported results,10 both the C–C stretching and C2 libration modes show minor alterations at 10–12 GPa (Fig. 4a), which corresponds to the transition uncovered by the neutron diffraction experiment. Above 18–20 GPa, the Raman peaks start to degrade and disappear into the background, corresponding to the amorphization (Fig. S2†). After being maintained at ∼30 GPa for 2 days, a minor peak at 1839 cm−1 was observed, which is significantly lower than the C![[triple bond, length as m-dash]](https://www.rsc.org/images/entities/char_e002.gif) C stretching of CaC2 before its disappearance (1916 cm−1, Fig. 4b). When decompressed, the peak becomes more obvious and splits to two peaks at 1690 and 1850 cm−1 (3.9 GPa) respectively. Such a peak should be attributed to an intermediate (or conjugated) state between a triple bond and a double bond, because its Raman shift is located between typical values for those bonds. The peak at 1850 cm−1 is still around the region of triple bonds, while the peak at 1690 cm−1 is approaching the region of double bond. This splitting provides further evidence that the peak at 1839 cm−1 (before splitting) is from polymerized (oligomerized) carbon anions created by high pressure. Its decomposition at low pressure results in isolated triple bonds and other complex containing double bonds.
C stretching of CaC2 before its disappearance (1916 cm−1, Fig. 4b). When decompressed, the peak becomes more obvious and splits to two peaks at 1690 and 1850 cm−1 (3.9 GPa) respectively. Such a peak should be attributed to an intermediate (or conjugated) state between a triple bond and a double bond, because its Raman shift is located between typical values for those bonds. The peak at 1850 cm−1 is still around the region of triple bonds, while the peak at 1690 cm−1 is approaching the region of double bond. This splitting provides further evidence that the peak at 1839 cm−1 (before splitting) is from polymerized (oligomerized) carbon anions created by high pressure. Its decomposition at low pressure results in isolated triple bonds and other complex containing double bonds.
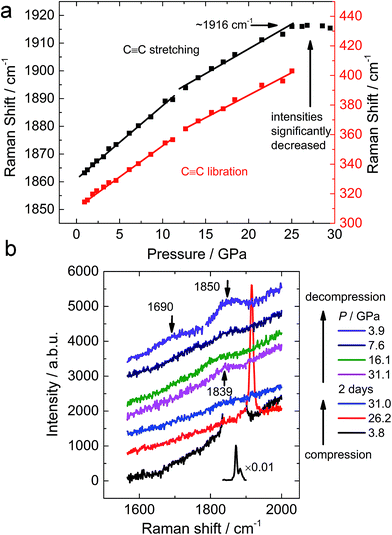 | ||
| Fig. 4 (a) Pressure dependence of Raman shifts of CaC2 and (b) selected Raman spectra of CaC2 upon compression and decompression. | ||
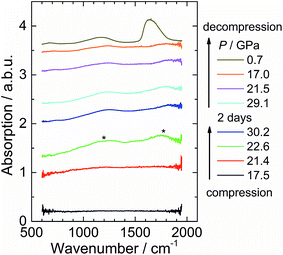
In situ infrared spectra were also measured to detect the vibration of carbon species (Fig. 5). The C–C stretching of the acetylide anion is symmetrical and is hence infrared inactive. This is why no absorption peak was observed at low pressure (up to ∼21 GPa). Above 22 GPa, absorption peaks around 1750 cm−1 and 1200 cm−1 are observed. These peaks are in the range of the stretching modes of C![[double bond, length as m-dash]](https://www.rsc.org/images/entities/char_e001.gif) C double bonds and C–C single bonds. The bonds have to be asymmetric as they are infrared active, which means the carbon atom has at least two neighbours covalently bonded, and hence evidences the bonding between C22−.
C double bonds and C–C single bonds. The bonds have to be asymmetric as they are infrared active, which means the carbon atom has at least two neighbours covalently bonded, and hence evidences the bonding between C22−.
Identification of polycarbide anions in the recovered sample
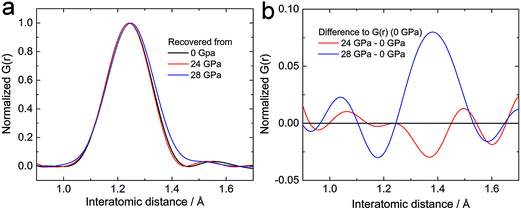
From the crystallographic and spectroscopic analysis, we conclude that the polymerization of acetylide anions happens in the amorphous state. The polycarbide anions would hence hide in the amorphous phase. Besides the spectroscopic investigations, neutron pair distribution function (PDF) analysis is employed to investigate the local structure of the amorphous phase, which gives the likelihood of finding an atom at a given radius from another atom at an arbitrary origin.13 Obtaining good in situ PDF data above 20 GPa for CaC2 is very challenging, if not impossible, therefore samples recovered from external pressure were measured (Fig. S3a†). No other periodic phase was identified from the recovered samples except CaC2 (phase I, starting material). However, a distinct difference was found at the C![[triple bond, length as m-dash]](https://www.rsc.org/images/entities/char_e002.gif) C triple bond distance (d ∼ 1.24 Å). The peak of the sample recovered from ∼28 GPa is shifted to a greater radial distance and shows evidence for enhanced density between 1.3 Å and 1.5 Å when compared to that recovered from below 24 GPa (Fig. 6, more patterns in Fig. S3†). This verifies the presence of longer carbon–carbon bonds (C
C triple bond distance (d ∼ 1.24 Å). The peak of the sample recovered from ∼28 GPa is shifted to a greater radial distance and shows evidence for enhanced density between 1.3 Å and 1.5 Å when compared to that recovered from below 24 GPa (Fig. 6, more patterns in Fig. S3†). This verifies the presence of longer carbon–carbon bonds (C![[double bond, length as m-dash]](https://www.rsc.org/images/entities/char_e001.gif) C bonds) in the sample recovered from the highest pressure, which would be the product of the addition reaction between C22− ions.
C bonds) in the sample recovered from the highest pressure, which would be the product of the addition reaction between C22− ions.
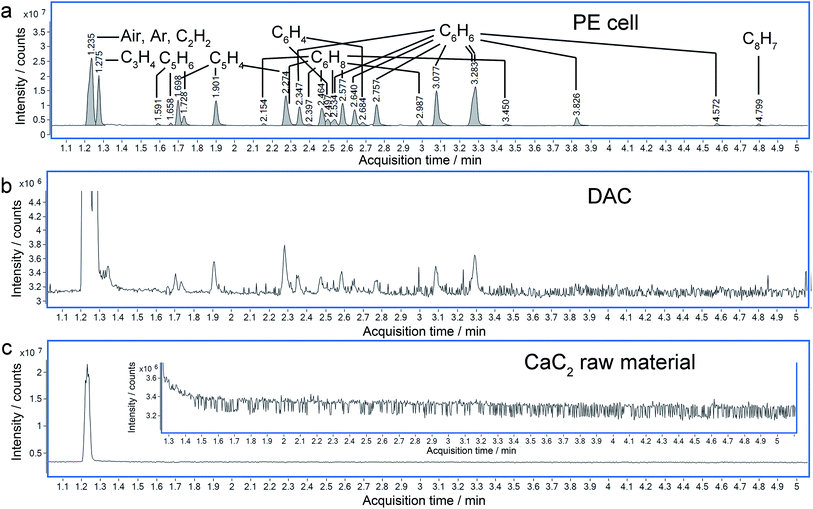
More solid evidence comes from the Gas Chromatography-Mass Spectrometry (GC-MS) analysis. The hydrolysis of the polymerized Cmx− (here, x is supposed to be equal to m) anions in the recovered sample will produce C2nH2n (CanC2n + 2nH2O = nCa(OH)2 + C2nH2n↑). In the hydrolyzed products, several tens of hydrocarbons were identified by GC-MS, which were not detected in the raw material (Fig. 7). It is worthy to point out that even with sub-microgram amounts of sample synthesized using a diamond anvil cell (DAC), similar results were obtained to those with a milligram amount of sample synthesized using a Paris-Edinburgh (PE) cell. This approach demonstrates that GC-MS has a significant application in the characterization of chemical reactions under extremely high pressure.
With the data obtained from the high-resolution quadrupole-time- of -flight-mass spectrometer (QTOF-MS), the molecular formulas of most peaks in the total ion chromatograms (TIC) can be determined unambiguously, as listed in Table S3.† These include C3H4, C5H6, C5H4, C6H8, C6H6, C6H4, and C8H7 in the gas phase, with various numbers of isomers. More complicated molecules like C12H12, C12H10 and C12H14 can be identified in the liquid phase (Fig. S4 and Table S4†), and their diversities will be discussed in a following paper. All the identified molecules have a C![[thin space (1/6-em)]](https://www.rsc.org/images/entities/char_2009.gif) :
:![[thin space (1/6-em)]](https://www.rsc.org/images/entities/char_2009.gif) H ratio around 1
H ratio around 1![[thin space (1/6-em)]](https://www.rsc.org/images/entities/char_2009.gif) :
:![[thin space (1/6-em)]](https://www.rsc.org/images/entities/char_2009.gif) 1, in consistency with the valence of carbon in CaC2. The slight deviations from 1
1, in consistency with the valence of carbon in CaC2. The slight deviations from 1![[thin space (1/6-em)]](https://www.rsc.org/images/entities/char_2009.gif) :
:![[thin space (1/6-em)]](https://www.rsc.org/images/entities/char_2009.gif) 1 probably result from the heterolytic cleavage of some unstable molecules or anions after or during the hydrolysis. The molecules with odd numbers of carbon atoms like C3H4 and C5H4 also likely result from cleavage, because the combination of C22− anions can only result in molecules with even numbers of carbon atoms. Hydrocarbons like C2H6, C2H4, C4H8 and those with a C
1 probably result from the heterolytic cleavage of some unstable molecules or anions after or during the hydrolysis. The molecules with odd numbers of carbon atoms like C3H4 and C5H4 also likely result from cleavage, because the combination of C22− anions can only result in molecules with even numbers of carbon atoms. Hydrocarbons like C2H6, C2H4, C4H8 and those with a C![[thin space (1/6-em)]](https://www.rsc.org/images/entities/char_2009.gif) :
:![[thin space (1/6-em)]](https://www.rsc.org/images/entities/char_2009.gif) H molar ratio severely deviating from 1
H molar ratio severely deviating from 1![[thin space (1/6-em)]](https://www.rsc.org/images/entities/char_2009.gif) :
:![[thin space (1/6-em)]](https://www.rsc.org/images/entities/char_2009.gif) 1 are not detected, which excludes the existence of C26−, C24−, C48− and the corresponding calcium carbide. This indicates that the non-ox/red polymerization (or oligomerization) instead of disproportionation (or other ox/red reactions) dominates the reaction process, and the Ca
1 are not detected, which excludes the existence of C26−, C24−, C48− and the corresponding calcium carbide. This indicates that the non-ox/red polymerization (or oligomerization) instead of disproportionation (or other ox/red reactions) dominates the reaction process, and the Ca![[thin space (1/6-em)]](https://www.rsc.org/images/entities/char_2009.gif) :
:![[thin space (1/6-em)]](https://www.rsc.org/images/entities/char_2009.gif) C molar ratio does not really change during the reaction.
C molar ratio does not really change during the reaction.
By checking the corresponding mass spectrum in the National Institute of Standards and Technology (NIST) library, the peaks in the TIC are recognized. The list of possible molecules includes both linear and cyclic molecules, which result from the hydrolysis of linear and cyclic polycarbide anions respectively. By comparing the retention times, benzene can be identified unambiguously (Fig. S5 and S6†) among the peaks, which indicates the formation of C66− cyclic structures in the recovered CaC2. It was predicted that carbon atoms tend to polymerize following the sequence of chain, belt and sheet, with increasing pressure. Both of the latter two structures (Ca polyacenide and Ca graphenide) contain six-membered rings.7 Our experiment evidenced that under the current experimental conditions it is possible for C22− to polymerize to polyacenide (Immm phase in ref. 7) or its fragment, which was predicted to be stabilized above ∼15 GPa. The chain structures can also exist due to incomplete reactions.
Calibrated by the working curve, the molar ratio of benzene to acetylene in the hydrolysis product is ∼0.005![[thin space (1/6-em)]](https://www.rsc.org/images/entities/char_2009.gif) :
:![[thin space (1/6-em)]](https://www.rsc.org/images/entities/char_2009.gif) 1 (Fig. S7†). Even if supposing other produced molecules respond at the same efficiency as benzene in MS (usually lower, thus the actual concentration is higher), the molar ratio of product to acetylene is 0.11
1 (Fig. S7†). Even if supposing other produced molecules respond at the same efficiency as benzene in MS (usually lower, thus the actual concentration is higher), the molar ratio of product to acetylene is 0.11![[thin space (1/6-em)]](https://www.rsc.org/images/entities/char_2009.gif) :
:![[thin space (1/6-em)]](https://www.rsc.org/images/entities/char_2009.gif) 1. This indicates that a significant amount of C22− is reacted under the current experimental conditions. The details of the quantitative analysis are discussed in the ESI.†
1. This indicates that a significant amount of C22− is reacted under the current experimental conditions. The details of the quantitative analysis are discussed in the ESI.†
Meta-dynamic simulation
To build up a model to understand what happens in CaC2 under external pressure, meta-dynamic simulations were performed at 30 GPa and two models were obtained (referred as to chain and ribbon models, shown in Fig. 8). In the chain structure, the acetylide anions are connected to form polyacetylide chains. Both cis- and trans- connections are formed, and branched chains are also obtained. Starting from this structure, a meta-dynamic simulation was conducted again and the ribbon structure was obtained, which is constructed by edge-sharing six-membered rings. These two models show the structural features of the sample under pressure and are consistent with the theoretical predictions in ref. 7, though with some defects. These two models are closely related. In the chain model, six-membered rings are identified and in the ring model, chains still exist. The co-existence of ring and chains is most likely the real case, as evidenced by the GC-MS experiment. It is worthy to note that the simulation is carried out using a box containing 64 Ca and 128 C atoms, constrained by periodic boundary conditions. It can be anticipated that in the experiment the local structure will be more diverse, and it would be difficult for the produced covalent carbon network to crystallize.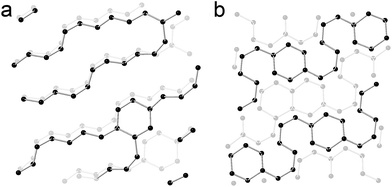 | ||
| Fig. 8 Simulated structure of CaC2 at 30 GPa by meta-dynamics. (a) Chain model. (b) Ribbon model. The C–C bond limitation is set at 1.6 Å. Ca ions are omitted for clarity. | ||
This diversity uncovered by the simulation and experiment actually traced the whole process of polymerization, from small species to big ones, from chains to rings and ribbons. This is most likely what happened in the amorphous phase. The monomers polymerize with various degrees of polymerization and even in various dimensions. If the selectivity of the reaction is enhanced by controlling reaction conditions, more complex and kinetically stable metal carbides on milligram scales can be obtained besides the predicted phases.7 Because the calcium polycarbide obtained is nucleophilic and highly reactive, more unexpected compounds can be synthesized through reaction with acid or via other nucleophilic reactions. The neutral molecules can even be separated by chromatography and purified.
Decreased resistivity
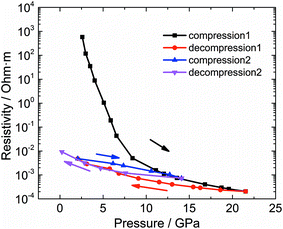
One of the most attractive properties of the metal carbide materials is their electrical property, which is closely related to its structure.7 In this work, the pressure dependent resistivity of CaC2 was measured. From ∼2 GPa to ∼22 GPa, the resistivity decreases by seven orders of magnitude (Fig. 9), with a turning point at the minor transition around 10–12 GPa. From ∼10 GPa to 22 GPa, the resistivity decreases by 1 order of magnitude, while below 10 GPa, it decreases by six orders. This significant decrease of resistivity (R) should be attributed to the decrease of both Rg and Rgb, where Rg and Rgb stand for the resistance of grains and grain boundaries respectively. Because R = Rg + Rgb and Rg and Rgb are usually in the same order of magnitude, for a 107 fold decrease, both Rg and Rgb should decrease. The decrease of Rg is most likely attributed to the narrowing of the band gap. The band gap of CaC2-I decreases when compressed (Fig. S8†) and reaches 0 eV at ∼18 GPa as indicated by the theoretical calculations (Fig. S9† by interpolation). The interaction between C22− units is enhanced when the C⋯C distance is decreased, which broadens the energy bands and reduces the band gap. Quantitatively, from the formula ,14 we can derive
  (Eg in eV), where ρ and σ are the resistivity and conductivity, n is the concentration of electrons and holes, N− and N+ are the density of states at the bottom of the conduction band and the top of the valence band, μ− and μ+ are the carrier mobilities, Eg is the band gap, k is the Boltzmann constant, T is the absolute temperature, and e is the charge of an electron. From 2 GPa to 6 GPa, ΔEg = 0.23 eV, and the variation of the second term Δ(8.46Eg) = 2, which is partly responsible for the decrease of lg
![[thin space (1/6-em)]](https://www.rsc.org/images/entities/char_2009.gif) ρ (∼4) (Table S2†). The other remainder of the decrease should be attributed to the enhancing of N−, N+, μ+, and/or μ− in the first term,
ρ (∼4) (Table S2†). The other remainder of the decrease should be attributed to the enhancing of N−, N+, μ+, and/or μ− in the first term,  , or other extrinsic reasons. In the view of real (direct) space, the decrease of R can simply be attributed to the increasing overlap of the π and π*-orbitals, which enhances the mobilities (μ− and μ+). This is similar to fused-ring molecules under high pressure.15
The irreversibility of the resistance decrease is evidenced by the two compression loops. This irreversibility is most likely attributed to the covalent bonding between the acetylide anions. The transitions accompanied with the formation of covalent bonds are often (kinetically) stable, just like the transition from graphite to diamond. In this work we show it is also true for metal carbides in the experimental time scale. The high conductivity is also recovered, which suggests that this pressure induced polymerization can be used to prepare conductive metal polycarbide materials from insulating monomers.
It is also notable that the d-orbital of Ca2+ also contributes to the valence band and the conduction band, as indicated by the theoretical calculations (shown in Fig. S8†). In compounds with the same structure, such as UC2, U donates 6d electrons to C2, forming a C24− anion, and UC2 is metallic.16 As such, the d–π interaction acts as another important factor that may affect the conductivity. Additionally, it also suggests the possibility of introducing a transition metal for doping, which is always a promising method to improve the conductivity, as in polyacetylene.17
Conclusions
In summary, the phase transitions of CaC2 under external pressure were systematically investigated and the polymerization of C22− was confirmed using in situ XRD, neutron diffraction, Raman, IR and impedance spectra, as well as neutron PDF and GC-MS. The reaction in the amorphous CaC2 was firstly probed. The polymerized product can be recovered to ambient pressure. Benzene and several other hydrocarbon molecules are identified in the hydrolyzed product of the recovered sample, which clearly evidences the formation of C66− and other polycarbide anions. Accompanied with the structural variations, the conductivity of CaC2 was enhanced by more than 107 fold, which demonstrates the dramatic effects of high pressure on the electrical properties of materials. The polymerization helps to stabilize the high conductivity at ambient pressure, and suggests the possibility to stabilize the predicted phases including calcium graphenide and calcium polyacetylide. This will have a great impact on the current research of functional metal-carbon materials, and more novel metal polycarbide materials can be expected from the high-pressure synthesis. In addition, since these highly charged species like C66− are easy to be functionalized, this method can be further applied to synthesize more complicated Ca organics and other metallic organics.Acknowledgements
The authors acknowledge the support of NSAF (Grant No. U1530402) and NSFC (Grant No. 21501162). This work was supported as part of the Energy Frontier Research in Extreme Environment Center (Efree), an Energy Frontier Research Center funded by the U.S. Department of Energy, Office of Science, Basic Energy Sciences under Award DE-SC0001057. A portion of this research was performed at HPCAT (Sector 16), Advanced Photon Source (APS), Argonne National Laboratory. HPCAT (Geophysical Lab) operations are supported by DOE-NNSA under Award No. DE-NA0001974 and DOE-BES under Award No. DE-FG02-99ER45775, with partial instrumentation funding by NSF. APS is supported by DOE-BES, under Contract No. DE-AC02-06CH11357. A portion of this research was conducted at the Center for Nanophase Materials Sciences and Spallation Neutron Source, which are sponsored at Oak Ridge National Laboratory by the Scientific User Facilities Division, Office of Basic Energy Sciences, U.S. Department of Energy. The authors thank Dr Antonio F. Moreira dos Santos for the help in the neutron diffraction experiment, Dr Hongping Yan for the help in the in situ XRD experiment and Dr George Cody for valuable discussion. SNAP pressure cells were used to synthesize many of the in situ and ex situ samples used in this study. Work at IOPCAS was supported by NSF & MOST through research projects. The authors thank Agilent Technologies (China), Inc. for assistance in the GC-MS experiment. The metadynamic calculations were performed at Tianhe II in Guangzhou which is supported by Special Program for Applied Research on Super Computation of the NSFC-Guangdong Joint Fund (the second phase).References
- P. Srepusharawoot, A. Blomqvist, C. Moysés Araújo, R. H. Scheicher and R. Ahuja, Phys. Rev. B: Condens. Matter Mater. Phys., 2010, 82, 125439 CrossRef.
- X. Q. Chen, C. L. Fu and C. Franchini, J. Phys.: Condens. Matter, 2010, 22, 292201 CrossRef PubMed.
- I. Efthimiopoulos, K. Kunc, G. V. Vazhenim, E. Stavrou, K. Syassen, M. Hanfland, St. Liebig and U. Ruschewitz, Phys. Rev. B: Condens. Matter Mater. Phys., 2012, 85, 054105 CrossRef.
- N.-G. Vannerberg, Acta Chem. Scand., 1962, 16, 1212–1220 CrossRef CAS.
- N.-G. Vannerberg, Acta Chem. Scand., 1961, 15, 769–774 CrossRef CAS.
- M. Knapp and U. Ruschewitz, Chem.–Eur. J., 2001, 7, 874–880 CrossRef CAS.
- Y. L. Li, W. Luo, Z. Zeng, H.-Q. Lin, H.-k. Mao and R. Ahuja, Proc. Natl. Acad. Sci. U. S. A., 2013, 110, 9289–9294 CrossRef CAS PubMed.
- A. Kulkarni, K. Doll, J. C. Schon and M. Jansen, J. Phys. Chem. B, 2010, 114, 15573–15581 CrossRef CAS PubMed.
- D. Benson, Y. Li, W. Luo, R. Ahuja, G. Svensson and U. Häussermann, Inorg. Chem., 2013, 52, 6402–6406 CrossRef CAS PubMed.
- J. Nylen, S. Konar, P. Lazor, D. Benson and U. Haussermann, J. Chem. Phys., 2012, 137, 224507 CrossRef PubMed.
- I. Efthimiopoulos, G. V. Vajenine, E. Stavrou, K. Syassen, St. Liebig, U. Ruschewitz and M. Hanfland, Acta Crystallogr., 2010, 66, s197 Search PubMed.
- L. Wang, X. Huang, D. Li, Y. Huang, K. Bao, F. Li, G. Wu, B. Liu and T. Cui, J. Chem. Phys., 2016, 144, 194506 CrossRef PubMed.
- S. J. L. Billinge and M. G. Kanatzidis, Chem. Commun., 2004, 749–760 RSC.
- K. Huang and R. Han, Solid State Physics, Higher Education Press, Beijing, 1st edn, 1988 Search PubMed.
- G. A. Samara and H. G. Drickamer, J. Chem. Phys., 1962, 37, 474–479 CrossRef CAS.
- J. Li and R. Hoffmann, Chem. Mater., 1989, 1, 83–101 CrossRef CAS.
- H. Shirakawa, E. J. Louis, A. G. Macdiarmid, C. K. Chiang and A. J. Heeger, J. Chem. Soc., Chem. Commun., 1977, 16, 578–580 RSC.
Footnotes |
| † Electronic supplementary information (ESI) available: Details of GC-MS analysis. See DOI: 10.1039/c6sc02830f |
| ‡ These authors contributed equally. |
| § Present address: European Spallation Source ERIC, Lund, Sweden. |
| This journal is © The Royal Society of Chemistry 2017 |

