 Open Access Article
Creative Commons Attribution 3.0 Unported Licence
SABRE hyperpolarisation of vitamin B3 as a function of pH†
A. M.
Olaru
a,
M. J.
Burns
a,
G. G. R.
Green
b and
S. B.
Duckett
 *a
*a
aCentre for Hyperpolarisation in Magnetic Resonance, Department of Chemistry, University of York, YO10 5NY, York, UK. E-mail: simon.duckett@york.ac.uk
bYork Neuroimaging Centre, University of York, YO10 5NY, York, UK
First published on 7th December 2016
Abstract
In this work we describe how the signal enhancements obtained through the SABRE process in methanol-d4 solution are significantly affected by pH. Nicotinic acid (vitamin B3, NA) is used as the agent, and changing pH is shown to modify the level of polarisation transfer by over an order of magnitude, with significant improvements being seen in terms of the signal amplitude and relaxation rate at high pH values. These observations reveal that manipulating pH to improve SABRE enhancements levels may improve the potential of this method to quantify low concentrations of analytes in mixtures. 1H NMR spectroscopy results link this change to the form of the SABRE catalyst, which changes with pH, resulting in dramatic changes in the magnitude of the ligand exchange rates. The presented data also uses the fact that the chemical shifts of the nicotinic acids NMR resonances are affected by pH to establish that hyperpolarised 1H-based pH mapping with SABRE is possible. Moreover, the strong polarisation transfer field dependence shown in the amplitudes of the associated higher order longitudinal terms offers significant opportunities for the rapid detection of hyperpolarised NA in H2O itself without solvent suppression. 1H and 13C MRI images of hyperpolarised vitamin B3 in a series of test phantoms are presented that show pH dependent intensity and contrast. This study therefore establishes that when the pH sensitivity of NA is combined with the increase in signal gain provided for by SABRE hyperpolarisation, a versatile pH probe results.
1. Introduction
Magnetic resonance imaging (MRI) is currently one of the most powerful medical diagnostic methods. While it benefits from being non-invasive and extremely versatile in terms of its applicability through harnessing structural, diffusion and flow differences, its lack of sensitivity has, until recently, severely limited its capabilities. This hurdle can be overcome by the use of hyperpolarisation methods, which transfer magnetisation to the nucleus of interest thereby dramatically increasing the detected response.Besides spin exchange optical pumping,1 which enables the diagnosis of pulmonary pathologies using hyperpolarised noble gases,2–4 the most advanced technique used in preclinical and clinical MRI investigations is Dynamic Nuclear Polarisation (DNP). In the case of DNP, the sample (containing a free radical and a 13C-labelled molecule in a glassing matrix) is cooled down to ∼1 K and electron based polarisation is transferred to the nucleus (typically 13C or 15N) by microwave irradiation.5para-Hydrogen Induced Polarisation (PHIP) is another hyperpolarisation method, which has become increasingly popular due to its efficiency and low cost.6 In PHIP signal enhancement is traditionally achieved by a catalysed hydrogenation reaction in which para-H2 (p-H2) is used instead of ortho-H2.7,8 Symmetry breakdown in the product leads to hyperpolarisation access which is not just limited to protons as hetero nuclei signals can also be substantially enhanced. A newer approach to polarisation transfer from p-H2, Signal Amplification by Reversible Exchange (SABRE9) allows the substrate to remain chemically unchanged and, instead, achieves magnetisation transfer through the scalar coupling framework of a metal complex. When the binding of both the ligand and H2 to this complex are reversible, SABRE allows for the repeated or continuous polarisation of the associated target molecule.10
DNP has proven to be capable of hyperpolarising a range of small, biocompatible molecules, such as pyruvate, bicarbonate or ascorbic acid and, in conjunction with localized MR spectroscopy methods, their detection has enabled the real time monitoring of metabolic processes, perfusion, inflammation, as well as the diagnosis and assessment of the response to treatment of various forms of cancer.11–16 In most cases this has been achieved indirectly through the analysis of localized magnetic resonance spectra of the hyperpolarised agent, the results of which are indicative of the spatial distribution of the molecule, as well as that of its metabolites.12,16–20 As many pathological processes, such as ischaemia, cancer or renal disease manifest themselves through changes in tissue pH, this can be reflected in MR spectra through changes in the relative amplitude and chemical shift of the peaks. The use of pH sensitive molecules, in conjunction with MRI and hyperpolarisation, therefore reflects a potentially excellent route to probe different metabolic pathways and aid in disease diagnosis.
This approach has successfully been applied to the study of a broad range of pathologies, using DNP as the magnetisation source12,21 and the fast development of pH sensitive agents for PHIP MRI shows that such a strategy can also be applied together with parahydrogen induced polarisation.22 SABRE hyperpolarisation of pH sensitive molecules has also been reported, with remarkable results being achieved using 15N-labelled compounds such as imidazole23 or diazirines24 as pH probes in conjunction with 15N SABRE hyperpolarisation. While no study of the effect of pH on SABRE hyperpolarised 1H NMR spectra has yet been published, Moreno and co-workers have observed that pH has a strong influence on the amplitude of solvent signals when the magnetisation transfer catalyst is present in solution.25 Furthermore, work by Tessari et al. on the quantification of the SABRE response26 has resulted in the production of a new tool for analysis which might be augmented by manipulating pH in the way described in this work to further to improve NMR sensitivity and detection.
We describe here the SABRE hyperpolarisation of vitamin B3 (nicotinic acid (NA)) and the effects pH plays on polarisation transfer to its 1H, 13C and 15N nuclei by probing appropriate NMR spectra in methanol-d4. We show that when NA is reacted with [IrCl(IMes)(COD)] (1) (where IMes = 1,3-bis(2,4,6-trimethylphenyl)imidazole-2-ylidene, and COD is cyclooctadiene) a SABRE active catalyst is successfully formed and we analyse its performance as a function of substrate loading and polarisation transfer field (PTF). Furthermore, we demonstrate that, by altering the pH of the solution, a new polarisation transfer catalyst is formed which has far superior performance to that of the parent. Moreover, the field dependence of the multiple spin terms created under SABRE, as well as the different relaxation and exchange rates that are found when moving from acidic to basic solution as a consequence of the change in catalyst speciation are themselves shown to be diagnostic.
We also demonstrate that the variation in the chemical shift of the NA resonances with pH is preserved under SABRE, not only for 1H, but also for 13C and 15N which shows that NA has significant potential as a pH probe. We undertake pKa assessments based on these changes and conclude by presenting 1H-MRI and 13C-MRI images of hyperpolarised NA in phantoms, which exhibit pH dependent intensity and contrast.
2. Experimental
2.1 Materials
All of the experimental procedures associated with this work were carried out under nitrogen using standard Schlenk techniques. The solvents used were dried using an Innovative Technology anhydrous solvent system, or distilled from an appropriate drying agent under nitrogen. The catalyst precursor [IrCl(IMes)(COD)] (1) employed in this work was synthesized by established procedures.27The SABRE experiments undertaken used a variety of concentrations of the substrate and catalyst that are detailed appropriately in the text. Deuterated methanol (methanol-d4) was purchased from Sigma Aldrich. Nicotinic acid (NA, Sigma Aldrich) and caesium carbonate (Cs2CO3) (Alfa Aesar) were used as supplied.
2.2 Instrumentation and procedures
All the NMR measurements were recorded on Bruker Avance III series 400 MHz or 500 MHz systems. NMR samples were prepared in 5 mm NMR tubes that were fitted with Young's valves. Samples were degassed prior to p-H2 (3 bars) addition. NMR characterization data was collected using a range of 1-D and 2-D methods that included nOe, COSY and HMQC procedures.28–322.3 SABRE analysis
NMR samples were prepared in 0.6 ml of methanol-d4. Arrays of NMR measurements were collected using either 20 equivalents of substrate (effective 17-fold excess relative to the catalyst) to 5 mM of iridium (1) or 20 equivalents of substrate and 20 equivalents of base to 5 mM iridium (1). After adding p-H2 at a 3 bar pressure, 1H NMR spectra were recorded using a π/2 excitation pulse immediately after sample introduction into the high-field magnet which was preceded by the shaking of the sample in a lower field, typically 65 G. Enhancement factors were calculated from the ratio of the integral areas of the individual resonances in the hyperpolarised spectrum and the spectrum collected under normal H2 where the signals arise from magnetisation that is created under Boltzmann equilibrium conditions. More detailed information about the sample preparation step, and the procedures used, can be found in Section 1 of the ESI.†2.4 Polarisation transfer field experiments
The dependence of SABRE with polarization transfer field (PTF) was examined by completing a series of measurements in an automated flow system that allows for repeated sample hyperpolarisation after exposure to p-H2 in the presence of a predefined low field as described by Mewis and coworkers.10 These samples contained 5 mM of 1, and varying amounts of NA, up to a 17-fold excess relative to iridium, and Cs2CO3, in 3 ml of methanol-d4. After activation, the samples were introduced into the flow system and simple pulse-collect, as well as multiple-quantum filtered NMR experiments33 were performed at PTFs that ranged from 0 to 140 G, in steps of 10 G. The effect of the Earth's magnetic field was screened by completing this process in a μ-metal shield.2.5 EXSY measurements and kinetic analysis
A series of exchange spectroscopy (EXSY) measurements were undertaken to probe the dynamic behaviour of these systems.32 This process involved the selective excitation of a bound resonance and the subsequent measurement of a 1H NMR spectrum at time, t, after the initial pulse. The resulting measurements consisted of a series of data arrays such that t takes between 10 and 25 values, typically between 0.1 to 1.0 s, to encode the reaction profile. The precise values were varied with temperature to match the speed of the process. Data were collected for a range of temperatures and sample concentrations. Integrals for the interchanging peaks in the associated 1H EXSY spectra were then converted into a percentage of the total detected signal and modelled as a function of t to extract the rate of change (see Section 1 of the ESI, Fig. S1 and S2†).3. Results and discussions
3.1. Zwitterionic forms of nicotinic acid as a function of solvent
Pyridine carboxylic acids have the capability to undergo multiple protonation events. This leads to the presence of several forms of this molecule in solution (see Scheme 1, neglecting the dication). It is generally assumed that uncharged NAB reflects a minor contribution with the dominant form being that of the neutral zwitterion NAC in aqueous media.34 In acidic solution the conjugate acid NAA predominates, whilst in basic environments the conjugate base NAD is essentially the only form present. These forms co-exist at intermediate acidities.34 | ||
| Scheme 1 Possible forms of NA in solution; (a) conjugate acid (NAA), (b) uncharged (NAB), (c) zwitterion (NAC) and (d) conjugate base (NAD). | ||
In the context of SABRE, when NA reacts with 1 to form an active polarisation transfer catalyst, it might therefore be expected to exist in one of several forms in solution. This translates into the potential for a highly complex speciation of the resulting magnetisation transfer catalyst, which might also be expected to be affected by the effective pKa of the carboxyl function of the bound ligand. The effect of this change is considered here in order to assess its impact on SABRE. Furthermore, given that the bound and free ligands of NA are undergoing exchange, the impact of this process on the observed chemical shifts of NA is also considered.
Samples containing 100 mM of NA were prepared in solutions of neat D2O and neat methanol-d4, as well as the D2O/methanol-d4 mixtures in the proportions 20–80, 40–60, 60–40 and 80–20. We use the well-established technique of pH dependent chemical-shift variations to look at this effect. The corresponding 1H NMR chemical shifts of NA are summarized in Table 1.
| 100% D2O | 80![[thin space (1/6-em)]](https://www.rsc.org/images/entities/char_2009.gif) : :![[thin space (1/6-em)]](https://www.rsc.org/images/entities/char_2009.gif) 20 D2O 20 D2O![[thin space (1/6-em)]](https://www.rsc.org/images/entities/char_2009.gif) : :![[thin space (1/6-em)]](https://www.rsc.org/images/entities/char_2009.gif) MeOD MeOD |
60![[thin space (1/6-em)]](https://www.rsc.org/images/entities/char_2009.gif) : :![[thin space (1/6-em)]](https://www.rsc.org/images/entities/char_2009.gif) 40 D2O 40 D2O![[thin space (1/6-em)]](https://www.rsc.org/images/entities/char_2009.gif) : :![[thin space (1/6-em)]](https://www.rsc.org/images/entities/char_2009.gif) MeOD MeOD |
40![[thin space (1/6-em)]](https://www.rsc.org/images/entities/char_2009.gif) : :![[thin space (1/6-em)]](https://www.rsc.org/images/entities/char_2009.gif) 60 D2O 60 D2O![[thin space (1/6-em)]](https://www.rsc.org/images/entities/char_2009.gif) : :![[thin space (1/6-em)]](https://www.rsc.org/images/entities/char_2009.gif) MeOD MeOD |
20![[thin space (1/6-em)]](https://www.rsc.org/images/entities/char_2009.gif) : :![[thin space (1/6-em)]](https://www.rsc.org/images/entities/char_2009.gif) 80 D2O 80 D2O![[thin space (1/6-em)]](https://www.rsc.org/images/entities/char_2009.gif) : :![[thin space (1/6-em)]](https://www.rsc.org/images/entities/char_2009.gif) MeOD MeOD |
100% MeOD | |
|---|---|---|---|---|---|---|
| H-2 | 9.13 | 9.14 | 9.14 | 9.13 | 9.13 | 9.14 |
| H-4 | 8.84 | 8.85 | 8.78 | 8.62 | 8.48 | 8.43 |
| H-5 | 8.09 | 8.07 | 7.96 | 7.80 | 7.66 | 7.58 |
| H-6 | 8.91 | 8.90 | 8.83 | 8.80 | 8.77 | 8.75 |
It can be seen from these data that as the amount of D2O decreases, in favour of methanol-d4, the resonances of NA, with the exception of H-2, exhibit an upfield shift. The size of this shift is just 0.03 ppm for H-6 but for H-4 and H-5 it increases to 0.05 and 0.06 ppm respectively. These small changes are therefore consistent with NAC still dominating in methanol-d4 solution. Interestingly there are far larger shifts in the mixtures where the hydrogen bonding network is clearly affected. We use the expression effective pKa throughout this work to reflect the fact that our measurements are done in methanol rather than water.
3.2. Reaction of NA with 1 in methanol-d4
It has previously been reported that when 1 reacts with pyridine (py) in methanol-d4 it forms [Ir(COD)(IMes)(py)]Cl.9 When NA reacts with 1 in methanol-d4 the solution rapidly changes colour from yellow to light orange due to the formation of analogous [Ir(COD)(IMes)(NAB)]Cl (2a) where the NA ligand binds through nitrogen in its neutral form. When the ratio of iridium to NA is 1![[thin space (1/6-em)]](https://www.rsc.org/images/entities/char_2009.gif) :
:![[thin space (1/6-em)]](https://www.rsc.org/images/entities/char_2009.gif) 7 NMR spectra at 245 K reveal that this reaction goes 96% to completion. These NMR data show sharp peaks for the bound, non-exchanging, NA resonances of 2a which has been characterised by 1H, 13C and 15N NMR spectroscopy and the results are detailed in the ESI† (Section 2.12.1). The 13C signal for the pyridyl quaternary carbon appears at δ 168 and indicates that the carboxyl group is protonated.
7 NMR spectra at 245 K reveal that this reaction goes 96% to completion. These NMR data show sharp peaks for the bound, non-exchanging, NA resonances of 2a which has been characterised by 1H, 13C and 15N NMR spectroscopy and the results are detailed in the ESI† (Section 2.12.1). The 13C signal for the pyridyl quaternary carbon appears at δ 168 and indicates that the carboxyl group is protonated.
3.3. Addition of H2 to [Ir(COD)(IMes)(NAB)]Cl (2a) in methanol-d4
A methanol-d4 solution of 2a, in which the NA ligand binds in its neutral form, was then exposed to a 3 bar pressure of hydrogen gas at 245 K. The ensuing reaction led to detection of two isomers of the H2 oxidative addition product [Ir(H)2(COD)(IMes)(NAB)]Cl. The dominant form of this product, 3a, yields two diagnostic hydride resonances at δ −11.91 and δ −17.32 (ESI,† Section 2.12.3). These hydride ligands lie trans to the N-heterocycle and COD respectively. This conclusion is supported by the corresponding 2D-1H COSY NMR spectrum, which contains a cross-peak between the hydride ligand signal at δ −17.32 and the bound H-2 and H-6 NAB resonances at 8.70 and 8.84 respectively, which are cis to the hydride. In this case, 3a forms because addition is favoured over the axis containing the weak nitrogen donor, rather than the strongly donating IMes ligand (Scheme 2).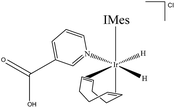 | ||
| Scheme 2 [Ir(H)2(COD)(IMes)(NAB)]Cl (3a), major product formed by H2 addition to 2a in methanol-d4 solution. | ||
3.4. Formation of [Ir(H)2(IMes)(NAB)3]Cl (4a) in methanol-d4 and its SABRE 1H NMR signal enhancement activity
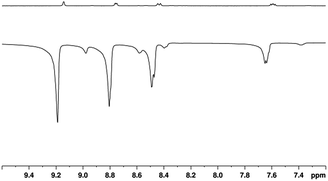
3a then reacts further with NA to form 4a which is directly analogous to the previously reported SABRE active complex, [Ir(H)2(IMes)(py)3]Cl.35 Characterisation data for 4a is presented in the ESI,† Section 2.12.5. When 4a is examined under p-H2, SABRE is observed in the corresponding high-field NMR spectra. This effect is readily evident when a sample containing 5 mM of 1 and 20 equivalents of NA (17-fold excess relative to 4a) is examined as detailed in Fig. 1.A series of one-shot 1H NMR spectra were then collected on this sample, using π/2 read-out pulses, and substantial signal enhancements were observed for all four of the non-exchangeable resonances of free NA, alongside those for its equatorially bound counterparts in 4a, and its hydride ligands.
The largest 1H NMR signal enhancement levels seen for the free substrate resonances with 4a were observed for H-2 (−52 fold), followed by H-6, H-4 and H-5 (−41, −31 and −21 fold respectively upon observation at 400 MHz). These enhancement levels are always smaller than those of the corresponding bound equatorial NAB signals of 4a. For example, in the case of H-2, this difference is reflected in a −92-fold signal gain rather than the −52-fold response. All of these values, and their errors, are presented in Table S1 of the ESI.†
In order to assess the effect that substrate loading has on these SABRE 1H NMR enhancements, samples containing 5 mM of 1 and increasing amounts of NA were prepared; the amount of substrate added ranging from 4 to 20 equivalents (up to 17-fold excess relative to 4).
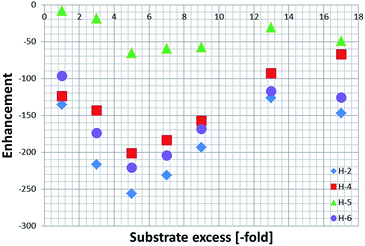
These enhancements were then quantified as detailed in the Experimental section and are summarised in Fig. 2. As expected, the largest signal enhancements are obtained for the ortho resonances (H-2 and H-6) of NA as they correspond to the proton which is located closest to the binding site in 4a.6
When analysing the effect of the substrate concentration in solution on the enhancement values, we observe a build-up towards the maximum value of −744 ± 35, which is obtained for a substrate loading of 40 mM (5-fold excess), followed by a decay as the ligand excess is further increased. This trend can be explained by analysing the influence of ligand concentration on the exchange rates as detailed shortly.
3.5. Bulk NA build-up rates for [Ir(H)2(COD)(IMes)(NAB)3]Cl (4a) as a function of substrate excess in methanol-d4
In order to rationalise the change in enhancement level with ligand loading, we quantified the free NA build-up rate in solution as function of substrate excess. The corresponding values were found to fall from 4.27 s−1 to 3.78 s−1 across this series (Fig. S4†). This small difference in rate was nonetheless larger than the errors in these values (ESI, Table S2†) and reflects a change in ligand exchange behaviour. The associated acid-base equilibria of NA must therefore be affected by this change in loading as the rate for a dissociative process is independent of ligand excess. For example, if more NA present in solution were to become protonated via the bound NAB contained within 4a then the new complexes Ir–N bond strength would increase and a reduction in the free NA build-up rate would be seen. This hypothesis can be verified by using NMR pH titration curves to determine the effective pKa values for the free and bound environments in this solvent.In the following sections we present a series of such pH studies that are used to examine the influence of pH on the form of the SABRE magnetisation transfer catalyst, as well as on the associated ligand build-up rates, enhancements and their dependence on the polarisation transfer field. We then link these studies to effective pKa determinations through the pH titration method.
3.6. Formation of [Ir(COD)(IMes)(NAD)]Cl (2b) in methanol-d4
When a methanol-d4 solution of 1 containing an excess of NA and Cs2CO3 is examined by NMR spectroscopy, the formation of [Ir(COD)(IMes)(NAD)]Cl (2b) rather than 2a is revealed. 2b was characterised by NMR spectroscopy (ESI,† Section 2.12). This reaction now goes to completion at 245 K, and the 13C chemical shift of the pyridyl quaternary carbon becomes δ 164 due to its binding as NAD. This change in speciation can also be replicated by adding Cs2CO3 to a pre-prepared solution of 2a.3.7. Addition of H2 to [Ir(COD)(IMes)(NAD)]Cl (2b) in methanol-d4 to form [Ir(H)2(IMes)(NAD)3]Cl (4b)
A methanol-d4 solution, where the preformed 2b to NA ratio was 1![[thin space (1/6-em)]](https://www.rsc.org/images/entities/char_2009.gif) :
:![[thin space (1/6-em)]](https://www.rsc.org/images/entities/char_2009.gif) 19, was prepared and then exposed to a 3 bar pressure of hydrogen at 245 K. The reaction of 2b with H2 led to the formation of [Ir(H)2(COD)(IMes)(NAD)]Cl (3b) which is directly analogous to 3a. This complex was identified by 1H NMR spectroscopy and yields two coupled, and diagnostic, hydride resonances, at δ −12.18 and δ −17.37 (ESI,† Section 2.12.4). Analogously to 3a, the 2D-1H COSY NMR spectrum exhibits a cross peak between the hydride resonance at δ −17.37, and the bound H-2 and H-6 NAD resonances at δ 8.53 and 8.85 respectively. A single hydride resonance, corresponding to 4b can be detected upfield, at δ −22.36 in this sample (ESI,† Section 2.12.6). The absence of any other hydride peaks indicates that NAD binds more effectively than NAB, and that our original hypothesis of a complex metal speciation is not seen in practice. This is confirmed by the trends in enhancement values described as a function of pH in Section 2.4.
19, was prepared and then exposed to a 3 bar pressure of hydrogen at 245 K. The reaction of 2b with H2 led to the formation of [Ir(H)2(COD)(IMes)(NAD)]Cl (3b) which is directly analogous to 3a. This complex was identified by 1H NMR spectroscopy and yields two coupled, and diagnostic, hydride resonances, at δ −12.18 and δ −17.37 (ESI,† Section 2.12.4). Analogously to 3a, the 2D-1H COSY NMR spectrum exhibits a cross peak between the hydride resonance at δ −17.37, and the bound H-2 and H-6 NAD resonances at δ 8.53 and 8.85 respectively. A single hydride resonance, corresponding to 4b can be detected upfield, at δ −22.36 in this sample (ESI,† Section 2.12.6). The absence of any other hydride peaks indicates that NAD binds more effectively than NAB, and that our original hypothesis of a complex metal speciation is not seen in practice. This is confirmed by the trends in enhancement values described as a function of pH in Section 2.4.
3.8. Rationalising the coordination of NA: effect of pH on the NMR titration curves of the free nicotinic acid in methanol-d4
In order to determine the effective pKa values for the free and bound resonances of NA more generally, and to study the effect of pH on the behaviour of nicotinic acid in terms of chemical shift and SABRE enhancement, a set of samples, containing 5 mM of 1, 100 mM of NA and increasing amounts of Cs2CO3, ranging from 0 to 100 mM, under 3 bars of H2 were prepared.This process allowed us to monitor the chemical shift variation (Δδ) for the free and bound resonances of NA over the pH range 3.6–12.5 (as measured by a standard pH electrode). These values are presented in Table S4 (see ESI†) and depicted in Fig. 3 for free NA. These data show that all of the free NA resonances move upfield with increasing pH, the smallest shift being exhibited by H-2 (Δδ = 0.06) and the largest by H-6 (Δδ = 0.18 ppm) in accordance with the likely increase in deshielding due to increased ring current in the anion. Protons H-4 and H-5 exhibit maximum chemical shift differences of 0.09 and 0.12 ppm respectively.
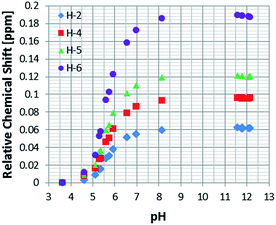 | ||
| Fig. 3 1H NMR titration curves measured using the indicated free NA resonances in the presence of 4 in methanol-d4. | ||
As a control, to see if these chemical shift changes were influenced by the presence of the catalyst in these methanol-d4 solutions, a series of analogous samples were prepared without catalyst (Fig. 4). All the free NA resonances again exhibit an upfield shift that is largest for the H-6 site. Upon passing pH 8, a plateau is reached and no further variation with added base is seen. It is possible to conclude that the values obtained for the relative chemical shifts of the free protons in the absence of catalyst are comparable to those seen with it. Hence, this behaviour can be analysed solely on the basis of the relative amounts of the different forms of NA illustrated in Scheme 1.
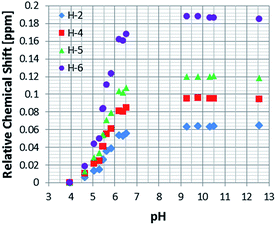 | ||
| Fig. 4 1H NMR titration curves measured for the resonances of NA in methanol-d4 solution without catalyst. | ||
The associated effective pKa values were then extracted via a Henderson–Hasselbach analysis36,37 using the equation:
Data analysis reveals that the effective pKa values determined for NAC in methanol-d4 in the presence of 4 are 7.06, 6.67, 6.75 and 6.75 for H-2, H-4, H-5 and H-6 respectively. They should all be the same and an error of 0.2 pH units is therefore estimated. A graphical representation of the Henderson–Hasselbach curves for each proton is presented in the ESI (Fig. S10–S12†).
3.9. Effect of pH on the NMR titration curves of the bound nicotinic acid resonances in methanol-d4 in 4
NMR titration curves were also completed for the equatorially and axially bound resonances of NA in 4. Data analysis shows a significant change in the behaviour of the H-2 resonance which consistently shifts down-field with increase in pH, exhibiting maximum Δδ values of −0.11 and −0.43 for the equatorial and axial site respectively (Fig. 5). The corresponding Δδ values for H-4 are 0.55 and 0.15 ppm, while for H-6 they are 0.20 and 0.12 respectively. These changes compare to those seen for free NA of 0.06, 0.18, 0.09 and 0.12 H-2, H-6, H-4 and H-5 respectively.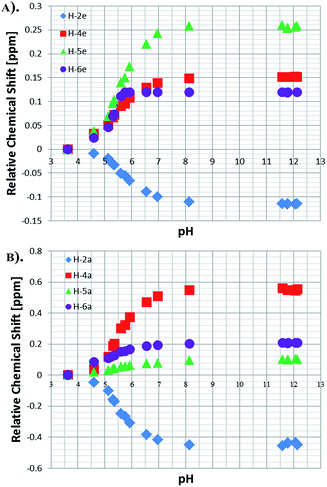 | ||
| Fig. 5 Relative chemical shifts for the bound NA resonances of 4: (a) equatorial protons and (b) axial protons in methanol-d4. | ||
The effective pKa values for bound NA in the axial and equatorial sites were estimated in a similar way to that already described for free NA. For the axial position, the effective pKa values derived from H-2 and H-4 are 6.05 and 6.20 respectively, and contrast with those determined from H-5 and H-6 for which the values are 3.78 and 3.53 respectively. The values obtained from the equatorial NA protons were 5.58, 4.57, 5.05 and 6.07 for H-2, H-4, H-5 and H-6 respectively, and are all lower than those of free NA. This confirms our previous hypothesis that the reduction in build-up rates seen with high ligand loadings is due to the acidity of the bound NA ligands which causes the free NA to act as a base. The reason for the high variability in effective pKa value is clearly associated with the strength and type of metal bonding interaction in addition to the effect that is introduced by NA interacting in either the neutral of conjugate base forms. The absolute chemical shift values determined here therefore reflect a combination of both shielding and ring current effects which are modified through inductive and mesomeric changes.
The larger chemical shift changes are observed in the axial plane where the NA is trans to the carbene which is a good σ donor and π acceptor. In contrast, the two ligands in the equatorial position are both trans to the hydride, which is purely a σ donor and strong trans-labializing ligand, the latter change lengthening the Ir–NA bond and accounting for its lability.
Another way of probing the strengths of the substrate's interaction with the metal centre is by examining the difference between the free and bound 15N chemical shifts of NA.38 At pH 3.6 these correspond to Δδax and Δδeq values of 60.1 and 42.9 ppm for the axial and equatorial sites respectively. In contrast, the corresponding values at pH 12.5 are 61.0 and 44.1 ppm. This change confirms that formation of the expected carbanion in alkaline solution leads to stronger Ir–N bonding. The ligand build-up rates probe this effect directly, falling with added base as the Ir–N bond increases in strength (see following section and Table S6, Section 2.6 of the ESI†). Furthermore, the 13C chemical shifts of the bound NA's aromatic CH resonances also move with pH by 1–2 ppm units to higher field on forming the anion (as detailed in Section 2.12.5 and 2.12.6 of the ESI†). These data therefore confirm the proposed change in formulation of 4a and 4b with pH.
3.10. Effect of pH on the free-ligand build-up rate and activation parameters of [Ir(H)2(IMes)(NAB)3]Cl (4a) and [Ir(H)2(IMes)(NAD)3]Cl (4b) in methanol-d4
The rates of ligand transfer from the key equatorial site into solution have been measured for 4a and 4b as a function of temperature. These results are presented in detail in Table S6 (see ESI†). The associated rate constant for 4a proved to be 6.98 ± 0.07 s−1 at 300 K whilst for 4b it was 3.33 ± 0.01 s−1 at the same temperature. The corresponding activation parameters for these free NA build-up rates in solution are presented in Table 2. These data suggest that the binding energy of NA in both 4a and 4b is actually lower than that of pyridine in the analogous complex [Ir(H)2(IMes)(pyridine)3]Cl, for which the site trans to hydride has a ΔH≠(build-up) value of 95 ± 1 kJ mol−1.35| Activation parameters | 4a | 4b |
|---|---|---|
| ΔH≠ (kJ mol−1) | 88 | 88 |
| ± | 2 | 3 |
| ΔS≠ (J K−1 mol−1) | 70 | 64 |
| ± | 8 | 12 |
| ΔG≠300 (kJ mol−1) | 66.9 | 69.4 |
| ± | 0.4 | 0.3 |
| R square | 0.998 | 0.998 |
Given that the average pKa of pyridine is 5.17 and that of NA is reported to be 5.00,34 we attribute the lower build-up rates to steric effects that act to lengthen the NA bond in the ground state and thereby reduce the subsequent entropy gain of ligand loss and the associated solvation changes.39 This effect is felt most strongly for highly solvated 4b. Analogous ligand build-up rates were also measured for samples containing 5 mM of 4b, prepared with increasing amounts of NA and Cs2CO3 in equal proportion (Fig. S15, Section 2.5 of the ESI†). The corresponding rates increase from 0.93 ± 0.01 s−1 (obtained for the sample prepared with 1-fold excess of substrate and 1-fold excess of base respectively) to 1.78 ± 0.11 s−1 (17-fold excess of substrate and 17-fold excess of base) as the expected plateau is reached for this dissociative process. The rate of free-NA build-up is therefore 1.78 ± 0.11 and smaller than that in an analogous sample without base (4.27 s−1). This situation reflects the greater stability of the complex when NA binds as the anion NAD. The initial under assessment of the exchange rate results from the fact that the EXSY method misses an exchange event if a molecule of the originally excited NAbound returns to the complex rather than remaining in bulk solution. As the substrate excess increases, the chance of this degenerative process happening reduces.
3.11. pH influence on proton relaxation times in methanol-d4
In order to assess the effect pH manipulation has on the signal lifetimes of the ligand, we have also examined the effect of pH on the relaxation times of the free NA protons at pH 3.6 and pH 12.5.The corresponding T1 values are listed in Table 3. It can be seen that the isolated proton, H-2, has the longest T1, with a value of 18.4 s in degassed solution. At pH 12.5, this T1 value changes to 23.7 s, with the corresponding increase suggesting that the tautomer with a protonated nitrogen plays a role in relaxation at low pH. The presence of 4a in solution reduces the effective T1 of H-2 to 10.3 seconds in accordance with its role in SABRE, and the increase to 17.6 at high pH reflects the loss of contribution from the pyridinium tautomer and slower catalyst exchange.
| H-2 | H-4 | H-5 | H-6 | |
|---|---|---|---|---|
| NA | 18.4 | 9.6 | 6.5 | 11.3 |
| NA with Cs2CO3 | 23.7 | 6.5 | 5.2 | 8.7 |
| NA and 4a | 10.3 | 8.3 | 4.9 | 7.3 |
| NA and 4b | 17.6 | 7.2 | 4.2 | 6.0 |
In addition to these changes, the H-4, H-5 and H-6 sites T1 values fall by 32, 20 and 23% respectively in the presence of Cs2CO3 alone. In the presence of the activated complex, at pH 3.6, these values differ from their reference point by 14, 25 and 35% respectively, and they fall further by 25, 35 and 47% at pH 12.5. These observations demonstrate therefore that the most pH sensitive resonances are also the most sensitive to relaxation, while confirming that the catalyst changes the relaxation rates of free NA under exchange.
3.12. pH influence on SABRE enhancements by 4 in methanol-d4
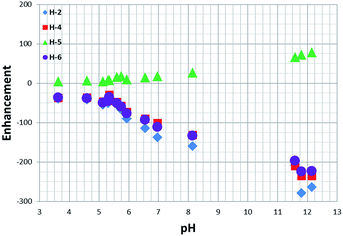
When a sample of 1 in the presence of 20 equivalents of NA is probed for SABRE at 298 K and a pH of 3.6 (after transfer at 45 G) its four protons exhibit a total Zeeman type (Iz) signal enhancement of 110.However, upon moving from pH 3.6 to pH 8 the observed signal enhancement increases to ca. 400 via a sigmoidal variation in signal gain with pH in a similar way to that described for the chemical shift profiles (Fig. 6).
When the pH is increased to 12, the total NA signal enhancement increases to over 800-fold. This change is likely to result from the formation of methoxide through an iridium promoted reaction with caesium carbonate and there is therefore the potential to change the active catalyst again. It should be noted that the linewidth of the H-2 resonance for free NA narrows as the pH changes from 3 to 12 in accordance with the observed increase in T1 value and reduction in contribution from NAC with a protonated nitrogen.
3.13. Probing the effect of the polarisation transfer field on the efficiency of SABRE for transfer to 1H, 13C and 15N in methanol-d4
As mentioned previously in the introduction, the value of the polarisation transfer field (PTF) can affect the levels of SABRE enhancement that result.6 We therefore explored this behaviour through a series of single shot measurement with 4a and 4b respectively and describe these results in Sections 2.7–2.11 of the ESI.†4a and 4b proved to behave in a similar fashion, with the maximum 1H NMR enhancement level being obtained at around 70 G for H-2 in each case. The enhancement ratios delivered by 4b/4a at 70 G are 5.3, 4.5, 1.9 and 5.5 for H-2, H-4, H-5 and H-6 respectively, and confirm the superior detection levels in basic solution. Similar signal gains have been detected when performing multiple quantum filtered experiments using the only parahydrogen spectroscopy33 (OPSY) protocol (see ESI, Section 2.7, Fig. S17–S20†). This gradient-based selection procedure probes the magnetization that is created through SABRE via the creation of appropriate zero quantum, single quantum, double quantum, triple quantum and quadruple quantum terms. In this case, the observations confirm that whilst the creation of single spin polarization is most efficient, two, three and four-spin longitudinal spin-order is created and readily detectable.Additionally, the corresponding 15N SABRE response of 4 was detectable without labelling, and the addition of base found to significantly improve it such that 4b is readily detectable after transfer via a PTF of 0.2 G (see ESI,† Section 2.10).
The absolute enhancement for the 1H decoupled 15N resonance of 4b, calculated via a 15N labelled pyridine standard, was 9218-fold. In the corresponding 13C spectrum, no enhancement could be detected when analysing transfer via4a, but the addition of base facilitates the detection of all of the NA ring 13C resonances via4b. These results are described in the ESI† (Sections 2.8 and 2.9) and serve to further illustrate the effect of pH manipulation on the hyperpolarised NMR signal intensity.
3.14. pH influence on solvent polarisation
Several reports of methanol participating in the active polarisation transfer catalyst can be found in the literature35,40 and, as observed by Moreno and co-workers, enhancement of the OH proton can be easily attained in mild acidic conditions.25 The residual OH resonance of this solvent is considerably enhanced in the presence of 4a and its enhancement is shown to decrease with increasing substrate amount from a maximum of approximately 100-fold for up to a 7-fold excess of NA to 68-fold for a 17-fold excess of NA (ESI, Section 2.11 and Fig. S29†). This fall matches the findings of Lloyd,35 Moreno,25 and Eshuis26 and the observation of these effects serves to further illustrate that alcohols can be polarised by SABRE.3.15. pH influence on the quality of 1H and 13C derived images
The pH sensitivity of NA in the presence of 4a or 4b was tested by performing Magnetic Resonance Spectroscopy experiments (MRS) which consisted of acquiring localised spectra of the hyperpolarised agent dissolved in acidic or basic solutions in a voxel of 3 × 3 × 10 mm localised in the centre of the glass phantom used for the experiments, an approach that is analogous to state-of-the-art DNP experiments.12 These preliminary results, presented in Section 3.1 of the ESI (Fig. S35†), show that the pH sensitivity of NA can be exploited both during the polarisation transfer step (to increase sensitivity by enhancing intensity) and during the detection step (due to its inherent qualities as a pH probe).Furthermore, we have recorded a series of SABRE images on samples containing 5 mM of 1, 20 equivalents of NA (17-fold excess, relative to 4) and increasing amounts of base (up to 17-fold excess base). As expected, as the amount of Cs2CO3 increases, the pH of solution increases and the signal intensity seen in the response increases by one order of magnitude for the same concentration of substrate (Fig. 7).
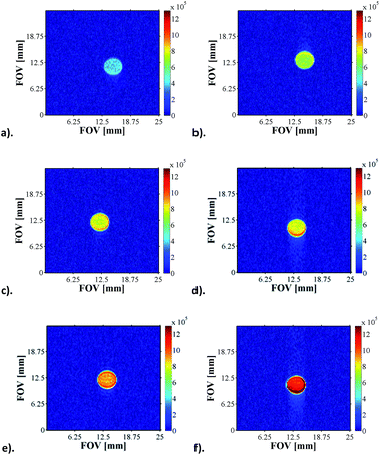 | ||
| Fig. 7 1H MRI images of hyperpolarised NA as a function of pH: (a) pH 3.6, (b) pH 4.6, (c) pH 5.1, (d) pH 5.7, (e) pH 5.9 and (f) pH 6.9. | ||
In order to more precisely quantify this improvement in terms of the image quality, five one-shot images of the hyperpolarised samples were acquired and the average image signal to noise ratios (SNR's) were calculated. The SNR values exhibit an increasing trend up to the point where the pH approaches physiological values, which opens up the possibility of using NA, a naturally biocompatible molecule, as an MRI contrast agent for in vivo investigations (Fig. 8). As the basicity of the solution is further increased, the corresponding SNR values decrease rapidly, a trend which we attribute to possible transverse relaxation rate effects caused by the methoxide ion.
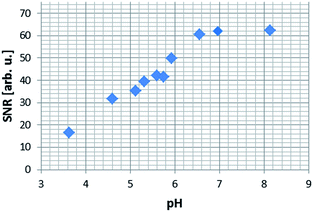 | ||
| Fig. 8 Average signal to noise (SNR) ratio produced in a series of 1H MRI images of hyperpolarised NA in methanol-d4 solution. | ||
13C MRI As 13C imaging can be used to successfully analyse metabolic processes, as demonstrated by DNP,14 we also examined carbonyl-13C labelled NA with 4a and 4b derived samples (see ESI†). The samples contained a 17-fold excess 13C-NA relative to 4, and were first hyperpolarised using the automated system described earlier at 0 G prior to the recording of the corresponding 13C image using a rapid acquisition scheme. While the images acquired for 4a did not yield signals above the background noise level, the addition of base, and use of 4b, facilitated the successful recording of an image (Fig. 9).
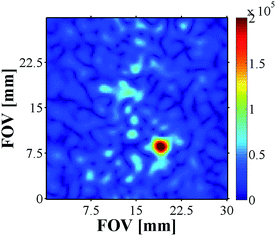 | ||
| Fig. 9 13C image of hyperpolarised 13C-NA produced by 4b. Matrix size 64 × 64, slice thickness 10 mm, nominal resolution 470 μm2. | ||
Conclusions
We have established here that nicotinic acid (NA) reacts with [IrCl(IMes)(COD)] (1) and H2 to successfully form a SABRE active catalyst. In acid solution, the carboxyl function of NA is protonated when bound to iridium and relatively weak SABRE is observed in the corresponding free NA1H NMR signals. In contrast, when Cs2CO3 is added, to make the resulting solution basic, NA binds as its conjugate base with the resulting charge delocalisation acting to stabilise the catalyst. In this case the catalysts longer lifetime leads to dramatically improved SABRE activity.When analysing the performance of the SABRE catalyst as a function of substrate loading and polarisation transfer field, we have found that the maximum enhancement is obtained using 5-fold excess of ligand at 65 G. In a 1H NMR spectrum recorded at 400 MHz the resulting 744-fold signal gain reflects a compression of the total data acquisition time required under normal conditions for an equivalent SNR of over 500![[thin space (1/6-em)]](https://www.rsc.org/images/entities/char_2009.gif) 000. We note, however, that it is easier to work at 45 G where all of the signals possess a balanced phase.
000. We note, however, that it is easier to work at 45 G where all of the signals possess a balanced phase.
A subsequent increase in ligand loading leads to a decrease in enhancement, a phenomenon which we attribute to a change in the NA acid–base equilibrium position in methanol solution. We verified this hypothesis by using NMR pH titration mapping, in which a series of measurements were undertaken where increasing amounts of base were added to a constant amount of NA, H2 and 1.
By doing so, the pH of the solution changes such that progressive deprotonation of the nitrogen and oxygen centres of NA occurs, this leads to a higher probability that NA can bind to the catalyst. This change in catalyst formulation has been viewed by mapping the effect on the ligands 1H NMR chemical shifts as a function of pH. A series of well-defined pH titration curves were produced from which effective pKa values can be estimated for methanol-d4 solution. The hyperpolarised signals for free NA were also used to access its pKa under the same conditions. Hence these results reflect an important observation that hyperpolarised 1H NMR signals can be used for pH assessment in conjunction with SABRE.
When examining the ligand build-up rates for two extreme pH situations (the catalyst in the absence of base and the catalyst formed with an excess of base), we confirmed that the increase in pH slows down the process of ligand build-up in solution. The lower ligand build-up rates, together with significant changes in the relaxation times, lead to the far superior performance of the polarisation transfer catalyst with excess of base, compared to that of its protonated parent. This effect is readily demonstrated in the enhancement vs. pH data of Fig. 6, which shows a considerable increase in polarisation at high pH, as well as in the multiple-quantum experiments that were performed at different PTF values and are described in the ESI.† These data therefore illustrate how the detection limit can be improved by harnessing pH if an analytical study is being completed. By extending this approach through the OPSY protocol, such measurements could be made in protio solvents without the need for solvent suppression. We note that in acid solution, the residual protons of the methanol-d4 solvent also show substantial polarisation (see ESI† Section 2.11).
Furthermore, the increase in pH has allowed for natural abundance 13C and 15N spectra to be acquired and, as in the case of 1H, larger enhancements were obtained for the basic solution in comparison to its acidic parent. We present 1H MRI and 13C MRI images of SABRE hyperpolarised NA in phantoms that exhibit controlled pH dependent intensity and contrast. In the ESI† we demonstrate that Magnetic Resonance Spectroscopy (MRS) can be used on these phantoms to track the pH change in a voxel of interest. These results are, to the best of our knowledge, the first pH-dependent 1H MRI data obtained using SABRE.
This study therefore establishes that when the pH sensitivity of NA is combined with the increase in signal gain provided for by SABRE hyperpolarisation, a versatile pH MRI probe will result which is directly analogous to that already demonstrated in vivo for DNP-MRI. It also reveals the importance of considering the effect pH plays on catalysis during SABRE.
Acknowledgements
We would like to thank Ryan E. Mewis and Peter J. Rayner for useful discussions. We are grateful for funding from the Wellcome Trust (grant 92506 and 098335).Notes and references
- W. Happer, E. Miron, S. Schaefer, D. Schreiber, W. A. van Wijngaarden and X. Zeng, Phys. Rev. A: At., Mol., Opt. Phys., 1984, 29, 3092–3110 CrossRef CAS.
- S. B. Fain, F. R. Korosec, J. H. Holmes, R. O'Halloran, R. L. Sorkness and T. M. Grist, J. Magn. Reson. Imaging, 2007, 25, 910–923 CrossRef PubMed.
- B. Driehuys, G. P. Cofer, J. Pollaro, J. B. Mackel, L. W. Hedlund and G. A. Johnson, Proc. Natl. Acad. Sci. U. S. A., 2006, 103, 18278–18283 CrossRef PubMed.
- M. S. Albert, G. D. Cates, B. Driehuys, W. Happer, B. Saam, C. S. Springer and A. Wishnia, Nature, 1994, 370, 199–201 CrossRef CAS PubMed.
- J. H. Ardenkjær-Larsen, B. Fridlund, A. Gram, G. Hansson, L. Hansson, M. H. Lerche, R. Servin, M. Thaning and K. Golman, Proc. Natl. Acad. Sci. U. S. A., 2003, 100, 10158–10163 CrossRef PubMed.
- R. A. Green, R. W. Adams, S. B. Duckett, R. E. Mewis, D. C. Williamson and G. G. R. Green, Prog. Nucl. Magn. Reson. Spectrosc., 2012, 67, 1–48 CrossRef CAS PubMed.
- C. R. Bowers and D. P. Weitekamp, Phys. Rev. Lett., 1986, 57, 2645–2648 CrossRef CAS PubMed.
- C. R. Bowers and D. P. Weitekamp, J. Am. Chem. Soc., 1987, 109, 5541–5542 CrossRef CAS.
- R. W. Adams, J. A. Aguilar, K. D. Atkinson, M. J. Cowley, P. I. P. Elliott, S. B. Duckett, G. G. R. Green, I. G. Khazal, J. López-Serrano and D. C. Williamson, Science, 2009, 323, 1708–1711 CrossRef CAS PubMed.
- R. E. Mewis, K. D. Atkinson, M. J. Cowley, S. B. Duckett, G. G. R. Green, R. A. Green, L. A. R. Highton, D. Kilgour, L. S. Lloyd, J. A. B. Lohman and D. C. Williamson, Magn. Reson. Chem., 2014, 52, 358–369 CrossRef CAS PubMed.
- S. E. Day, M. I. Kettunen, F. A. Gallagher, D.-E. Hu, M. Lerche, J. Wolber, K. Golman, J. H. Ardenkjaer-Larsen and K. M. Brindle, Nat. Med., 2007, 13, 1382–1387 CrossRef CAS PubMed.
- F. A. Gallagher, M. I. Kettunen, S. E. Day, D.-E. Hu, J. H. Ardenkjaer-Larsen, R. i. t. Zandt, P. R. Jensen, M. Karlsson, K. Golman, M. H. Lerche and K. M. Brindle, Nature, 2008, 453, 940–943 CrossRef CAS PubMed.
- S. E. Bohndiek, M. I. Kettunen, D.-e. Hu, B. W. C. Kennedy, J. Boren, F. A. Gallagher and K. M. Brindle, J. Am. Chem. Soc., 2011, 133, 11795–11801 CrossRef CAS PubMed.
- P. Bhattacharya, E. Y. Chekmenev, W. H. Perman, K. C. Harris, A. P. Lin, V. A. Norton, C. T. Tan, B. D. Ross and D. P. Weitekamp, J. Magn. Reson., 2007, 186, 150–155 CrossRef CAS PubMed.
- E. Y. Chekmenev, J. Hövener, V. A. Norton, K. Harris, L. S. Batchelder, P. Bhattacharya, B. D. Ross and D. P. Weitekamp, J. Am. Chem. Soc., 2008, 130, 4212–4213 CrossRef CAS PubMed.
- K. Golman, O. Axelsson, H. Jóhannesson, S. Månsson, C. Olofsson and J. S. Petersson, Magn. Reson. Med., 2001, 46, 1–5 CrossRef CAS PubMed.
- K. Golman, J. H. Ardenkjær-Larsen, J. S. Petersson, S. Månsson and I. Leunbach, Proc. Natl. Acad. Sci. U. S. A., 2003, 100, 10435–10439 CrossRef CAS PubMed.
- K. Golman and J. S. Petersson, Acad. Radiol., 2006, 13, 932–942 CrossRef PubMed.
- K. Golman, R. t Zandt and M. Thaning, Proc. Natl. Acad. Sci. U. S. A., 2006, 103, 11270–11275 CrossRef CAS PubMed.
- K. Golman, R. I. Zandt, M. Lerche, R. Pehrson and J. H. Ardenkjaer-Larsen, Cancer Res., 2006, 66, 10855–10860 CrossRef CAS PubMed.
- D. E. Korenchan, R. R. Flavell, C. Baligand, R. Sriram, K. Neumann, S. Sukumar, H. VanBrocklin, D. B. Vigneron, D. M. Wilson and J. Kurhanewicz, Chem. Commun., 2016, 52, 3030–3033 RSC.
- F. Reineri, T. Boi and S. Aime, Nat. Commun., 2015, 6, 5858 CrossRef CAS PubMed.
- R. V. Shchepin, D. A. Barskiy, A. M. Coffey, T. Theis, F. Shi, W. S. Warren, B. M. Goodson and E. Y. Chekmenev, ACS Sens., 2016, 1, 640–644 CrossRef CAS PubMed.
- T. Theis, G. X. Ortiz, A. W. J. Logan, K. E. Claytor, Y. Feng, W. P. Huhn, V. Blum, S. J. Malcolmson, E. Y. Chekmenev, Q. Wang and W. S. Warren, Sci. Adv., 2016, 2, e1501438 Search PubMed.
- K. X. Moreno, K. Nasr, M. Milne, A. D. Sherry and W. J. Goux, J. Magn. Reson., 2015, 257, 15–23 CrossRef CAS PubMed.
- N. Eshuis, N. Hermkens, B. J. A. van Weerdenburg, M. C. Feiters, F. P. J. T. Rutjes, S. S. Wijmenga and M. Tessari, J. Am. Chem. Soc., 2014, 136, 2695–2698 CrossRef CAS PubMed.
- O. Torres, M. Martín and E. Sola, Organometallics, 2009, 28, 863–870 CrossRef CAS.
- K. Stott, J. Stonehouse, J. Keeler, T.-L. Hwang and A. J. Shaka, J. Am. Chem. Soc., 1995, 117, 4199–4200 CrossRef CAS.
- A. A. Shaw, C. Salaun, J.-F. Dauphin and B. Ancian, J. Magn. Reson., Ser. A, 1996, 120, 110–115 CrossRef CAS.
- B. Ancian, I. Bourgeois, J.-F. Dauphin and A. A. Shaw, J. Magn. Reson., 1997, 125, 348–354 CrossRef CAS.
- H. Kessler, H. Oschkinat, C. Griesinger and W. Bermel, J. Magn. Reson., 1986, 70, 106–133 CAS.
- N. G. Vassilev and V. S. Dimitrov, Magn. Reson. Chem., 2001, 39, 607–614 CrossRef CAS.
- J. A. Aguilar, P. I. P. Elliott, J. Lopez-Serrano, R. W. Adams and S. B. Duckett, Chem. Commun., 2007, 1183–1185 RSC.
- B. García, S. Ibeas and J. M. Leal, J. Phys. Org. Chem., 1996, 9, 593–597 CrossRef.
- L. S. Lloyd, A. Asghar, M. J. Burns, A. Charlton, S. Coombes, M. J. Cowley, G. J. Dear, S. B. Duckett, G. R. Genov, G. G. R. Green, L. A. R. Highton, A. J. J. Hooper, M. Khan, I. G. Khazal, R. J. Lewis, R. E. Mewis, A. D. Roberts and A. J. Ruddlesden, Catal. Sci. Technol., 2014, 4, 3544–3554 CAS.
- J. Henderson, Am. J. Phys., 1908, 21, 173–179 Search PubMed.
- K. A. Hasselbach, Biochem. Z., 1916, 78, 112–144 Search PubMed.
- L. Pazderski, Magn. Reson. Chem., 2008, 46, S3–S15 CrossRef PubMed.
- A. M. Olaru, S. S. Roy, L. S. Lloyd, S. Coombes, G. G. R. Green and S. B. Duckett, Chem. Commun., 2016, 52, 7842–7845 RSC.
- M. Fekete, O. Bayfield, S. B. Duckett, S. Hart, R. E. Mewis, N. Pridmore, P. J. Rayner and A. Whitwood, Inorg. Chem., 2013, 52, 13453–13461 CrossRef CAS PubMed.
Footnote |
| † Electronic supplementary information (ESI) available. See DOI: 10.1039/c6sc04043h |
| This journal is © The Royal Society of Chemistry 2017 |

