Surfactant-assisted synthesis of porous TiO2 nanofibers as an anode material for secondary lithium ion batteries
Deepa
T.D
,
Subhalaxmi
Mohapatra
,
Shantikumar V.
Nair
,
A. Sreekumaran
Nair
and
Alok Kumar
Rai
*
Amrita Centre for Nanosciences and Molecular Medicine, Amrita Vishwa Vidyapeetham, Amrita University, Kochi 682041, Kerala, India. E-mail: alokkumarrai1@gmail.com; alokkumar21223@aims.amrita.edu; Fax: +91-4842-802020; Tel: +91-4842-858750
First published on 9th January 2017
Abstract
An optimized amount of cetyltrimethylammonium bromide (CTAB) as a surfactant was used for the first time to fabricate porous TiO2 nanofibers by an electrospinning technique combined with post-annealing at 500 °C for 5 h in air medium. The fabricated porous TiO2 nanofibers were systematically characterized by powder X-ray diffraction, scanning electron microscopy, transmission electron microscopy, surface area measurements and electrochemical testing. The porous TiO2 nanofibers contained numerous surface pores with an average diameter of ∼80–90 nm. As an anode, the porous TiO2 nanofiber electrode delivered not only a high reversible capacity and excellent cycle stability over 100 cycles but also excellent rate capability at various current rates in comparison to control TiO2 nanofibers (prepared in the absence of CTAB). The rapid transportation of lithium ions and reduced lithium ion diffusion length probably are responsible for the improved electrochemical performances of the porous TiO2 nanofiber electrode synthesized in the presence of the CTAB surfactant.
1. Introduction
Titanium dioxide (TiO2) is a widely investigated functional material used for fundamental research and technological applications in various fields of semiconductors, optical devices, photovoltaic cells, catalysis, gas sensing and electrochemical energy storage.1–3 Much attention has been paid to nanostructured TiO2 for Li ion insertion because it has unique properties such as high power densities, excellent reversibility, thermodynamic stability, low safety risks, low-cost, non-toxicity and natural abundance. The reversible Li+ ion insertion/extraction into TiO2 can be described by the reaction: TiO2 + xLi+ + xe− ⇌ LixTiO2 with a maximum theoretical capacity of 335 mA h g−1.4 The lithium insertion coefficient x (LixTiO2) may depend on the crystallography and microstructure of the particular materials. The most active form of TiO2 for Li+ insertion and extraction is anatase, where the reversible insertion coefficient x is up to 0.5 mol Li per mol TiO2 with a relatively high voltage potential (∼1.7 V) vs. Li/Li+.4 Despite these advantages, the low electronic conductivity and less lithium ion diffusivity within the lattice restrict the application of anatase TiO2 as a high-power anode material.4,5 However, it is reported that the development of nanostructured TiO2 with a large surface area, tunable pore size and high porosity provides the key to solve the above issues of anatase TiO2 due to the reduced path lengths for both electron and Li+ transport and improved diffusion kinetics of Li+ ions.6–8 In addition, it was also found that the applications of TiO2 are directly linked to its crystal phase, morphology and surface properties.9 Hence, it is desirable to have a suitable synthesis technique to control the above structural parameters to enhance the electrochemical activity of anatase-phase nanostructures.7Recently, a variety of TiO2 nanostructured materials such as nanoparticles, nanofibers, nanowires, nanorods, nanotubes, nanoflowers, nanofiber–nanoparticle composites and nanospheres have been prepared and used as anode materials for lithium ion batteries.8–17 Notably, the 1-D nanofibers as the anode showed promising results for lithium ion batteries due to their salient features such as a high surface-to-volume ratio, facile Li+ diffusion and good compatibility with current collectors, as well as accommodating volume changes without cracking during Li+ intercalation/de-intercalation. However, the practical applications of 1-D TiO2 nanostructures are still hampered in Li ion batteries due to their low electronic conductivity (∼10–12 S cm−1).18 Therefore, various attempts have been made to improve the electronic conductivity of 1-D TiO2 nanostructures such as decoration of conductive metal nanoparticles on nanofibers, carbon coatings, nanocomposites with CNTs and graphenes, etc.8,19,20 In addition, there is also one more effective strategy to circumvent the above limitations and improve the electrochemical performances which is to fabricate porous 1-D TiO2 nanostructures with a large surface area and plenty of surface pores through which Li+ ions can easily get transported to the active regions of the material. However, it was found that there are still many challenges to synthesize 1-D porous TiO2 nanostructures with a continuous and uniform electron transport path to enhance the Li+ ion kinetics for high performance lithium ion battery anodes.
Electrospinning has been widely used as a convenient method to produce continuous 1-D nanofibers from solution with diameters ranging from tens to hundreds of nanometers.8 In this paper, we describe an innovative means to fabricate 1-D TiO2 nanofibers with a large surface area and high porosity via an electrospinning technique with the use of an optimized amount of the CTAB surfactant in the electrospinning solution. The obtained as-spun fibers when sintered at 500 °C in air result in complete degradation of CTAB and polymers resulting in the creation of pores, which can dramatically increase the capacity. The obtained porous TiO2 nanofibers as an anode exhibited excellent cycling stability and rate capability compared to the electrode made of control TiO2 nanofibers (synthesized without the use of CTAB). The enhanced electrochemical performance can be attributed to the porous nature of TiO2 nanofibers, which provide abundant channels for lithium ion transport as well as accommodating volume variation.
2. Experimental
2.1. Synthesis of nanofibers
Titanium(IV) isopropoxide (Ti [OCH(CH3)2]4, 99.99%), acetic acid (CH3COOH, >99.99%), methanol (CH3OH, 99.9%) and polyvinyl pyrrolidone (PVP) were purchased from Sigma-Aldrich and used without further purification. In a typical synthesis, 0.5 g of PVP was dissolved in 7.0 mL of methanol under continuous magnetic stirring. Then, 2.0 mL of acetic acid and 1.0 mL of titanium isopropoxide (TIP) were added, respectively, to the above solution under stirring. The solution was kept under stirring for 2 h until it became homogenous with a pale yellow color. Subsequently, an optimized amount of 0.75 g of cetyltrimethylammonium bromide (CTAB, 98% Spectrochem), as a surfactant, was added to the above solution to create pores in the fibers. After stirring for another 1.0 h, the solution was transferred to a 20 mL syringe for electrospinning. Electrospinning was performed in a humidity-controlled electrospinning set-up (IME Technologies, The Netherlands) wherein the electrospinning conditions such as the tip-to-collector distance, applied voltage and the flow rate were 18 cm, 29 kV and 0.5 mL h−1, respectively. The electrospun fibermat was peeled-off from the collector and annealed at 500 °C for 5 h to obtain porous anatase TiO2 nanofibers. For a comparison, a control TiO2 nanofiber was also synthesized under similar experimental conditions without using the CTAB surfactant in the electrospinning solution.2.2. Structural and morphological characterization
The phase analysis of the nanofibers was performed using a Shimadzu X-ray diffractometer with Cu Kα radiation (λ = 1.5406 Å). The surface morphology of both the samples was examined by scanning electron microscopy (SEM, JSM-6490 LA, JEOL, Tokyo, Japan) and high-resolution transmission electron microscopy (HR-TEM, FEI 20 FEG operating at 200 kV). Brunauer–Emmett–Teller (BET) surface area measurements were carried out by using nitrogen adsorption and desorption isotherms (BET, Micromeritics ASAP2010 Instrument Co., Norcross, GA, USA). X-ray photoelectron spectroscopy (XPS) was performed using a Kratos Analytical, Ultra axis with a monochromatic Al Kα X-ray source.2.3. Electrochemical measurements
The electrochemical cells were assembled in a glovebox under an Ar atmosphere. The porous TiO2 nanofiber electrode as the anode was made by mixing the active material (75 wt%), carbon black (15 wt%) and polyvinylidene fluoride (PVDF) binder (10 wt%) and pasted on Cu-foil. Glass fibers were used as the separator. The electrolyte consisted of a solution of 1 M LiPF6 in ethylene carbonate and dimethyl carbonate, respectively, in 1![[thin space (1/6-em)]](https://www.rsc.org/images/entities/char_2009.gif) :
:![[thin space (1/6-em)]](https://www.rsc.org/images/entities/char_2009.gif) 1 volume ratio. Pure Li foil was used as the counter electrode. Cyclic voltammetry (CV) was performed between 0 and 3 V (versus Li+/Li) using an Autolab potentiostat (PGSTAT 302 N) at a scan rate of 0.1 mV s−1. Galvanostatic testing of the coin cells was conducted using an Arbin battery tester (BT 2000) over the potential range of 1.0–3.0 V vs. Li+/Li. Electrochemical impedance spectroscopy (EIS) measurement was carried out using an Autolab potentiostat (PGSTAT 302 N) to measure the impedance of the assembled cells. Before the measurements, the cells were cycled for 10 cycles and then measured in the frequency range of 0.01 Hz to 100 MHz.
1 volume ratio. Pure Li foil was used as the counter electrode. Cyclic voltammetry (CV) was performed between 0 and 3 V (versus Li+/Li) using an Autolab potentiostat (PGSTAT 302 N) at a scan rate of 0.1 mV s−1. Galvanostatic testing of the coin cells was conducted using an Arbin battery tester (BT 2000) over the potential range of 1.0–3.0 V vs. Li+/Li. Electrochemical impedance spectroscopy (EIS) measurement was carried out using an Autolab potentiostat (PGSTAT 302 N) to measure the impedance of the assembled cells. Before the measurements, the cells were cycled for 10 cycles and then measured in the frequency range of 0.01 Hz to 100 MHz.
3. Results and discussion
3.1. Crystal structure and morphology
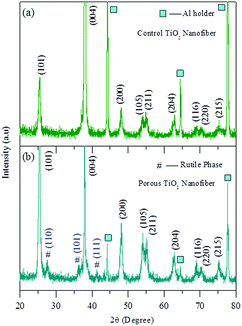
The crystal structure of both the annealed samples was examined by XRD. Fig. 1(a) and (b) show the XRD patterns of the control TiO2 nanofibers and the porous TiO2 nanofibers, respectively. The XRD pattern of the control TiO2 sample (Fig. 1(a)) can be fully indexed to the standard cubic TiO2 anatase phase (JCPDS card No. 211272). On the other hand, the major diffraction peaks in the XRD pattern of the porous TiO2 nanofiber are also well indexed to the anatase phase of TiO2 including the three main rutile TiO2 peaks at 2θ of 27.5°, 36.1° and 41.2° (JCPDS card No. 211276).Fig. 2(a) and (b) show the SEM images of the control TiO2 nanofibers and the porous TiO2 nanofibers, respectively. The SEM images of the as-spun nanofibers are also shown in the inset of Fig. 2. The as-spun TiO2 nanofibers in both cases were bead-free and continuous with lengths extending to several tens of micrometers. As shown in the inset of Fig. 2(a) and (b), the surface of the as-spun control TiO2 nanofibers was smooth, whereas the white dots are spread all over the surfaces of the TiO2–CTAB (0.75 g) nanofibers, which clearly indicate the homogenous distribution of CTAB surfactants in the sample. The as-spun nanofibers were annealed at 500 °C for 5 h in air medium for the removal of the polymer phase and producing the anatase TiO2 crystalline phase. After annealing, the nanofiber morphology remained the same, while the diameters were slightly reduced due to the removal of organic moieties (CTAB) and the polymer. Both the control TiO2 nanofibers and porous TiO2 nanofibers have diameters in the range of 80–90 nm. It can also be noticed that the nanofibers were not broken-up into smaller pieces after annealing, as revealed from Fig. 2(a) and (b). There were no major changes in the overall morphology of the fibers because of the incorporation of the CTAB during the electrospinning process.
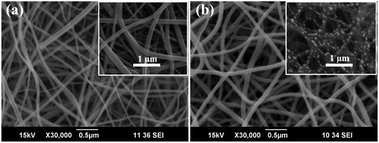 | ||
| Fig. 2 SEM images of the annealed (a) control TiO2 nanofibers and (b) porous TiO2 nanofibers. The inset of (a) and (b) shows the corresponding as-spun nanofibers for both the samples, respectively. | ||
The microstructure of the control TiO2 nanofibers and porous TiO2 nanofibers was further investigated by FE-TEM (Fig. 3). The low magnification FE-TEM images of both the nanofibers are shown in Fig. 3(a) and (d), respectively, which are in good agreement with the SEM observations. It can be seen that the nanofibers were composed of a dense array of nanosized particles, which formed a continuous fibrous morphology. Magnified FE-TEM images of the respective individual nanofibers are shown in Fig. 3(b) and (e), respectively. As shown in Fig. 3(e), the TiO2–CTAB (0.75 g) nanofibers are porous compared to the control TiO2 nanofibers, which indicates that the CTAB was homogenously dispersed throughout the nanofiber surfaces and created mesopores after annealing. The lattice fringes with an interplanar spacing of 0.348 nm and 0.347 nm, respectively, were observed in the corresponding HR-TEM images (as shown in Fig. 3(c) and (f)), which agree well with the (101) lattice spacing of the anatase TiO2 phase. Selected area electron diffraction (SAED) patterns provided in the inset of Fig. 3(c) and (f) confirm the crystallinity of the respective TiO2. It can be seen that both the samples showed well-defined concentric rings, which clearly show good crystallinity of the materials. The (101), (103) and (200) planes of anatase TiO2 (JCPDS card No. 211276) can be clearly indexed to both the patterns.
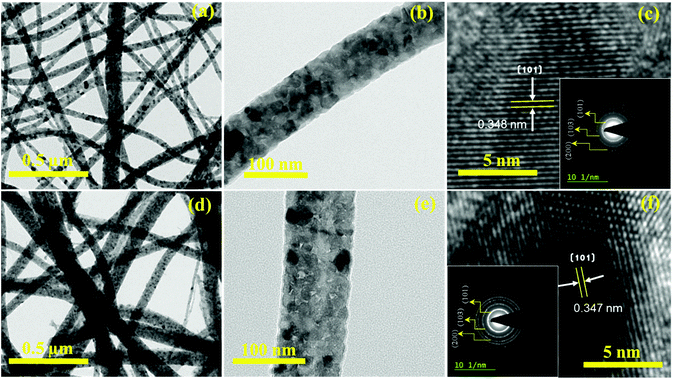 | ||
| Fig. 3 TEM images of (a and b) control TiO2 nanofibers and (d and e) porous TiO2 nanofibers. The corresponding HR-TEM images and SAED patterns are displayed in (c) and (f), respectively. | ||
In order to confirm the changes in the surface area of the porous TiO2 nanofibers after CTAB and polymer degradation during annealing, N2 adsorption–desorption isotherms were measured. Nitrogen adsorption/desorption isotherms of control TiO2 nanofibers and porous TiO2 nanofibers are presented in Fig. 4(a) and (b), respectively. The plots of both TiO2 samples can be attributed to type IV, according to IUPAC classification, which show distinct hysteresis in the range of ∼0.5–0.9 p/po. The BET specific surface area calculated from the isotherm was 18 m2 g−1 for the porous TiO2 nanofibers and 13.3 m2 g−1 for the control TiO2 nanofibers, respectively. Obviously, the BET specific surface area of the porous TiO2 nanofibers is a bit higher than that of the control TiO2 nanofibers, which is mainly due to the porous nature of the sample.
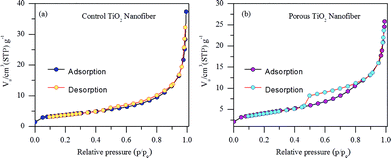 | ||
| Fig. 4 Nitrogen adsorption–desorption isotherms of (a) control TiO2 nanofibers and (b) porous TiO2 nanofibers. | ||
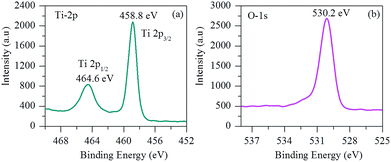
X-ray photoelectron spectroscopy (XPS) was also carried out to characterize the surface composition and chemical bonding details of the samples. Fig. 5 shows the representative XPS survey spectrum of the porous TiO2 nanofibers. As shown in Fig. 5(a), the high-resolution XPS spectrum of Ti exhibits two peaks at 458.8 eV (Ti 2p3/2) and 464.6 eV (Ti 2p1/2) with a spin–orbit coupling of 5.8 eV, which are typically in good agreement with that of Ti4+ reported in the literature.8,18,21Fig. 5(b) displays the deconvoluted O 1s spectrum of porous TiO2 nanofibers. The main O 1s peak located at 530.2 eV can be assigned to the oxygen from the TiO2 crystal lattice.
3.2. Electrochemical performance
Fig. 6(a) and (b) show the cyclic voltammograms (CVs) of the electrodes made from control and porous TiO2 nanofibers for the initial five cycles at a scan rate of 0.1 mV s−1 in the voltage range of 0–3 V, respectively. Both the samples exhibit almost similar CV patterns. It can be clearly seen that one small cathodic peak at 0.69 V for the control TiO2 electrode and 0.70 V for the porous TiO2 nanofiber electrode appeared, which is due to the decomposition of the electrolyte with the formation of amorphous Li2O and solid electrolyte interphase (SEI) layer on the surface of the active materials.18,21 Moreover, the remaining cathodic/anodic peak pairs at 1.69 V/2.05 V for the control TiO2 nanofiber electrode and 1.70 V/2.07 V for the porous TiO2 electrode in the first cycle are the characteristic peaks for Li+ ion insertion/extraction reactions in anatase TiO2, corresponding to the reversible biphasic transition between tetragonal and orthorhombic such as reduction of Ti4+ to Ti3+ and subsequent oxidation of Ti3+ to Ti4+, respectively.21 It can be noted that the second and subsequent CV curves remain steady and show only one couple peak, which indicates excellent reversibility and cycle stability for both the electrodes.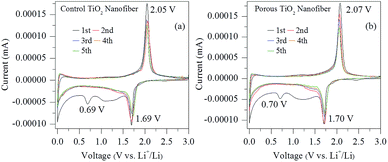 | ||
| Fig. 6 Cyclic voltammetry (CV) curves of (a) control TiO2 nanofibers and (b) porous TiO2 nanofibers at the scanning rate of 0.1 mV s−1 in the voltage range of 0.0–3.0 V. | ||
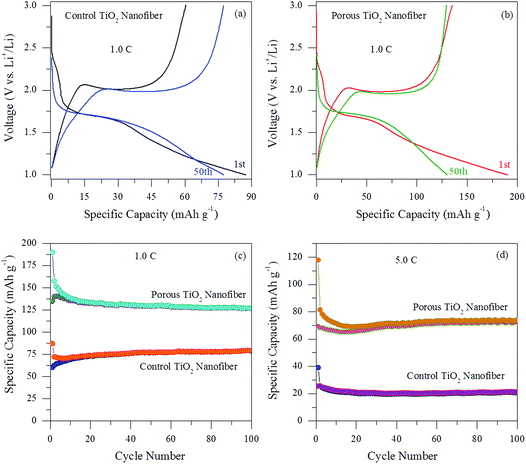
Fig. 7(a) and (b) show the voltage profiles at the 1st and 50th cycles for control and the porous TiO2 electrodes, respectively. The electrochemical performances were evaluated in the voltage range of 1.0–3.0 V vs. Li/Li+ at a current rate of 1.0C. Both the electrodes exhibit a typical voltage profile of an anatase type TiO2 anode. Firstly, a voltage drop within the region between the initial open-circuit voltage to ∼1.7 V, which is related to the formation of the solid-solution LixTiO2, indicating an initial lithium insertion into the anatase TiO2 host structure. During discharge and charge cycles, both the electrodes show a flat potential at ∼1.7 V and ∼2.0 V corresponding to lithium insertion and de-insertion for anatase TiO2, respectively. These flat potentials were similar to previously reported results.22–24 The porous TiO2 nanofiber electrode exhibits discharge and charge capacities of 189.9 mA h g−1 and 134.9 mA h g−1 for the 1st cycle and 129.8 mA h g−1 and 129.2 mA h g−1 for the 50th cycle, which are higher than those of the control TiO2 nanofiber electrode, i.e. 87.3 mA h g−1 and 60.4 mA h g−1 for the 1st cycle and 77.4 mA h g−1 and 77.3 mA h g−1 for the 50th cycle. The coulombic efficiency of both the electrodes is nearly 70% for the 1st cycle and ∼100% for the 50th cycle, suggesting a highly reversible electrochemical reaction after the 1st cycle. The irreversible capacity loss in the 1st cycle can be assigned to the non-reversible Li+ ion intercalation or the reaction between the electrolyte and the anatase surface, which is common for most nanostructured anode materials. Furthermore, it is worth noting that the porous TiO2 nanofiber electrode demonstrates more capacity compared to the control TiO2 electrode, which can be credited to its large electrochemically active surface area and more available sites for Li+ ion intercalation/de-intercalation.
The cycle performances were also evaluated for both the electrodes at different current rates and are presented in Fig. 7(c) and (d). It can be observed that both the electrodes show stable cycle performances without any noticeable capacity fading up to 100 cycles and exhibit high coulombic efficiency between 98 and 100% after a few initial cycles. The results imply that the Li+ ion intercalation and de-intercalation reactions become more reversible with the increase in the cycle number. As shown in Fig. 7(c), the porous TiO2 nanofiber electrode exhibits excellent cyclic performance at 1.0C with a high reversible specific capacity of 126.6 mA h g−1 for the 100th cycle, which is higher than that of the control TiO2 nanofiber electrode (79.2 mA h g−1 for the 100th cycle). In order to further investigate the effect of porosity by the CTAB surfactant on the electrochemical performances of the TiO2 nanofiber electrode, the cycling performance of both the electrodes was again examined at a high current rate. Fig. 7(d) shows the cycling performance of the porous and control TiO2 nanofiber electrodes at a high current rate of 5.0C for 100 cycles. It is obvious that the capacity maintenance for the porous TiO2 nanofiber electrode was better than that of the control TiO2 electrode. The reversible discharge and charge capacities were measured to be 74.1 mA h g−1 and 72.2 mA h g−1 after 100 cycles for the porous TiO2 nanofiber electrode, whereas the control TiO2 electrode shows only 21.3 mA h g−1 and 20.8 mA h g−1, respectively. It can be seen that the capacity and cycle stability of the porous TiO2 electrode at higher current rates were significantly improved compared to those of the control TiO2 nanofiber electrode. Such good cycling performance can be assigned to the relatively small volume variation of porous TiO2 nanofibers during the Li+ ion insertion/extraction process as well as the existence of high porosity in the electrode provides more electrochemically active sites to access more Li+ ions.
To better understand the advantage of porosity by the use of a surfactant in lithium ion storage, the rate capability was also tested with increasing current rates between 0.5C and 5.0C and the result is shown in Fig. 8. Obviously, the charge capacity of the porous TiO2 nanofiber is substantially increased at all investigated current rates in comparison to the control TiO2 electrode. The porous TiO2 nanofiber electrode delivers a charge capacity of over 141.2 mA h g−1 at a current rate of 0.5C, 115.3 mA h g−1 at 1.0C, 89.2 mA h g−1 at 2.0C, 63.5 mA h g−1 at 4.0C and 55.2 mA h g−1 at 5.0C, which is better than the control TiO2 electrode capacity obtained at the same current rates such as 92.4 mA h g−1, 65.2 mA h g−1, 45.5 mA h g−1, 29.5 mA h g−1 and 25.5 mA h g−1, respectively. When the current is returned to 0.5C, the porous TiO2 nanofiber electrode resumes its 92% capacity of 130.1 mA h g−1 after 30 cycles at various current rates, suggesting its better rate capability. It is believed that the improved cyclability and rate capability of the porous TiO2 electrode are due to its high porosity, large surface area and reduced lithium ion diffusion length at the electrode/electrolyte interface.
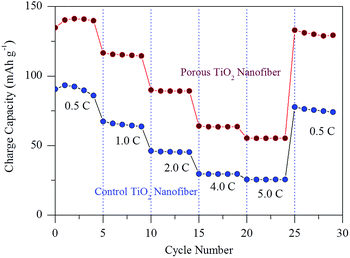 | ||
| Fig. 8 Comparison of the C-rate capability of control TiO2 nanofibers and porous TiO2 nanofibers at various current rates between 0.5C and 5.0C. | ||
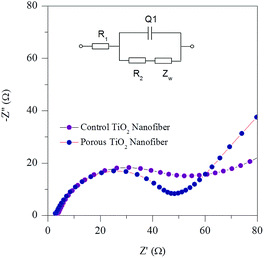
To investigate the kinetic properties of the porous TiO2 electrode, electrochemical impedance spectroscopy (EIS) was conducted. Fig. 9 shows the Nyquist plots of both the control and porous TiO2 nanofiber electrodes after 10 charge/discharge cycles. Both plots show a depressed semicircle in the high to intermediate frequency region and a straight sloping line in the low frequency region. The depressed semicircle in the high-intermediate frequency region is assigned to the charge transfer kinetics at the electrode/electrolyte interface. The straight line in a low frequency region indicates the typical Warburg behavior, which is associated with the diffusion of Li+ ions in the electrodes. A clear difference between the diameters of the semicircles is noted for the control and porous TiO2 nanofiber electrodes. It can be seen that the porous TiO2 electrode exhibits a smaller semicircle compared to the control TiO2 electrode, indicating lower impedance in the porous electrode. Thus, it is reasonable to suggest that the small charge-transfer resistance at the electrode/electrolyte interface and fast Li+ ion diffusion contribute to the better electrochemical performance of the porous TiO2 nanofiber electrode.
4. Conclusion
In summary, surfactant-assisted synthesis of porous TiO2 nanofibers was successfully carried out by an electrospinning technique, followed by annealing at a temperature of 500 °C for 5 h in air medium. As a potential anode material for lithium ion batteries, the porous TiO2 electrode exhibits excellent cycling stability and good rate performances. Precisely, it depicts a specific capacity of 126.6 mA h g−1 at 1.0C and 79.2 mA h g−1 at 5.0C after 100 cycles, which is higher than that of the control TiO2 nanofiber electrode (79.2 mA h g−1 at 1.0C and 20.8 mA h g−1 at 5.0C). It is believed that the porous nature of the TiO2 nanofiber electrode provides a shorter lithium ion diffusion length, abundant channels for lithium ion transport and facile electron transport from anatase TiO2 to the current collector. It can also be suggested that the current strategy could be extended to other metal oxide anodes with well-controlled 1-D nanostructures to achieve high lithium ion storage.Acknowledgements
A. K. Rai is grateful to the Department of Science and technology (DST), New Delhi, Government of India for the award of Ramanujan Fellowship (SB/S2/RJN-044/2015). This study was also partially supported by the Science and Engineering Research Board (SERB), government of India, vide grant no. YSS/2015/000489.References
- A. Fujishima and K. Honda, Nature, 1972, 238, 37 CrossRef CAS PubMed.
- B. O' Regan and M. Grätzel, Nature, 1991, 353, 737 CrossRef.
- G. K. Boschloo, A. Goossens and J. Schoonman, J. Electrochem. Soc., 1997, 144, 1311 CrossRef CAS.
- A. K. Rai, L. T. Anh, J. Gim, V. Mathew, J. Kang, B. J. Paul, J. Song and J. Kim, Electrochim. Acta, 2013, 90, 112 CrossRef CAS.
- V. Mathew, J. Gim, M. H. Alfaruqi, S. Kim, J. Song, J. P. Baboo, S. Kim, S. Park, D. Kim and J. Kim, J. Electrochem. Soc., 2015, 162, A1220 CrossRef CAS.
- H. G. Jung, C. S. Yoon, J. Prakash and Y. K. Sun, J. Phys. Chem. C, 2009, 113, 21258 CAS.
- J. Sundaramurthy, V. Aravindan, P. S. Kumar, S. Madhavi and S. Ramakrishna, J. Phys. Chem. C, 2014, 118, 16776 CAS.
- M. Ryu, K. Jung, K. Shin, K. Han and S. Yoon, J. Phys. Chem. C, 2013, 117, 8092 CAS.
- D. Damien, G. S. Anjusree, A. S. Nair and M. M. Shaijumon, RSC Adv., 2016, 6, 45802 RSC.
- G. Sudant, E. Baudrin, D. Larcher and J. M. Tarascon, J. Mater. Chem., 2005, 15, 1263 CAS.
- H. W. Lu, W. Zeng, Y. S. Li and Z. W. Fu, J. Power Sources, 2007, 164, 874 CrossRef CAS.
- S. Zeng, K. Tang, T. Li, Z. Liang, D. Wang, Y. Wang and W. Zhou, J. Phys. Chem. C, 2007, 111, 10217 CAS.
- Y. Li, B. Tan and Y. Wu, Nano Lett., 2008, 8, 265 CrossRef CAS PubMed.
- G. Chen, Z. Wang and D. Xia, Chem. Mater., 2008, 20, 6951 CrossRef CAS.
- J. Jiang, Y. Li, J. Liu and X. Huang, Nanoscale, 2011, 3, 45 RSC.
- J. Jiang, J. Liu, R. Ding, X. Ji, Y. Hu, X. Li, A. Hu, F. Wu, Z. Zhu and X. Huang, J. Phys. Chem. C, 2010, 114, 929 CAS.
- K. S. Park, K. M. Min, Y. H. Jin, S. D. Seo, G. H. Lee, H. W. Shim and D. W. Kim, J. Mater. Chem., 2012, 22, 15981 RSC.
- Z. Yang, G. Du, Q. Meng, Z. Guo, X. Yu, Z. Chen, T. Guo and R. Zeng, J. Mater. Chem., 2012, 22, 5848 RSC.
- S. H. Nam, H. S. Shim, Y. S. Kim, M. A. Dar, J. G. Kim and W. B. Kim, ACS Appl. Mater. Interfaces, 2010, 2, 2046 CAS.
- X. Zhang, P. Suresh Kumar, V. Aravindan, H. H. Liu, J. Sundaramurthy, S. G. Mhaisalkar, H. M. Duong, S. Ramakrishna and S. Madhavi, J. Phys. Chem. C, 2012, 116, 14780 CAS.
- W. Luo, X. Hu, Y. Sun and Y. Huang, J. Mater. Chem., 2012, 22, 4910 RSC.
- L. T. Anh, A. K. Rai, T. V. Thi, J. Gim, S. Kim, E. Shin, J. S. Lee and J. Kim, J. Power Sources, 2013, 243, 891 CrossRef CAS.
- H. Han, T. Song, J. Y. Bae, L. F. Nazar, H. Kim and U. Paik, Energy Environ. Sci., 2011, 4, 4532 CAS.
- H. Han, T. Song, E. K. Lee, A. Devadoss, Y. Jeon, J. Ha, Y. C. Chung, Y. M. Choi, Y. G. Jung and U. Paik, ACS Nano, 2012, 6, 8308 CrossRef CAS PubMed.
| This journal is © The Royal Society of Chemistry 2017 |

