 Open Access Article
Creative Commons Attribution 3.0 Unported Licence
Process exploration and assessment for the production of methanol and dimethyl ether from carbon dioxide and water†
A.
Hankin
 * and
N.
Shah

Department of Chemical Engineering, Imperial College London, London, SW7 2AZ, UK. E-mail: anna.hankin@imperial.ac.uk
First published on 8th August 2017
Abstract
A thermodynamic, model-based, study was carried out to assess the relative performance of methanol and dimethyl ether (DME) synthesis systems using CO- and CO2-based syngas feeds. The upstream production of a range of syngas feed compositions was simulated using CO2 and H2O as the sole chemical building blocks, a requirement motivated by the increasing constraints on permissible CO2 emissions and the successful adaptation by some industrial methanol plants to the direct utilisation of CO2. The objective was to establish whether the energy requirements and CO2 emissions associated with upstream conversion of CO2 to CO were justified by increased productivity in the methanol/DME systems. In the first part of the study, the performance of four systems was evaluated and compared in terms of energy efficiency and CO2 conversion: (1) methanol synthesis system, (2) direct DME synthesis system, (3) two-step DME synthesis system with an interposed syngas separation step between the methanol production reactor and methanol dehydration reactor and (4) two-step DME synthesis system with no separation step between the two reactors. Based on equilibrium yields at 250 °C and 50 bar, the direct DME synthesis system was found to exhibit the highest energy conversion efficiencies with both CO2- and CO-based syngas. Although this system demonstrated the lowest CO2 emissions per methanol equivalent product with a CO-based feed, the benefits were offset by emissions associated with the upstream conversion of H2O and CO2 to H2 and CO, evaluated in the second part of the study. It was determined that CO2 could be utilised directly in the direct DME synthesis route, whereas upstream conversion of CO2 to CO was necessary to achieve effective yields in the methanol/two-step DME systems. CO-based syngas production via high temperature co-electrolysis of H2O and CO2, or alternatively high temperature CO2 electrolysis coupled with the water–gas shift process, was identified as the best technology based on energy consumption and CO2 utilisation.
Introduction
Presently, dense energy carriers with applications in energy storage, such as methanol and dimethyl ether (DME) are, for economic reasons, derived principally from fossil fuels.1 Typically, syngas is first generated from either natural gas or coal and subsequently converted to methanol, DME or other liquid hydrocarbons via the Fischer–Tropsch process. These processes release CO2. For example, conventional methanol production plants can release over 5 t(CO2)/t(methanol),2 depending on the feedstock. However, emissions of CO2 and other greenhouse gases (GHG) into the atmosphere are becoming a global concern and regulations requiring their minimisation are being put in place.3 One of the consequences will be the gradual decarbonisation of energy sources, which is expected to decrease the overall demand for coal and gas.4 Consequently, alternative choices of raw materials, as well as the re-design of processes that would enable the minimisation of CO2 emissions, are required. Indeed this is the basis for the concept of the methanol economy,5 in which CO2 is recycled into methanol and DME for energy storage or conversion to other synthetic fuels in order to reduce dependence on fossil fuels and to mitigate the rate of global warming.Investigation of direct and indirect utilisation of CO2 in methanol and DME synthesis processes was the focus of this study because of their industrial importance and large scale production.1 Methanol is used in the manufacture of chemicals, such as formaldehyde, methyl tert-butyl ether (MTBE) and acetic acid, as well as plastics. It can be transformed into petrochemicals or blended with them for use in internal combustion engines;6 it can also be used in fuel cells.7 DME, the dehydration product of methanol, is a non-toxic chemical with uses in household products, aerosol propellants, paints and, like methanol, can be used as a fuel either directly or in a blend,7,8 for example with liquefied petroleum gas (LPG). DME has already replaced diesel fuel in the engines of some vehicles, demonstrating improved environmental performance.9,10 The advantage of both methanol and dimethyl ether is that they do not generate carbonaceous particulate matter upon combustion.
Encouragingly, several projects have now demonstrated that methanol can be synthesized directly from CO2 captured from large point sources, such as power plants, and H2 generated electrochemically from H2O.11–14 These processes utilise modified catalysts with greater tolerance to water build-up and also larger fractions of hydrogen to carbon in the system feeds than those used in conventional processes.
The feasibility of direct CO2 utilisation on an industrial scale confirms that the widely reported problems associated with slow CO2 dehydrogenation kinetics and catalyst deactivation are surmountable. Hence, the purpose of this study was to re-examine and compare the thermodynamic constraints on methanol as well as DME syntheses from CO- and CO2-based syngas using system analysis in Aspen Plus V8.8. The goal was to identify the theoretical differences between system efficiencies when CO and CO2 were the principal sources of carbon to the synthesis steps and whether in certain situations a CO2-based feed could be preferable to a CO-based one. Equilibrium syngas conversion was investigated in four systems:
1. Methanol synthesis;
2. Direct DME synthesis (methanol dehydration occurring simultaneously with CO/CO2 hydrogenation);
3. Two-step DME synthesis (methanol synthesis and methanol dehydration occurring in two separate stages) with an interposed unreacted syngas separation step;
4. Two-step DME synthesis with no separation step between the two reactors.
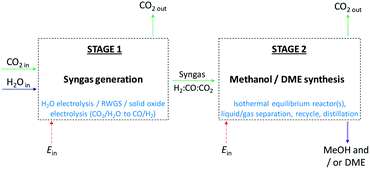
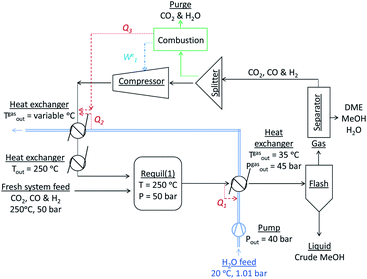
In the first part of the study, system efficiencies and extents of CO2 conversion were examined for Stage 2 in Fig. 1 as a function of hydrogen to total carbon molar ratios, H2![[thin space (1/6-em)]](https://www.rsc.org/images/entities/char_2009.gif) :
:![[thin space (1/6-em)]](https://www.rsc.org/images/entities/char_2009.gif) (CO2 + CO), in the system feed. The total molar carbon flux
(CO2 + CO), in the system feed. The total molar carbon flux![[thin space (1/6-em)]](https://www.rsc.org/images/entities/char_2009.gif) :
:![[thin space (1/6-em)]](https://www.rsc.org/images/entities/char_2009.gif) (CO2 + CO) was fixed, while the CO2
(CO2 + CO) was fixed, while the CO2![[thin space (1/6-em)]](https://www.rsc.org/images/entities/char_2009.gif) :
:![[thin space (1/6-em)]](https://www.rsc.org/images/entities/char_2009.gif) CO ratio was varied between 1 and ≈0 in order to determine the theoretical limitations imposed when CO2 rather than CO was supplied to the conversion systems. Efficiencies were evaluated as quotients of the net energies produced in Stage 2 and the energies contained in the syngas entering Stage 2. Net energies were computed based on energies extracted in the form of methanol and DME and energies required to support the operation of heaters, compressors and distillation columns in the systems. The energy contained in the syngas was based on the lower heating values of hydrogen and carbon monoxide. Various energy saving mechanisms were examined, including the combustion of vented gases and the coupling of heat exchangers.
CO ratio was varied between 1 and ≈0 in order to determine the theoretical limitations imposed when CO2 rather than CO was supplied to the conversion systems. Efficiencies were evaluated as quotients of the net energies produced in Stage 2 and the energies contained in the syngas entering Stage 2. Net energies were computed based on energies extracted in the form of methanol and DME and energies required to support the operation of heaters, compressors and distillation columns in the systems. The energy contained in the syngas was based on the lower heating values of hydrogen and carbon monoxide. Various energy saving mechanisms were examined, including the combustion of vented gases and the coupling of heat exchangers.
In the second part of the study, possible routes to syngas compositions identified as optimum for Stage 2 were explored. Energy requirements were estimated and compared against the benefits of utilising CO over CO2 in Stage 2. Decontaminated CO2 and H2O were assumed to be the sole building blocks for syngas generation in Stage 1, as shown in Fig. 1, hence respecting the system boundary.
Potential disparities between thermodynamic predictions and kinetics were not considered in this study because the broad range of feed compositions under investigation here has not been covered by a complete set of kinetic data and because the wide range of kinetic data available for different catalysts cannot be readily distilled to parameters applicable across the whole range of syngas compositions.
Industrial processes
The chemical reactions and process layouts for methanol and DME synthesis, as well as examples of industrial processes, are described below.Industrial production of methanol and dimethyl ether
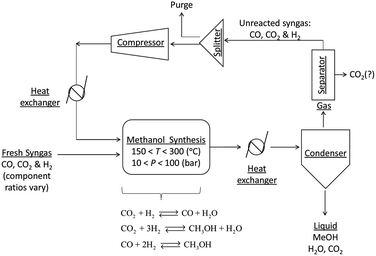
A general process layout for industrial methanol production is shown in Fig. 2. Fresh syngas in fed into a methanol reactor, which is operated at temperatures in the range of 150–300 °C and under pressures in the range 10–100 bar,11 although typical conditions are 250–260 °C and 50–60 bar. A large number of reactor designs have been commercialised, but generally these are operated either under adiabatic or isothermal conditions.7 In both reactor types, the control of reactor temperatures is one of the principal challenges because reactions (1)–(3) are exothermic and can cause temperatures to rise above 300 °C, at which catalyst deactivation often occurs.1
| CO + 2H2 ⇄ CH3OH | (1) |
| CO2 + 3H2 ⇄ CH3OH + H2O | (2) |
 | (3) |
The reactor effluent, which contains methanol, water and unreacted syngas is cooled to condense out the methanol, water and any absorbed CO2. Methanol is generally separated by distillation.11 After separation from methanol and water, the unreacted gases may be processed further, for example to remove the CO2, and then recycled into the reactor. CO2 is then vented or recycled further upstream.
Although CO2 is reported to have an adverse effect on methanol synthesis rates, studies with isotopic labelling16 on a commercial Cu/ZnO/Al2O3 catalyst showed that in fact a certain quantity of CO2 in the syngas (4–8%) is essential to make conversion to methanol possible as CO2 is the principal source of carbon in the methanol7,17 and also to protect catalysts from deactivation.18
There are presently three industrial methanol synthesis plants that exclusively utilise CO2 and H2. Mitsui Chemicals' Osaka Works combines purified CO2 exhaust with H2 produced by water electrolysis to generate methanol.11 Catalysts able to tolerate high water levels, caused by reaction (2) and the reverse water gas shift reaction (3) (RWGS), were specifically developed for these conditions. CO2 was not removed from the recycle loop, while a portion of the unreacted gases was combusted to supply heat to other parts of the system.
Carbon Recycling International (CRI) produces 4000 t per year of renewable methanol (Vulcanol™) by direct synthesis using carbon dioxide, sourced from flue gas released by a geothermal power plant, and hydrogen, generated from renewably powered water electrolysis.12 This process is reported to reduce carbon emissions by more than 85% compared with plants that utilise syngas derived from fossil fuels.19 The methanol is subsequently blended with gasoline to power cars. Two methods are potentially used to achieve CO2 and H2 conversion. In the first method, the CO2 and H2, undergo the RWGS reaction;20 following the removal of water from the product stream by condensation, and separation of CO2 by isothermal compression, hydrogen is added to the remaining product stream to achieve the ratio H2![[thin space (1/6-em)]](https://www.rsc.org/images/entities/char_2009.gif) :
:![[thin space (1/6-em)]](https://www.rsc.org/images/entities/char_2009.gif) CO of 2
CO of 2![[thin space (1/6-em)]](https://www.rsc.org/images/entities/char_2009.gif) :
:![[thin space (1/6-em)]](https://www.rsc.org/images/entities/char_2009.gif) 1, before being fed into the methanol reactor. In the second method, H2 and CO2, in a ratio of 7
1, before being fed into the methanol reactor. In the second method, H2 and CO2, in a ratio of 7![[thin space (1/6-em)]](https://www.rsc.org/images/entities/char_2009.gif) :
:![[thin space (1/6-em)]](https://www.rsc.org/images/entities/char_2009.gif) 2, are reacted directly to form methanol and CO.
2, are reacted directly to form methanol and CO.
Blue Fuel Energy is amongst the next producers of renewable methanol from captured CO2 and H2 produced in an electrolyser powered by renewables, and to convert it to gasoline.14 Net greenhouse gas (GHG) emissions are expected to be heavily influenced by the H2 production process;21 however, preliminary figures suggest a reduction in CO2 emissions by 65–84% relative to fossil fuel based processes.19
In terms of capital investment, methanol synthesis from CO2 and H2 has been estimated to be approximately the same as that for a conventional plant.1 The principal limiting factor for scale-up of such processes is said to be the availability and price of CO2 and H2 and the source of electrical energy.
The systems reported to date use a range of H2![[thin space (1/6-em)]](https://www.rsc.org/images/entities/char_2009.gif) :
:![[thin space (1/6-em)]](https://www.rsc.org/images/entities/char_2009.gif) carbon ratios, depending on whether CO or CO2 is used in the feed. A stoichiometric ratio of 2, as defined by eqn (4), is preferred for syngas with high CO
carbon ratios, depending on whether CO or CO2 is used in the feed. A stoichiometric ratio of 2, as defined by eqn (4), is preferred for syngas with high CO![[thin space (1/6-em)]](https://www.rsc.org/images/entities/char_2009.gif) :
:![[thin space (1/6-em)]](https://www.rsc.org/images/entities/char_2009.gif) CO2 ratios.
CO2 ratios.
 | (4) |
However, often for kinetic reasons a value slightly higher than 2 is employed in industry. For example, the isothermal Lurgi Methanol Converter uses SR = 2.05–2.1;22 Haldor Topsoe use SR = 2. On the other hand, for processes employing direct conversion of CO2 and H2 to methanol, a ratio of 3.5 was used13 and a ratio of 5.0 was specified as optimum.11 The higher than 2 ratio is designed to decrease the molar fraction of water so as to limit its adsorption onto the catalyst. In this way, the decrease in the methanol production efficiency can be mitigated. One of the objectives of this study was to identify the optimum thermodynamic H2![[thin space (1/6-em)]](https://www.rsc.org/images/entities/char_2009.gif) :
:![[thin space (1/6-em)]](https://www.rsc.org/images/entities/char_2009.gif) CO2 ratios in the system feeds when CO2 was utilised directly for the production of methanol/DME.
CO2 ratios in the system feeds when CO2 was utilised directly for the production of methanol/DME.
| 2CH3OH ⇔ CH3OCH3 + H2O | (5) |
Reaction (5) can take place in a designated reactor, into which methanol, produced in a separate reactor via(1), (3) and/or (2), is fed. Alternatively, both the production and dehydration of methanol can take place in the same reactor that utilises bi-functional catalysts, such as Cu/ZnO/γ-Al2O3. The former and the latter production methods are commonly referred to as the ‘two-step process’ and direct ‘one-step process’, respectively.
If only CO and H2 are present in the reactor system feed, the overall reaction is:
| 3CO + 3H2 ⇄ CH3OCH3 + CO2 | (6) |
The stoichiometric requirement for the H2![[thin space (1/6-em)]](https://www.rsc.org/images/entities/char_2009.gif) :
:![[thin space (1/6-em)]](https://www.rsc.org/images/entities/char_2009.gif) CO ratio in the feed is 1
CO ratio in the feed is 1![[thin space (1/6-em)]](https://www.rsc.org/images/entities/char_2009.gif) :
:![[thin space (1/6-em)]](https://www.rsc.org/images/entities/char_2009.gif) 1. Notably, this process will result in the generation of CO2. This drawback could be resolved by recycling and using CO2 in the process by which syngas is produced, be it dry methane reforming or reduction to CO in high temperature solid oxide electrolysers. However, in terms of CO2 emissions, the preferred option would be to minimise the generation of CO2, such that separation and recycle costs could be minimised, and that the DME production process would always result in net CO2 utilisation. If CO2 is present in the system feed together with CO and H2, the overall process reaction becomes:
1. Notably, this process will result in the generation of CO2. This drawback could be resolved by recycling and using CO2 in the process by which syngas is produced, be it dry methane reforming or reduction to CO in high temperature solid oxide electrolysers. However, in terms of CO2 emissions, the preferred option would be to minimise the generation of CO2, such that separation and recycle costs could be minimised, and that the DME production process would always result in net CO2 utilisation. If CO2 is present in the system feed together with CO and H2, the overall process reaction becomes:
| 2CO + 4H2 ⇄ CH3OCH3 + H2O | (7) |
Hence, net CO2 production by the reactor could be minimised, provided the ratio of CO2![[thin space (1/6-em)]](https://www.rsc.org/images/entities/char_2009.gif) :
:![[thin space (1/6-em)]](https://www.rsc.org/images/entities/char_2009.gif) CO
CO![[thin space (1/6-em)]](https://www.rsc.org/images/entities/char_2009.gif) :
:![[thin space (1/6-em)]](https://www.rsc.org/images/entities/char_2009.gif) H2 in the system feed is optimised in order for thermodynamics and kinetics to be favourable.
H2 in the system feed is optimised in order for thermodynamics and kinetics to be favourable.
An additional issue is the generation of water by reactions (5) and (7), resulting in CO2 and H2 production by the WGS reaction (3). While H2 is beneficial for CO conversion via reaction (1), the production of CO2 is not and serves to reverse the benefits of reaction (2). If one of the principal goals is CO2 mitigation, then the constraints on the process must include the requirement that less CO2 is produced than is consumed. Therefore, this places a lower limit on the H2![[thin space (1/6-em)]](https://www.rsc.org/images/entities/char_2009.gif) :
:![[thin space (1/6-em)]](https://www.rsc.org/images/entities/char_2009.gif) (CO2 + CO) ratio that can be used in the system feed. The degree of syngas conversion and CO2 emissions depend greatly on the type of process used: there are two principal options.
(CO2 + CO) ratio that can be used in the system feed. The degree of syngas conversion and CO2 emissions depend greatly on the type of process used: there are two principal options.
| MEP = [MeOH] + 2[DME] | (8) |
Productivity is improved in the one-step system because in situ dehydration of methanol displaces the equilibrium in eqn (1) and (2); hence, methanol yields and, consequently, DME yields increase. Due to the synergy between reactions (1)–(3) and (5), syngas conversion to DME gives higher equilibrium conversions than syngas conversion to methanol.7 Industrial feasibility studies have already been carried out,26 where several companies tested a 100 t(DME) d−1 demonstration plant, which accomplished a 96% synthesis gas (H2![[thin space (1/6-em)]](https://www.rsc.org/images/entities/char_2009.gif) :
:![[thin space (1/6-em)]](https://www.rsc.org/images/entities/char_2009.gif) CO = 1.0, derived from natural gas) conversion to DME. However, since the 2006 report of isolated tests, no large scale production of DME by the direct process is taking place.
CO = 1.0, derived from natural gas) conversion to DME. However, since the 2006 report of isolated tests, no large scale production of DME by the direct process is taking place.
Improvement of the methanol equivalent productivity by the one-step DME process over the methanol process has also been demonstrated both experimentally (250 °C and 52 bar) and numerically25,27 by academic research. However, because a mixture of DME and CO2 is formed in the one-step process, more downstream separation technologies will be required with this method than with the two-step process because of the high degree of association of the two molecules.28 Concurrent DME and CO2 separation from unreacted syngas will be necessary if the reactor operates with a H2![[thin space (1/6-em)]](https://www.rsc.org/images/entities/char_2009.gif) :
:![[thin space (1/6-em)]](https://www.rsc.org/images/entities/char_2009.gif) CO mixture. For example, DME and CO2 can be removed simultaneously with a scrubbing solvent of methanol and DME;28 subsequently further processing to separate DME from CO2 and recover the solvent is required. However, DME separation becomes more straightforward if the reactor is able to process CO2 and hence CO2 can remain in the recycle loop. Separation of DME alone may be accomplished with water as the scrubbing solvent23 and a flash separator. Consequently, recovery of DME alone will have a lesser effect on the overall energy efficiency of the process.
CO mixture. For example, DME and CO2 can be removed simultaneously with a scrubbing solvent of methanol and DME;28 subsequently further processing to separate DME from CO2 and recover the solvent is required. However, DME separation becomes more straightforward if the reactor is able to process CO2 and hence CO2 can remain in the recycle loop. Separation of DME alone may be accomplished with water as the scrubbing solvent23 and a flash separator. Consequently, recovery of DME alone will have a lesser effect on the overall energy efficiency of the process.
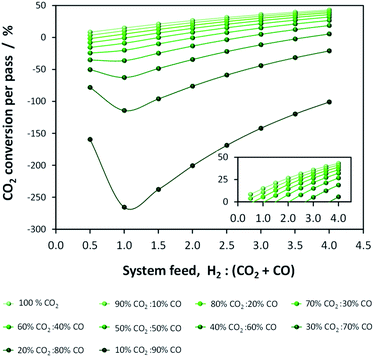
It is imperative to quantify the CO2 output from a given system. For example, in the one-step process the formation of water by reaction (5) results in more CO2 being produced than consumed. This point is evident in Fig. 3, which shows per-pass conversion of CO2 and where negative conversion signifies CO2 formation. CO2 production increases with the proportion of CO in the system feed. Consequently, operating conditions must be identified where energy efficiency is maximised while CO2 emissions are minimised. Additionally, CO2 may be recycled.
A further drawback of the one-step system is that, in practice, catalyst activity may become inhibited by water build-up from the methanol dehydration process. However, judicious reactor designs have been proposed to mitigate this issue.31
In summary, optimum operating conditions are well understood for methanol and DME synthesis systems operating with H2 and CO in the feed. Hydrogen to carbon monoxide ratios of 2 and 1 are preferred for the methanol/two-step DME synthesis systems and direct DME synthesis system, respectively. Considerably less is known about processes using CO2 and CO/CO2 blends instead of CO, especially when CO2 is introduced into the recycle loop. Hence, the impact of CO2 on equilibrium yields of methanol and DME was examined in this study, with focus on system performance and CO2 conversion.
Process assessment methodology
Syngas conversion rates per pass are typically far below equilibrium values and hence the unconverted syngas is separated from the reaction products and recycled back into the reactors for methanol synthesis or direct DME synthesis. In most industrial systems CO2 is not included in the recycle and is either vented or utilised upstream. However, if the process is to achieve positive net CO2 conversion then CO2 could be recycled together with CO and H2 and hence this separation step is obviated. Whilst recycle would maximise CO2 conversion, the resultant relative ratios of H2![[thin space (1/6-em)]](https://www.rsc.org/images/entities/char_2009.gif) :
:![[thin space (1/6-em)]](https://www.rsc.org/images/entities/char_2009.gif) CO2
CO2![[thin space (1/6-em)]](https://www.rsc.org/images/entities/char_2009.gif) :
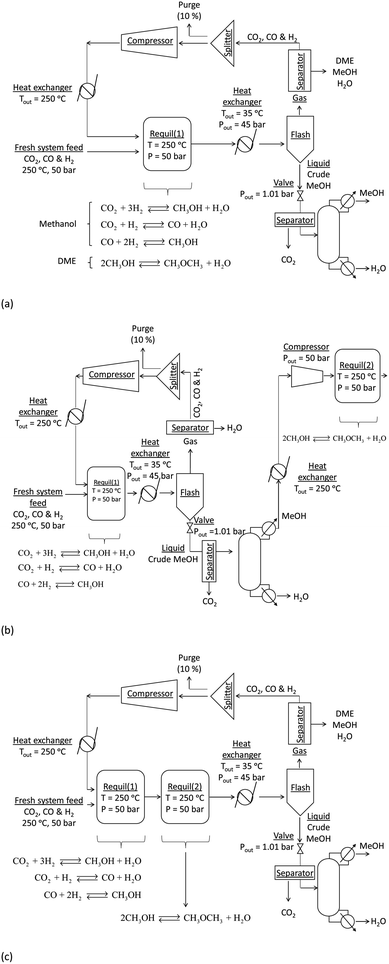
:![[thin space (1/6-em)]](https://www.rsc.org/images/entities/char_2009.gif) CO in the recycle loop could be significantly different to those in the system feed, which would in turn alter the conversions and yields. Furthermore, the amount of energy contained in the methanol and/or DME product(s) will be offset by the operating energy requirements of multiple system components, such as heat exchangers, compressors and distillation columns. Ultimately, the best system operating conditions will be those at which the energy efficiency is maximised. Hence, the objective of the present study was to include all of the above considerations in the evaluation and comparison of the energy outputs and energy requirements for 4 different systems: methanol synthesis, direct DME synthesis, 2-step DME synthesis with an interposed syngas separation step and 2-step DME synthesis with no separation step between the two reactors. The three DME synthesis schemes are shown in Fig. 4; the methanol synthesis scheme is analogous to that shown in Fig. 4a but without the extra methanol dehydration step.
CO in the recycle loop could be significantly different to those in the system feed, which would in turn alter the conversions and yields. Furthermore, the amount of energy contained in the methanol and/or DME product(s) will be offset by the operating energy requirements of multiple system components, such as heat exchangers, compressors and distillation columns. Ultimately, the best system operating conditions will be those at which the energy efficiency is maximised. Hence, the objective of the present study was to include all of the above considerations in the evaluation and comparison of the energy outputs and energy requirements for 4 different systems: methanol synthesis, direct DME synthesis, 2-step DME synthesis with an interposed syngas separation step and 2-step DME synthesis with no separation step between the two reactors. The three DME synthesis schemes are shown in Fig. 4; the methanol synthesis scheme is analogous to that shown in Fig. 4a but without the extra methanol dehydration step.
Equilibrium syngas conversions were computed in Aspen Plus V8.8 using the Peng–Robinson equation of state; reaction-specific scenarios were simulated in the REquil reactor (rigorous equilibrium reactor based on stoichiometric approach) at a fixed temperature of 250 °C and pressure of 50 bar. Results are presented as a function of hydrogen to total carbon molar ratios, H2![[thin space (1/6-em)]](https://www.rsc.org/images/entities/char_2009.gif) :
:![[thin space (1/6-em)]](https://www.rsc.org/images/entities/char_2009.gif) (CO2 + CO), in the system feed. The total molar carbon flux
(CO2 + CO), in the system feed. The total molar carbon flux![[thin space (1/6-em)]](https://www.rsc.org/images/entities/char_2009.gif) :
:![[thin space (1/6-em)]](https://www.rsc.org/images/entities/char_2009.gif) (CO2 + CO) was fixed, while the CO2
(CO2 + CO) was fixed, while the CO2![[thin space (1/6-em)]](https://www.rsc.org/images/entities/char_2009.gif) :
:![[thin space (1/6-em)]](https://www.rsc.org/images/entities/char_2009.gif) CO ratio was varied between 1 and ≈0. The relative methanol yields from methanol synthesis were also compared with the methanol equivalent product (MEP), computed using eqn (8), from direct DME synthesis. In these simulations the formation of by-products such as alkanes (methane, ethane, propane and other light hydrocarbons23), due to <100% catalyst selectivity,29 was neglected. The methanol and DME yields from the CO and CO2 molar concentrations in the feed were computed according to eqn (9) and (10), respectively.
CO ratio was varied between 1 and ≈0. The relative methanol yields from methanol synthesis were also compared with the methanol equivalent product (MEP), computed using eqn (8), from direct DME synthesis. In these simulations the formation of by-products such as alkanes (methane, ethane, propane and other light hydrocarbons23), due to <100% catalyst selectivity,29 was neglected. The methanol and DME yields from the CO and CO2 molar concentrations in the feed were computed according to eqn (9) and (10), respectively.
 | (9) |
 | (10) |
System streams
In all systems fresh syngas entered the first reactor pre-heated and pre-pressurized. In the methanol system and in systems (a) and (b) the output streams from the first reactor were cooled in heat exchangers and condensed in flash columns. In system (c) the product stream from the first reactor underwent further conversion in the second reactor before being cooled and passed through a condenser. In system (b) the liquid stream from the flash column containing principally methanol, water and a small molar fraction of CO2 was expanded to atmospheric pressure in a valve and processed in a distillation column in order to obtain a concentrated liquid methanol stream. The methanol was then re-heated, re-pressurised and dehydrated to DME. In all systems a 5 bar pressure drop in the recycle loops was assumed.30In all four systems, 90% of the unreacted syngas from the flash column was re-pressurised to 50 bar, re-heated to match the temperature and pressure of the fresh syngas and recirculated back into the first reactor. The remaining 10% was purged to avoid build-up of unreacted gas components. In systems (a) and (b) the DME was removed from the unreacted gases using idealised separators. In practice, DME removal could be achieved using a scrubbing solvent such as water.23 Energy requirements for this step were not considered explicitly in this study. Neither the separation of the three syngas components from each other to enable the adjustment of their ratios in the recycle loop nor the addition of specific gases to the recycle loop was considered. Hence, the gas ratios in the reactor feed were typically different to those in the system feed.
Reactors
The reactors were assumed to operate under isothermal conditions. In practice the syngas temperature at the inlet is set to be tens of degrees lower than the reactor temperature31 because the heat released by the exothermic reactions (1)–(3) and (5) can cause significant and undesirable temperature gradients inside the reactors and result in catalyst deactivation. However, the temperature profiles are highly specific to the convective effects/cooling mechanisms employed in different reactor designs and hence in this study the inlet gas temperatures were matched to the reactor temperatures, resulting in slight overestimation of heater duties.Energy efficiency analysis
There were three levels in the analyses of system energy requirements: in the first, the heater and compressor energy requirements were met entirely by external means and were associated with additional CO2 emissions; in the second, the pre-flash column heat exchangers were coupled with the recycle loop heat exchangers via a water stream to generate an energy saving; finally, combustion of the H2 and CO gases in the purge stream to meet a fraction of the compressor and heat exchanger energy requirements was considered as an option. The complete conversion of the purged H2 and CO to either heat or electrical energy was assumed to allow the utilisation of ca. 60% of the combustion energy, based on their respective lower heating values (237 kJ mol−1 for H2 and 283 kJ mol−1 for CO32). These additional considerations are shown schematically in Fig. 5.Compressors, pumps, heat exchangers and distillation columns
The gas compressors were assumed to operate with an isentropic efficiency of 90% and a mechanical efficiency of 90%. The water stream by which the heat exchangers were coupled had initial temperature and pressure of 20 °C and 1 atmosphere respectively, and was pressurized with a pump assumed to operate with 70% energy efficiency to 40 bar prior to entry into the first heat exchanger. This water stream was constrained to a liquid state (Tsat = 250 °C at 40 bar) at all stages. Additional heat exchangers were added to the recycle loop to ensure the recycled gas stream was pre-heated to 250 °C, prior to re-entry into the first reactor.DSTWU distillation columns in Aspen Plus, utilising Gilliland's, Winn's, and Underwood's methods were used to model methanol separation from water by computing the required number of stages and reflux ratios for each scenario. Idealised separators were employed for removing CO2 and any minute fractions of CO and H2 from the liquid crude methanol stream prior to entry into the distillation units.
Not taken into account were the energy requirement and CO2 emissions associated with the supply of the air/O2 that would be required to support CO and H2 combustion. Furthermore, the energy required to pressurise and heat the fresh feed gases to the system were not included and are part of a separate analysis that addresses the mechanisms of syngas production.
CO2 emissions
The power demand and CO2 emissions associated with the heat exchangers as well as with the compressors, the water pump and the reboiler and condenser in the distillation columns were computed and taken into account in the energy balance, assuming emissions of 5.4 kg(CO2) GJ−1.33 In practice, the gases can either undergo homogenous combustion, for which the combustion temperature would need to exceed the auto-ignition temperatures of both H2 (500 °C) and CO (609 °C)34 or alternatively direct conversion to electrical energy in fuel cells. CO2 emissions resulting from complete combustion of the purged CO have also been taken into account; combustion of H2 does not generate CO2 as the product is only water vapour.Results and discussion
Equilibrium yields without recycle
Although calculations for equilibrium yields have been performed previously for both methanol and DME synthesis,25 and are conclusive about the optimum molar proportions of H2 and CO in the reactor feed, it is beneficial to perform these calculations with the additional inclusion of CO2 in order to understand the different choices of feed compositions used industrially, especially where CO2 is the principal source of carbon. Hence, initially the per-pass equilibrium yields of methanol and DME, their molar fractions in the reactor product streams, the extents of H2, CO2 and CO conversion, as well as the molar fractions of the water by-product are shown in Fig. 1S–4S in the (ESI†).Fig. 1S(a)† shows that in the case of methanol synthesis, the process output is much more sensitive to the H2![[thin space (1/6-em)]](https://www.rsc.org/images/entities/char_2009.gif) :
:![[thin space (1/6-em)]](https://www.rsc.org/images/entities/char_2009.gif) CO ratio than it is to the H2
CO ratio than it is to the H2![[thin space (1/6-em)]](https://www.rsc.org/images/entities/char_2009.gif) :
:![[thin space (1/6-em)]](https://www.rsc.org/images/entities/char_2009.gif) CO2 ratio. As shown previously,25 a process utilising principally H2 and CO in the feed exhibits optimum performance in terms of the methanol molar fraction in the product stream at the stoichiometric H2
CO2 ratio. As shown previously,25 a process utilising principally H2 and CO in the feed exhibits optimum performance in terms of the methanol molar fraction in the product stream at the stoichiometric H2![[thin space (1/6-em)]](https://www.rsc.org/images/entities/char_2009.gif) :
:![[thin space (1/6-em)]](https://www.rsc.org/images/entities/char_2009.gif) CO ratio of ≈2. At higher H2 to carbon ratios, the conversion of CO2 and CO to methanol continues to increase with a decreasing slope (sub-Fig. 1S(c) and (d)†), but at the expense of lower hydrogen conversion (Fig. 1S(e)†). Hence, the choice of whether to operate under hydrogen rich conditions will be dictated by the cost of hydrogen production and energy consumption of methanol separation. However, hydrogen-rich conditions can promote the formation of water, especially when CO2 is the main source of carbon, and this places significant constraints on the choice of catalyst. Water production by the reverse water gas shift reaction increases substantially with CO2 fraction in the syngas feed, passing through a maximum at H2
CO ratio of ≈2. At higher H2 to carbon ratios, the conversion of CO2 and CO to methanol continues to increase with a decreasing slope (sub-Fig. 1S(c) and (d)†), but at the expense of lower hydrogen conversion (Fig. 1S(e)†). Hence, the choice of whether to operate under hydrogen rich conditions will be dictated by the cost of hydrogen production and energy consumption of methanol separation. However, hydrogen-rich conditions can promote the formation of water, especially when CO2 is the main source of carbon, and this places significant constraints on the choice of catalyst. Water production by the reverse water gas shift reaction increases substantially with CO2 fraction in the syngas feed, passing through a maximum at H2![[thin space (1/6-em)]](https://www.rsc.org/images/entities/char_2009.gif) :
:![[thin space (1/6-em)]](https://www.rsc.org/images/entities/char_2009.gif) CO2 of approximately 2, but subsequently decreasing (Fig. 1S(f)†). The decay in the molar fraction of the water by-product under hydrogen rich conditions for a H2–CO2 feed justifies the choice of higher H2
CO2 of approximately 2, but subsequently decreasing (Fig. 1S(f)†). The decay in the molar fraction of the water by-product under hydrogen rich conditions for a H2–CO2 feed justifies the choice of higher H2![[thin space (1/6-em)]](https://www.rsc.org/images/entities/char_2009.gif) :
:![[thin space (1/6-em)]](https://www.rsc.org/images/entities/char_2009.gif) CO2 ratios employed industrially.11,13 Consequently, for systems utilising primarily CO and H2, stoichiometric feed compositions give the optimum yield, while for systems using primarily CO2 and H2, higher CO2 conversion can be achieved under hydrogen-rich conditions, provided the hydrogen can be sourced sufficiently cheaply and the chosen catalyst can tolerate water build-up. However, even if CO2 is the sole source of carbon in the system feed, in the presence of a recycle loop, a certain quantity of carbon monoxide will be present in the reactor feed as it is formed via the reverse water gas shift reaction in parallel with methanol synthesis.
CO2 ratios employed industrially.11,13 Consequently, for systems utilising primarily CO and H2, stoichiometric feed compositions give the optimum yield, while for systems using primarily CO2 and H2, higher CO2 conversion can be achieved under hydrogen-rich conditions, provided the hydrogen can be sourced sufficiently cheaply and the chosen catalyst can tolerate water build-up. However, even if CO2 is the sole source of carbon in the system feed, in the presence of a recycle loop, a certain quantity of carbon monoxide will be present in the reactor feed as it is formed via the reverse water gas shift reaction in parallel with methanol synthesis.
If methanol dehydration can proceed simultaneously with CO2 and CO hydrogenation, the methanol equivalent product (MEP) is greater than in the case of methanol, as shown in Fig. 6. The advantage is especially apparent when H2![[thin space (1/6-em)]](https://www.rsc.org/images/entities/char_2009.gif) :
:![[thin space (1/6-em)]](https://www.rsc.org/images/entities/char_2009.gif) (CO2 + CO) < 1. However, for the various CO2
(CO2 + CO) < 1. However, for the various CO2![[thin space (1/6-em)]](https://www.rsc.org/images/entities/char_2009.gif) :
:![[thin space (1/6-em)]](https://www.rsc.org/images/entities/char_2009.gif) CO ratios it is apparent that the greatest advantage of the additional dehydration step can be gained when CO2 is the principal source of carbon. For a syngas feed without CO2, the maximum DME molar fraction in the product is found at a H2
CO ratios it is apparent that the greatest advantage of the additional dehydration step can be gained when CO2 is the principal source of carbon. For a syngas feed without CO2, the maximum DME molar fraction in the product is found at a H2![[thin space (1/6-em)]](https://www.rsc.org/images/entities/char_2009.gif) :
:![[thin space (1/6-em)]](https://www.rsc.org/images/entities/char_2009.gif) CO ratio of 1, which corresponds to a more carbon rich regime relative to methanol alone (Fig. 2S(a)) in the (ESI†). Under this condition, the build-up of water is minimised by the water gas shift reaction but at the expense of carbon dioxide formation, as is evident from Fig. 2S(c).† Hence, if the CO in the syngas is produced from CO2 in Stage 1 (Fig. 1), then it would be impractical to reverse the benefits of further conversion to fuel in Stage 2 by selecting conditions that would re-generate the CO2 to the greatest degree. Fig. 7 shows the extents of CO to CO2 conversion in the methanol and direct DME processes when a H2–CO only feed is used, illustrating the undesirable impact of the water gas shift process that takes place as a result of H2O formation from in situ methanol dehydration. Hence, operation with a H2–CO feed is unsuitable in the absence of CO2 recycle.
CO ratio of 1, which corresponds to a more carbon rich regime relative to methanol alone (Fig. 2S(a)) in the (ESI†). Under this condition, the build-up of water is minimised by the water gas shift reaction but at the expense of carbon dioxide formation, as is evident from Fig. 2S(c).† Hence, if the CO in the syngas is produced from CO2 in Stage 1 (Fig. 1), then it would be impractical to reverse the benefits of further conversion to fuel in Stage 2 by selecting conditions that would re-generate the CO2 to the greatest degree. Fig. 7 shows the extents of CO to CO2 conversion in the methanol and direct DME processes when a H2–CO only feed is used, illustrating the undesirable impact of the water gas shift process that takes place as a result of H2O formation from in situ methanol dehydration. Hence, operation with a H2–CO feed is unsuitable in the absence of CO2 recycle.
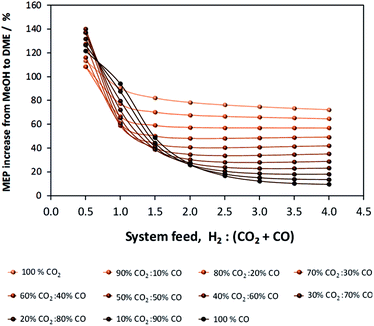 | ||
| Fig. 6 MEP increase of the direct DME process relative to methanol alone; calculations based on reactor outputs at 250 °C and 50 bar in the absence of recycle. | ||
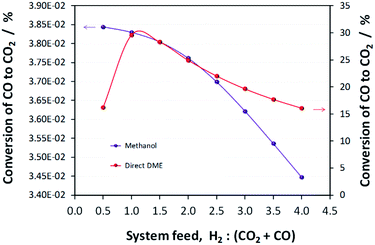 | ||
| Fig. 7 Extents of CO conversion to CO2via the water gas shift reaction during methanol and direct DME synthesis when a H2–CO only feed was employed. | ||
Unsurprisingly, the extents of CO and H2 conversion in direct DME synthesis also change very significantly relative to the case of methanol production; the increase in both is shown in Fig. 2S(d) and (e).† Water build-up increases dramatically in the direct DME synthesis process relative to the methanol process (Fig. 2S(f)†) and this is thought to be the principal reason why the direct synthesis of DME is not yet deployed industrially. Once catalysts able to survive water build-up are developed then direct utilisation of CO2 rather than CO is preferable if the direct DME synthesis is to simultaneously fulfil the requirements of achieving net negative CO2 emissions and higher MEP relative to methanol synthesis alone.
Two principal disadvantages of direct DME synthesis, namely the net negative CO2 conversion over a wide range of syngas compositions and also the ultimate need to separate DME from CO2, which are strongly associating, can be overcome if the 2-step synthesis is employed. However, because the two-step process does not utilise the synergy between the CO2 and CO hydrogenation processes and the methanol dehydration process, the MEP will not improve relative to methanol synthesis alone. Fig. 3S and 4S in the ESI† show results corresponding to two possible scenarios for the two-step process: in the first scenario, the unreacted syngas (H2, CO2 and CO) from the methanol reactor is cooled and separated from the product stream in a condenser; the crude liquid methanol undergoes distillation and the isolated methanol stream then undergoes further processing in the DME reactor (Fig. 3S†). In the second scenario the product stream from the methanol reactor is fed directly into the DME reactor without any processing and it is assumed that only the methanol dehydration, unaccompanied by the WGS reaction, can occur in the second reactor (Fig. 4S); it was assumed explicitly that the rate of the WGS process is nil or negligible on methanol dehydration catalysts, for example when using γ-Al2O3 as catalyst at 250 °C.
The principal conclusion from the comparison of the two-step systems is that in terms of thermodynamics, there is no added benefit in isolating the water and unreacted syngas from the methanol before it undergoes dehydration to DME in the second reactor. This is because at 250 °C the equilibrium yield of DME from methanol is virtually independent of pressure. Hence, although the partial pressure of methanol is much lower in the absence of a separation step, the conversion is not affected. But again, in reality the kinetics may be affected by the strong difference in partial pressure between the two systems. The DME yield was marginally lower in the ‘separated’ case due to the efficiency of liquid methanol separation in the condenser. In conclusion, the choice of process will depend on the relative energy demands of the extra distillation and re-heating steps in the separated case and with DME separation from CO2 in the non-separated case.
Methanol and DME synthesis systems analysis
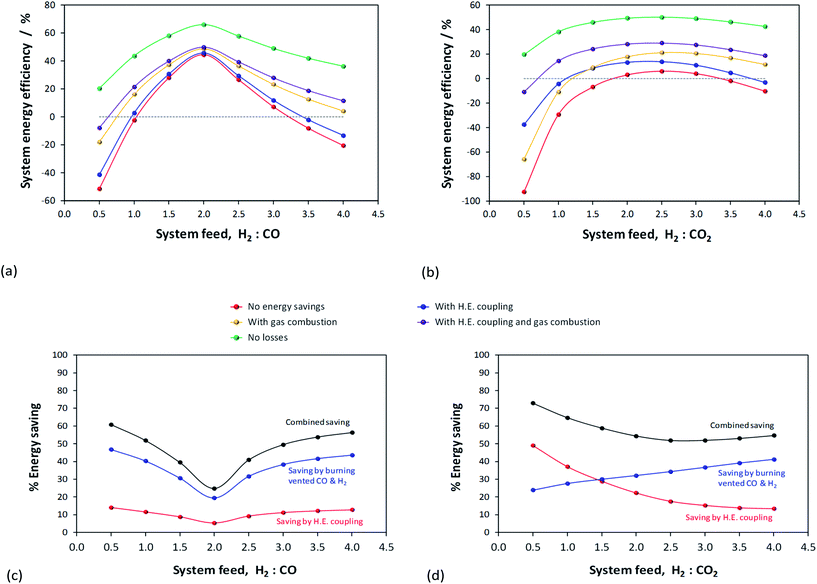
Results presented in Fig. 6, 7 and 1S–4S in the ESI† differ dramatically once a recycle loop is introduced and energy demands for various different system components are accounted for. Fig. 8 shows the overall efficiencies for the methanol synthesis system for two extreme cases: (a) a H2–CO only feed and (b) a H2–CO2 only feed. Net energy outputs were computed as the energies extracted in the form of methanol and corrected by the energy demands for system operation and energies lost in unreacted H2 and CO gases that were vented. These outputs were normalised by the total energies contained in the H2 and CO feeds to the systems. Worst case scenarios in both cases correspond to situations where no energy saving mechanisms were employed; the best case (theoretical only) scenarios show only the energy contained in the methanol, assuming the syngas conversion systems require no additional energy to operate. Three intermediate cases show the net energy outputs when heat exchangers were coupled, when the vented gases were used for heat/power production and when both of these energy saving mechanisms were employed together. Fig. 8(c) and (d) show the corresponding contributions of these energy saving methods for the H2–CO and H2–CO2 scenarios.Methanol production with a H2–CO only feed shows the predictable peak in performance at a system feed H2![[thin space (1/6-em)]](https://www.rsc.org/images/entities/char_2009.gif) :
:![[thin space (1/6-em)]](https://www.rsc.org/images/entities/char_2009.gif) CO ratio of 2.0. At this ratio, the system requires minimal energy savings and the point of optimal performance is affected only marginally by the improvements to the energy efficiency. In terms of energy savings, across the entire H2
CO ratio of 2.0. At this ratio, the system requires minimal energy savings and the point of optimal performance is affected only marginally by the improvements to the energy efficiency. In terms of energy savings, across the entire H2![[thin space (1/6-em)]](https://www.rsc.org/images/entities/char_2009.gif) :
:![[thin space (1/6-em)]](https://www.rsc.org/images/entities/char_2009.gif) CO range greater energy savings were obtained by combusting the vented unreacted H2 and CO2; hence this approach is essential.
CO range greater energy savings were obtained by combusting the vented unreacted H2 and CO2; hence this approach is essential.
In the absence of energy savings, the optimum operating point for the H2–CO2 system lies at a H2![[thin space (1/6-em)]](https://www.rsc.org/images/entities/char_2009.gif) :
:![[thin space (1/6-em)]](https://www.rsc.org/images/entities/char_2009.gif) CO2 ratio of 2.5, which, interestingly, is not the stoichiometric ratio of reaction (2). The peak, however, is much broader than in the H2–CO case and the acceptable operating range is arguably between H2
CO2 ratio of 2.5, which, interestingly, is not the stoichiometric ratio of reaction (2). The peak, however, is much broader than in the H2–CO case and the acceptable operating range is arguably between H2![[thin space (1/6-em)]](https://www.rsc.org/images/entities/char_2009.gif) :
:![[thin space (1/6-em)]](https://www.rsc.org/images/entities/char_2009.gif) CO2 feed ratios of 2.0–3.0. The H2
CO2 feed ratios of 2.0–3.0. The H2![[thin space (1/6-em)]](https://www.rsc.org/images/entities/char_2009.gif) :
:![[thin space (1/6-em)]](https://www.rsc.org/images/entities/char_2009.gif) CO2 ratio of highest net energy production remained unchanged regardless of which energy saving mechanisms were employed. The slopes of the curves are markedly different to those for the H2–CO case, especially at hydrogen-rich conditions, and show the greater tolerance of H2–CO2 system to different feed gas ratios.
CO2 ratio of highest net energy production remained unchanged regardless of which energy saving mechanisms were employed. The slopes of the curves are markedly different to those for the H2–CO case, especially at hydrogen-rich conditions, and show the greater tolerance of H2–CO2 system to different feed gas ratios.
The optimum operating range evident from Fig. 8b is not in agreement with the preferred H2![[thin space (1/6-em)]](https://www.rsc.org/images/entities/char_2009.gif) :
:![[thin space (1/6-em)]](https://www.rsc.org/images/entities/char_2009.gif) CO2 feed ratios of 5.0 and 3.5, specified in ref. 11 and 13, respectively. It is possible that if hydrogen was sourced renewably, then limiting the H2 fraction in the feed was less important. The molar fractional water content in the reactor is only marginally lower at H2
CO2 feed ratios of 5.0 and 3.5, specified in ref. 11 and 13, respectively. It is possible that if hydrogen was sourced renewably, then limiting the H2 fraction in the feed was less important. The molar fractional water content in the reactor is only marginally lower at H2![[thin space (1/6-em)]](https://www.rsc.org/images/entities/char_2009.gif) :
:![[thin space (1/6-em)]](https://www.rsc.org/images/entities/char_2009.gif) CO2 of 3.5 (0.058) than at 2.5 (0.062) and so the reasons for the use of higher H2 mole fractions are probably rather related to kinetics. Finally, Fig. 8b and (d) demonstrate that, for a H2–CO2 feed, both energy saving methods are necessary to achieve a positive net energy output and to improve the system efficiency.
CO2 of 3.5 (0.058) than at 2.5 (0.062) and so the reasons for the use of higher H2 mole fractions are probably rather related to kinetics. Finally, Fig. 8b and (d) demonstrate that, for a H2–CO2 feed, both energy saving methods are necessary to achieve a positive net energy output and to improve the system efficiency.
Fig. 5S in the ESI† shows the optimised net energy output curves for (a) the methanol, (b) direct DME, (c) 2-step DME synthesis with an interposed syngas separation step and (d) 2-step DME synthesis with no separation step between the two reactors. For each scenario, curves for a H2–CO only, H2–CO2 only and H2- (50% CO![[thin space (1/6-em)]](https://www.rsc.org/images/entities/char_2009.gif) :
:![[thin space (1/6-em)]](https://www.rsc.org/images/entities/char_2009.gif) 50% CO2) system feeds are presented. In all the cases where methanol is produced in the first step, the optimum operating point lies between H2
50% CO2) system feeds are presented. In all the cases where methanol is produced in the first step, the optimum operating point lies between H2![[thin space (1/6-em)]](https://www.rsc.org/images/entities/char_2009.gif) :
:![[thin space (1/6-em)]](https://www.rsc.org/images/entities/char_2009.gif) C ratios of 2.0–2.5, being higher for syngas system feeds with more CO2 content. The optimum point for the direct DME synthesis is at a ratio of 1.0 for the H2–CO case, but the breadth of the peak allows for high efficiency operation between ratios of 1.0–2.0. For the H2–CO2 feed in the direct DME case the peak is again at the feed ratio of 2.5. Interestingly, the 50
C ratios of 2.0–2.5, being higher for syngas system feeds with more CO2 content. The optimum point for the direct DME synthesis is at a ratio of 1.0 for the H2–CO case, but the breadth of the peak allows for high efficiency operation between ratios of 1.0–2.0. For the H2–CO2 feed in the direct DME case the peak is again at the feed ratio of 2.5. Interestingly, the 50![[thin space (1/6-em)]](https://www.rsc.org/images/entities/char_2009.gif) :
:![[thin space (1/6-em)]](https://www.rsc.org/images/entities/char_2009.gif) 50 CO2
50 CO2![[thin space (1/6-em)]](https://www.rsc.org/images/entities/char_2009.gif) :
:![[thin space (1/6-em)]](https://www.rsc.org/images/entities/char_2009.gif) CO cases exhibited considerably higher efficiencies at CO2/CO-rich conditions compared with the other two feed compositions.
CO cases exhibited considerably higher efficiencies at CO2/CO-rich conditions compared with the other two feed compositions.
Table 1 shows the peak energy efficiencies that have been computed for each system both in the absence and presence of energy saving procedures. These maxima are evident in Fig. 9, where the net energies obtained in the four processes are compared directly. The highest efficiencies were obtained for H2–CO only feeds in the direct DME system and the 2-step DME system where there was no processing step between the two reactors. The poorer performance of the methanol system and the 2-step DME system in which crude methanol is isolated from the unreacted syngas and distilled before being dehydrated, is in part due to the poor efficiency of the methanol condensation stage. The fraction of the methanol extracted in liquid form is especially low under CO/CO2-rich conditions, as shown in Fig. 6S in the ESI.† The fraction of DME recovered from the flash column in gaseous form, however, is considerably higher at over 99.8% across the whole H2![[thin space (1/6-em)]](https://www.rsc.org/images/entities/char_2009.gif) :
:![[thin space (1/6-em)]](https://www.rsc.org/images/entities/char_2009.gif) C range, as shown in Fig. 7S.† Furthermore, the 2-step system with separation has additional energy demands for reheating and re-compressing the methanol and for this reason exhibits the poorest performance.
C range, as shown in Fig. 7S.† Furthermore, the 2-step system with separation has additional energy demands for reheating and re-compressing the methanol and for this reason exhibits the poorest performance.
![[thin space (1/6-em)]](https://www.rsc.org/images/entities/char_2009.gif) :
:![[thin space (1/6-em)]](https://www.rsc.org/images/entities/char_2009.gif) 50% CO. The net energy outputs of each system were normalised against the energies contained in the CO and H2 gases in the system feeds
50% CO. The net energy outputs of each system were normalised against the energies contained in the CO and H2 gases in the system feeds
| System feed | Maximum energy efficiency/% | |||||||
|---|---|---|---|---|---|---|---|---|
| Without energy savings | With maximum energy savings | |||||||
| Methanol | Direct DME | 2-Step DME with separation | 2-Step DME without separation | Methanol | Direct DME | 2-Step DME with separation | 2-Step DME without separation | |
| 100% CO | 44.6 | 63.3 | 34.6 | 60.4 | 49.9 | 69.2 | 44.6 | 65.7 |
| 50% CO: 50% CO2 | 23.7 | 50.6 | 14.9 | 35.7 | 39.2 | 60.6 | 34.7 | 51.6 |
| 100% CO2 | 6.11 | 39.4 | −2.4 | 17.4 | 29.0 | 53.0 | 24.4 | 40.5 |
![[thin space (1/6-em)]](https://www.rsc.org/images/entities/char_2009.gif) |
||||||||
| Difference in energy efficiency obtained with CO-only feeds and CO 2 -only feeds/% | ||||||||
| 38.5 | 23.9 | 37.0 | 43.0 | 21.0 | 16.2 | 20.2 | 25.2 | |
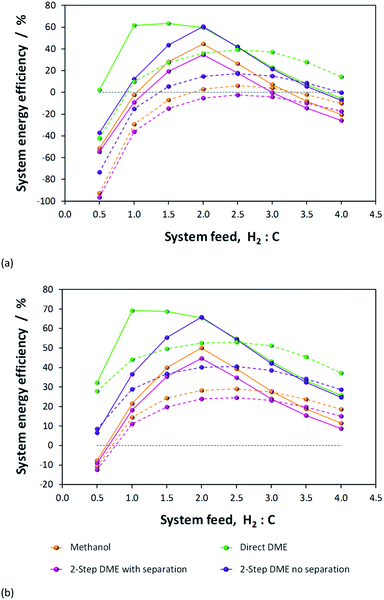 | ||
| Fig. 9 Net energies obtained with (a) no energy savings and (b) maximum savings with the H2–CO only (solid lines) and H2–CO2 only (dashed lines) system feeds for the four systems under investigation. | ||
It should be noted that the penalties in terms of the energy demands for DME recovery from syngas and the resultant decreases in efficiency were not included in the analysis. In practice, DME can be removed by exposure of the gaseous output from the flash column to a water stream in which DME is soluble.23 The water scrubbing fluid would be at a temperature in the range 1–20 °C and at a similar pressure to that at which DME synthesis is carried out. Subsequently, DME could be separated from water at reduced pressure in a flash column.
The goal of the present study was to identify the best system for either directly processing CO2 or indirectly resulting in a positive net CO2 conversion. The best system for the direct conversion of CO2 will be the one for which the net energy output with a H2–CO2 only feed matches most closely the net energy output with a H2–CO only feed, as for each system the latter case always gives the highest syngas conversion. In the absence and presence of performance optimisation, the best direct utilisation for CO2 is in the direct DME process. Thermodynamic calculations show that at equilibrium conversion the difference in energy efficiencies between H2–CO and H2–CO2 systems was 23.9% and 16.2%, respectively. The peak efficiencies and corresponding differences between H2–CO and H2–CO2 cases were substantially greater for the other three systems.
In terms of performance, the next best system to 1-step DME was the two-step DME synthesis with direct transfer of methanol and unreacted syngas to the DME reactor. System analysis yielded considerably better results than for an analogous system in which crude methanol was separated from the unreacted syngas and distilled before being dehydrated to DME before. The latter suffered from the efficiency of liquid methanol extraction from the flash column and the extra energy requirements for reheating and recompressing concentrated methanol before the DME reactor. However, we again note that this difference is not likely to be reflected in the kinetics, which will be superior when methanol is not diluted by water or unreacted syngas; water especially would shift the equilibrium in reaction (5) unfavourably towards methanol. Furthermore, the 2-step DME system with an interposed methanol isolation stage could potentially have a higher overall energy conversion efficiency as it liberates the greatest amount of heat from methanol/DME syntheses, as shown in Fig. 8S in the ESI,† which would contribute to energy savings upstream.
A comparison of MEP values between the direct DME process and the methanol process in the presence of their respective recycle loops is presented in Fig. 10. When these curves are compared with those of Fig. 6 where a recycle loop was not employed, it is clear that the act of recycling alters the H2![[thin space (1/6-em)]](https://www.rsc.org/images/entities/char_2009.gif) :
:![[thin space (1/6-em)]](https://www.rsc.org/images/entities/char_2009.gif) CO
CO![[thin space (1/6-em)]](https://www.rsc.org/images/entities/char_2009.gif) :
:![[thin space (1/6-em)]](https://www.rsc.org/images/entities/char_2009.gif) CO2 ratios relative to those in the system feed so as to inhibit system performance for the direct DME case. This is due to the formation and build-up of CO2via the water gas shift reaction between CO and the H2O that is formed during methanol dehydration. It is for this reason that such relatively high performance with H2–CO2 only feeds can be achieved. The large build-up of CO2 with a H2–CO feed in the direct DME process relative to the other systems is confirmed in Fig. 11, where the CO
CO2 ratios relative to those in the system feed so as to inhibit system performance for the direct DME case. This is due to the formation and build-up of CO2via the water gas shift reaction between CO and the H2O that is formed during methanol dehydration. It is for this reason that such relatively high performance with H2–CO2 only feeds can be achieved. The large build-up of CO2 with a H2–CO feed in the direct DME process relative to the other systems is confirmed in Fig. 11, where the CO![[thin space (1/6-em)]](https://www.rsc.org/images/entities/char_2009.gif) :
:![[thin space (1/6-em)]](https://www.rsc.org/images/entities/char_2009.gif) CO2 ratio in the recycle loop is in the range 0.6–25, despite the ratio being 260
CO2 ratio in the recycle loop is in the range 0.6–25, despite the ratio being 260![[thin space (1/6-em)]](https://www.rsc.org/images/entities/char_2009.gif) 000 in the system feed (we note that for a ‘H2
000 in the system feed (we note that for a ‘H2![[thin space (1/6-em)]](https://www.rsc.org/images/entities/char_2009.gif) :
:![[thin space (1/6-em)]](https://www.rsc.org/images/entities/char_2009.gif) CO-only’ system, a small molar fraction of CO2 was fed into the system together with CO in order to prevent excessive CO2 build-up). The differences in the ratios for the other systems are due to variances in the separation efficiencies of CO2 as gas in the flash column.
CO-only’ system, a small molar fraction of CO2 was fed into the system together with CO in order to prevent excessive CO2 build-up). The differences in the ratios for the other systems are due to variances in the separation efficiencies of CO2 as gas in the flash column.
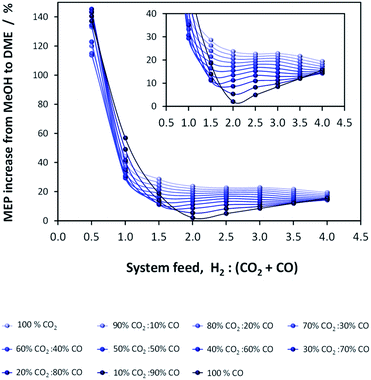 | ||
| Fig. 10 MEP increase of the direct DME process relative to methanol alone; calculations based on system outputs (post flash separation and distillation processes etc.). | ||
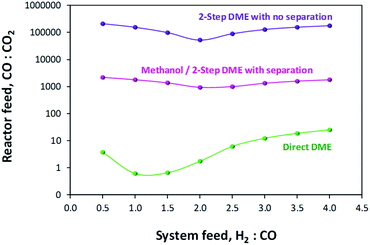 | ||
Fig. 11 CO![[thin space (1/6-em)]](https://www.rsc.org/images/entities/char_2009.gif) : :![[thin space (1/6-em)]](https://www.rsc.org/images/entities/char_2009.gif) CO2 ratios in the recycle loops for the methanol/DME synthesis systems, fed only with H2 and CO. CO2 ratios in the recycle loops for the methanol/DME synthesis systems, fed only with H2 and CO. | ||
In principle, all or part of the CO2 in the recycle loop can be removed simultaneously with DME using a scrubbing solvent, such as a mixture of methanol and DME.28 However, subsequently several stages to separate the DME from the CO2 and also to recycle the scrubbing solvent will be required. The CO2 will also need to be recycled upstream of the reactor in order not to be emitted to the atmosphere. Alternatively, the CO2 and DME could be condensed out of the gaseous mixture.29 However, the combined CO2/DME removal and separation process will certainly result in a substantial efficiency penalty.
CO2 emissions were computed for the methanol/DME synthesis systems and included contributions from: CO2 emitted directly in the vented gases, additional CO2 emitted in the vented gases as a result of complete CO combustion in the energy saving scheme, CO2 contained in the crude methanol streams from the flash columns and CO2 emitted to power the process components, where the energy requirements were not met by the combustion of vented CO and H2. Results are shown in Fig. 12 and demonstrate that, unlike in the single pass scenario, CO2 emissions are minimal in the direct DME synthesis system.
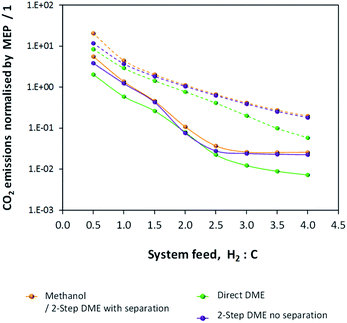 | ||
| Fig. 12 CO2 emissions normalised by the MEP for the methanol/DME production systems employing H2–CO only (solid lines) and H2–CO2 only (dashed lines) feeds. | ||
Fig. 12 shows that the presence of a recycle loop minimised the emissions of CO2, which would otherwise have been very significant in the direct DME synthesis system operating with CO. In fact, CO2 emissions were greater for all systems utilising H2–CO2 only feeds due to the lower product yields (relative to H2–CO feeds) and the greater amounts of energy required to run the systems and maintain large amounts of unreacted gases in the recycle loops.
In summary, according to thermodynamic equilibrium calculations and system analysis, when CO2 is utilised as the principal source of carbon, the highest net energy outputs were achieved with the direct DME synthesis system. This system also demonstrated the highest overall performance with CO, albeit the MEP is reduced significantly by the large build-up of CO2 in the recycle loop due the water gas shift reaction between CO and the water generated by in situ methanol dehydration. Performance with CO2 as the carbon source can theoretically be lower than the performance with CO by only 16.2%, provided energy saving strategies such as coupling of heat exchangers and the combustion of vented CO and H2 to generate thermal and electrical energies are employed. Hence, direct utilisation of CO2 is preferable in the direct DME system rather than in systems producing only methanol in the first stage. This system also achieves the highest degree of CO2 conversion.
Conversion of CO2 to CO upstream of the DME system that appears necessary for systems where methanol is produced in the first stage, would not be beneficial if the increase in the net energy yields are balanced or even outweighed by the energy requirements of this additional step. Upstream syngas production needs to be analysed with two points in mind. Firstly, based on the findings in this study, direct utilisation of CO2 requires at least 1.25 times more hydrogen in the system feed than when CO is used and this would result in additional penalties both in terms of energy requirement and CO2 emissions. Secondly, the heat liberated by reactions (1)–(3) and (5) in the methanol/DME reactors, and extracted in order to maintain isothermal conditions can be recovered and used to support upstream processes for generating H2 and CO from H2O and CO2. Fig. 8S in the ESI† shows the heats liberated in the methanol and DME synthesis reactors under consideration in this study. More heat is liberated by CO dehydration than by CO2 dehydration. Hence, again, the benefits of a H2–CO only syngas could potentially be reversed if the upstream processes for converting CO2 and H2O to CO and H2 require substantially greater energy inputs than energy recoverable from the downstream reaction heat.
Hence, the criterion for directing the decision of whether to use CO2 or CO (produced upstream from CO2) as the principal sources of carbon in the feed for methanol/DME syntheses is that the value of ‘net energy gain from using CO instead of CO2 in methanol/DME syntheses’ is greater than the ‘energy required to generate syngas of the required composition’, with account taken for heat recoverable from downstream exothermic processes. An additional criterion is that the CO2 liberated to support the running of the systems must be only a small fraction of the CO2 utilised. Naturally, the decision would also be dictated by availability of catalysts able to support direct CO2 conversion to methanol, although as evidenced from ref. 11–13 this can already be carried out at industrial scale.
Syngas production from CO2 and H2O
With decontaminated H2O and CO2 as the building blocks, syngas may be produced electrochemically and/or via the WGS/RWGS reactions (3) using a variety of means depicted in Fig. 13. Hydrogen may be generated by the reduction of water in an electrolyser via reaction (11). The most commonly used device on an industrial scale is an alkaline electrolyser, which is typically operated at elevated temperatures in the range 60–90 °C and can also be performed at pressures up to 700 bar. Usually these devices operate with an energy efficiency of up to 70% and a faradaic efficiency close to unity.| 2H2O + 2e− ⇄ H2 + 2OH− | (11) |
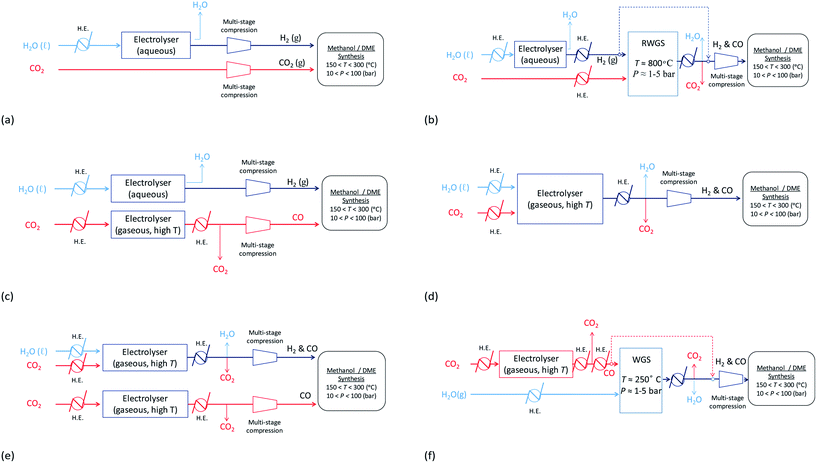 | ||
Fig. 13 Possible routes for the production of syngas, with varying ratios of H2![[thin space (1/6-em)]](https://www.rsc.org/images/entities/char_2009.gif) : :![[thin space (1/6-em)]](https://www.rsc.org/images/entities/char_2009.gif) C, from H2O and CO2. C, from H2O and CO2. | ||
A typical specific electrical energy consumption for alkaline water electrolysis at atmospheric pressure and at 75 °C without account of parasitic energy losses or gas losses is ca. 4.5 kW h Nm(H2)−3 ≈ 100 kW h kmol(H2)−1.35
Hydrogen produced by electrolysis may be utilised directly as shown in schemes (a)–(c) and (e) in Fig. 13 and/or reacted with CO2via the RWGS process shown in (b) to generate a mixture of CO, H2O, CO2 and H2, from which CO and H2 can then be isolated and fed into the methanol/DME reactors. Schemes (a), in which a CO2-based syngas is generated, and (b), in which a CO-based syngas is generated, are based on readily available technologies with well-characterised performance.
In an alternative scheme to (b), CO may be produced directly by CO2 reduction using a technology that is still currently in the research phase: solid oxide electrolysis.36 During the reduction reaction (12), CO2 is split into CO and oxide ions; the oxide ions migrate across a solid oxide electrolyte and become oxidised to oxygen gas. The net system reaction is shown in eqn (13). This process takes place at elevated temperatures (typically 500–800 °C), which are required to achieve a sufficient conductivity in the solid oxide electrolyte. CO produced in this way may be reacted directly with H2 to form methanol/DME etc., as shown in scheme (c) or reacted with water vapour via the WGS process to generate a mixture of H2, CO2, H2O and CO, as shown in scheme (f). Although this technology is still very much under development, CO2 electrolysis in solid oxide systems is already being carried out industrially, for example by Haldor Topose.37
| CO2 + 2e− ⇄ CO + O2− | (12) |
| 2CO2 ⇄ 2CO + O2 | (13) |
The specific electrical energy consumption for the production of CO via high temperature electrolysis of CO2 is reported to be of order 2.1 kW h kg(CO2)−1 (ref. 36) at 800 °C and 1 atm., corresponding to ≈92 kW h kmol(CO)−1.
High temperature CO2 electrolysis is reported to be more efficient if it is carried out simultaneously with the reduction of steam as per reaction (14), in a process termed co-electrolysis.38 This process has two principal advantages over the scheme in (13) firstly because CO2 reduction is aided by the RWGS process that takes place as H2 is formed and secondly because it suppresses the formation of solid carbon.
 | (14) |
The H2![[thin space (1/6-em)]](https://www.rsc.org/images/entities/char_2009.gif) :
:![[thin space (1/6-em)]](https://www.rsc.org/images/entities/char_2009.gif) CO ratio in the resultant syngas is controlled by the H2O
CO ratio in the resultant syngas is controlled by the H2O![[thin space (1/6-em)]](https://www.rsc.org/images/entities/char_2009.gif) :
:![[thin space (1/6-em)]](https://www.rsc.org/images/entities/char_2009.gif) CO2 ratio in the feed.39 For example, the specific electrical energy consumption for co-electrolysis at 800 °C and 1 atm. generating syngas with a molar ratio of H2
CO2 ratio in the feed.39 For example, the specific electrical energy consumption for co-electrolysis at 800 °C and 1 atm. generating syngas with a molar ratio of H2![[thin space (1/6-em)]](https://www.rsc.org/images/entities/char_2009.gif) :
:![[thin space (1/6-em)]](https://www.rsc.org/images/entities/char_2009.gif) CO = 2.0 is estimated at 3.2 kW h Nmsyngas−3. Co-electrolysis can be used as a standalone process to generate a H2–CO syngas as shown in scheme (d), or performed in parallel with CO2 electrolysis as in scheme (e) if the H2–CO ratio requires adjustment.
CO = 2.0 is estimated at 3.2 kW h Nmsyngas−3. Co-electrolysis can be used as a standalone process to generate a H2–CO syngas as shown in scheme (d), or performed in parallel with CO2 electrolysis as in scheme (e) if the H2–CO ratio requires adjustment.
The energy requirements of schemes (a)–(f) in Fig. 13 were evaluated based on the specific electrical energy consumptions for alkaline electrolysis (75 °C, 1 atm.), CO2 electrolysis (800 °C, 1 atm.) and CO2–H2O co-electrolysis (800 °C, 1 atm.) specified in ref. 35, 36 and 39, respectively, and simulations of the RWGS/WGS processes, as well as energy demands of heat exchangers and compressors relevant to each scheme, in Aspen Plus V8.8.
Stage 1 energy consumptions were used to determine the differences between normalised energies required to produce CO2-based syngas (scheme in Fig. 13a) with the optimum H2![[thin space (1/6-em)]](https://www.rsc.org/images/entities/char_2009.gif) :
:![[thin space (1/6-em)]](https://www.rsc.org/images/entities/char_2009.gif) CO2 ratio of 2.5 for both methanol and DME syntheses and CO-based syngas with H2
CO2 ratio of 2.5 for both methanol and DME syntheses and CO-based syngas with H2![[thin space (1/6-em)]](https://www.rsc.org/images/entities/char_2009.gif) :
:![[thin space (1/6-em)]](https://www.rsc.org/images/entities/char_2009.gif) CO ratios of 2 and 1 for methanol and direct DME processes, respectively (schemes (b)–(f)). These differences are shown in Fig. 14, where they are compared with the normalised energy gains in Stage 2 that were achieved when a CO-based rather than CO2-based syngas was used in the production of methanol (Fig. 14a) and DME by the direct process (Fig. 14b). Results show that in the case of methanol synthesis, the benefits of a CO-based feed in Stage 2 always outweigh any additional energy requirements in Stage 1, regardless of which syngas production scheme was employed. Furthermore, when schemes (c) and (e) were used to produce CO-based syngas, less energy was consumed than in the production of hydrogen in scheme (a). Scheme (e) appears to be the best for producing syngas with the correct ratios for both methanol and DME synthesis, although it should be noted that the specific electrical energy consumption used in assessment of schemes (d) and (e)39 was not determined experimentally, unlike in the other schemes. Hence, further validation may be necessary. In the case of DME production, scheme (b) generated the worst case scenario, which showed that losses in Stage 1 were greater than gains in Stage 2.
CO ratios of 2 and 1 for methanol and direct DME processes, respectively (schemes (b)–(f)). These differences are shown in Fig. 14, where they are compared with the normalised energy gains in Stage 2 that were achieved when a CO-based rather than CO2-based syngas was used in the production of methanol (Fig. 14a) and DME by the direct process (Fig. 14b). Results show that in the case of methanol synthesis, the benefits of a CO-based feed in Stage 2 always outweigh any additional energy requirements in Stage 1, regardless of which syngas production scheme was employed. Furthermore, when schemes (c) and (e) were used to produce CO-based syngas, less energy was consumed than in the production of hydrogen in scheme (a). Scheme (e) appears to be the best for producing syngas with the correct ratios for both methanol and DME synthesis, although it should be noted that the specific electrical energy consumption used in assessment of schemes (d) and (e)39 was not determined experimentally, unlike in the other schemes. Hence, further validation may be necessary. In the case of DME production, scheme (b) generated the worst case scenario, which showed that losses in Stage 1 were greater than gains in Stage 2.
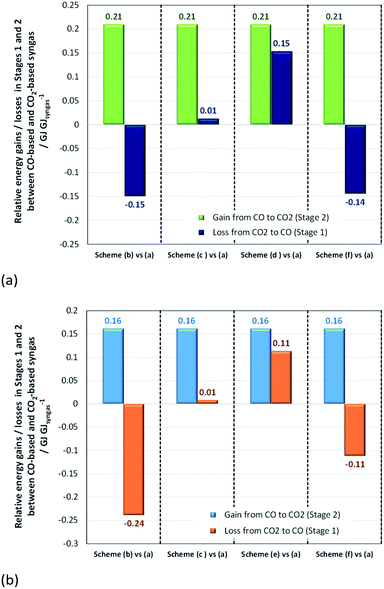 | ||
| Fig. 14 Relative normalised energy losses in Stage 1 and gains in Stage 2 when (a) methanol and (b) direct DME systems are operated with CO-based and CO2-based syngas. | ||
As well as energy consumption, the combined CO2 utilisation/emissions associated with Stages 1 and 2 are of critical importance in identifying the best system for CO2 conversion to fuels. The CO2 consumed (by conversion to CO) and liberated (to support process energy demands) was computed for each Stage 1 scheme in Fig. 13; the net differences were normalised against the energies contained in the final syngas products, as shown in eqn (15). This enabled the comparison of net CO2 consumption in Stage 1 (negative for schemes (b)–(f) and positive for scheme (a)) with CO2 emissions in Stage 2, evaluated using eqn (16).
 | (15) |
 | (16) |
When CO2 was converted to CO upstream of the methanol/DME reactors (schemes (b)–(f) in Fig. 13), net CO2 utilisation was achieved in Stage 1, whereas direct use of CO2 in the methanol/DME reactors (scheme (a)) resulted in net CO2 utilisation in Stage 2. Fig. 15 shows a comparison of the relative CO2 utilisation and emissions, both normalised by the energy contained in the syngas, in Stages 1 and 2 of systems producing methanol and DME via the direct process. The direct DME process was modelled to utilise CO2-based syngas directly (produced in scheme (a) in Fig. 13) with the optimum H2![[thin space (1/6-em)]](https://www.rsc.org/images/entities/char_2009.gif) :
:![[thin space (1/6-em)]](https://www.rsc.org/images/entities/char_2009.gif) CO2 ratio of 2.5 identified earlier and also CO-based syngas produced in schemes (b), (c), (e) and (f) with H2
CO2 ratio of 2.5 identified earlier and also CO-based syngas produced in schemes (b), (c), (e) and (f) with H2![[thin space (1/6-em)]](https://www.rsc.org/images/entities/char_2009.gif) :
:![[thin space (1/6-em)]](https://www.rsc.org/images/entities/char_2009.gif) CO = 1. Due to the poor performance of the methanol and 2-step DME systems with CO2 in the feed, the methanol system was modelled with a CO-based syngas only, using schemes (b), (c), (d) and (f) with H2
CO = 1. Due to the poor performance of the methanol and 2-step DME systems with CO2 in the feed, the methanol system was modelled with a CO-based syngas only, using schemes (b), (c), (d) and (f) with H2![[thin space (1/6-em)]](https://www.rsc.org/images/entities/char_2009.gif) :
:![[thin space (1/6-em)]](https://www.rsc.org/images/entities/char_2009.gif) CO = 2.
CO = 2.
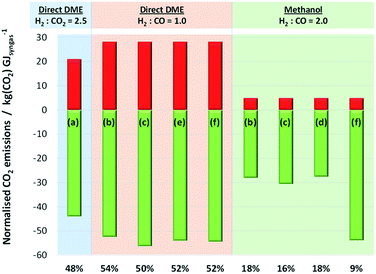 | ||
Fig. 15 Relative CO2 emissions and CO2 utilisation occurring in Stages 1 and 2 of systems for the production of methanol and direct DME. Negative CO2 emissions (green) represent net CO2 utilisation occurring in Stage 1 for schemes (b)–(f) in Fig. 13 and in Stage 2 for scheme (a). Conversely, positive CO2 emissions (red) represent CO2 liberated in Stage 2 for schemes (b)–(f) (due to WGS reaction) and in Stage 1 for scheme (a). Percentage values indicate the proportion of consumed CO2 that is re-emitted. Direct CO2 utilisation is modelled in the direct DME process, requiring syngas with H2![[thin space (1/6-em)]](https://www.rsc.org/images/entities/char_2009.gif) : :![[thin space (1/6-em)]](https://www.rsc.org/images/entities/char_2009.gif) CO2 = 2.5 produced in scheme (a). The remaining schemes convert CO2 to CO in Stage 1, generating syngas with H2 CO2 = 2.5 produced in scheme (a). The remaining schemes convert CO2 to CO in Stage 1, generating syngas with H2![[thin space (1/6-em)]](https://www.rsc.org/images/entities/char_2009.gif) : :![[thin space (1/6-em)]](https://www.rsc.org/images/entities/char_2009.gif) CO = 2 for methanol production and H2 CO = 2 for methanol production and H2![[thin space (1/6-em)]](https://www.rsc.org/images/entities/char_2009.gif) : :![[thin space (1/6-em)]](https://www.rsc.org/images/entities/char_2009.gif) CO = 1 for DME production via the direct process in Stage 2. CO = 1 for DME production via the direct process in Stage 2. | ||
The results presented in Fig. 15 show that while the production of syngas with H2![[thin space (1/6-em)]](https://www.rsc.org/images/entities/char_2009.gif) :
:![[thin space (1/6-em)]](https://www.rsc.org/images/entities/char_2009.gif) CO ratio of 1 in Stage 1, tailored for direct DME synthesis, leads to the highest CO2 utilisation, the benefits are offset substantially by the generation of CO2 by the water gas shift reaction in Stage 2. For all the schemes considered, it has been calculated that between 50–54% of CO2 consumed in Stage 1 is regenerated in Stage 2. The extent of CO2 regeneration is reduced to 48% if direct DME synthesis is performed with CO2 rather than CO, thereby confirming that direct utilisation of CO2 is possible and thermodynamically preferable with this process.
CO ratio of 1 in Stage 1, tailored for direct DME synthesis, leads to the highest CO2 utilisation, the benefits are offset substantially by the generation of CO2 by the water gas shift reaction in Stage 2. For all the schemes considered, it has been calculated that between 50–54% of CO2 consumed in Stage 1 is regenerated in Stage 2. The extent of CO2 regeneration is reduced to 48% if direct DME synthesis is performed with CO2 rather than CO, thereby confirming that direct utilisation of CO2 is possible and thermodynamically preferable with this process.
Results in Fig. 15 show unambiguously that if CO2 is converted to CO in Stage 1, then it is substantially better to use this CO for the production of methanol (or DME via the two-step routes) rather than DME via the direct route.
The conversion of CO2 to CO via high temperature electrolysis, followed by the WGS reaction with H2O (scheme (f) with H2![[thin space (1/6-em)]](https://www.rsc.org/images/entities/char_2009.gif) :
:![[thin space (1/6-em)]](https://www.rsc.org/images/entities/char_2009.gif) CO = 2 in the final syngas product) resulted in the highest degree of CO2 utilisation, with only 9% regenerated in Stage 2. The better performance of the system in scheme (f) is principally due to the exothermic nature of the WGS reaction which reduces the energy requirements in Stage 1. There was no significant difference between the performances of methanol systems with schemes (b), (c) or (d) in Stage 1. We note that additional energy requirements associated with cooling the WGS reactor have not been considered; these and other subordinate elements were beyond the scope of the present estimations. Nonetheless, Fig. 9S in the ESI† shows the energies released as heat (by exothermic reactions in Stage 2 processes such as WGS and by heat exchangers in Stage 1) relative to energy demands in Stage 1 for each scenario presented in Fig. 15; a fraction of the energy released as heat could be harnessed and used to decrease the energy consumption in Stage 1. However, conclusions based on the results in Fig. 15 are unlikely to be altered by these potential savings.
CO = 2 in the final syngas product) resulted in the highest degree of CO2 utilisation, with only 9% regenerated in Stage 2. The better performance of the system in scheme (f) is principally due to the exothermic nature of the WGS reaction which reduces the energy requirements in Stage 1. There was no significant difference between the performances of methanol systems with schemes (b), (c) or (d) in Stage 1. We note that additional energy requirements associated with cooling the WGS reactor have not been considered; these and other subordinate elements were beyond the scope of the present estimations. Nonetheless, Fig. 9S in the ESI† shows the energies released as heat (by exothermic reactions in Stage 2 processes such as WGS and by heat exchangers in Stage 1) relative to energy demands in Stage 1 for each scenario presented in Fig. 15; a fraction of the energy released as heat could be harnessed and used to decrease the energy consumption in Stage 1. However, conclusions based on the results in Fig. 15 are unlikely to be altered by these potential savings.
Based on results in Fig. 14 and 15 it can be concluded that in terms of energetic benefits and CO2 utilisation, methanol is best synthesised from CO-based syngas that is produced upstream using high temperature electrolysers or a combination of high temperature CO2 electrolysis coupled with a WGS system. On the other hand, the direct DME process can utilise CO2 directly; alternatively it can utilise syngas produced using the same methods as those identified for the case of methanol. In the cases of both methanol and direct DME syntheses, syngas production by a combination of an alkaline water electrolyser and a RWGS system yielded least favourable results.
In all cases, greater flexibility with the design of Stage 1 systems will be afforded when renewable sources of energy are available. For example, in the case of CRI,12,40 geothermal energy sources provide steam, which is used for generating electrical energy and for heating purposes. Alternatively solar energy could be used to generate electricity via photovoltaic devices, subject to location.
Although the supply of carbon dioxide is often seen as unlimited due to the vast quantities in which it is generated by industrial processes, its capture and purification are associated with significant energy demands and hence already at this initial stage, a fraction of the CO2 recovered is released into the atmosphere;41 this factor will ultimately be important in life cycle analyses on the methanol and DME synthesis systems that utilise CO2 as the sole source of carbon. However, in this study, the source of CO2 and the energy associated with its recovery and purification were not considered as it was not a factor affecting system comparisons; CO2 of similar purity is required, regardless of whether it is first converted to CO or fed into methanol/DME reactors directly. For example, to avoid problems associated with sulphur poisoning, the sulphur content in the syngas for the commonly employed Cu-based methanol/DME catalysts needs to be below circa 1 ppm (ref. 7) and, likewise, below circa 5 ppm for the nickel/iron/cobalt catalysts used typically in solid oxide electrolysers.42
Conclusions
The key question in this study was whether CO2 could be fed directly to methanol/DME synthesis systems or whether its upstream conversion to CO was necessary. Hence, system efficiencies and extents of CO2 conversion were examined in four methanol/DME synthesis systems as a function of hydrogen to total carbon molar ratios, H2![[thin space (1/6-em)]](https://www.rsc.org/images/entities/char_2009.gif) :
:![[thin space (1/6-em)]](https://www.rsc.org/images/entities/char_2009.gif) (CO2 + CO), as well as CO2
(CO2 + CO), as well as CO2![[thin space (1/6-em)]](https://www.rsc.org/images/entities/char_2009.gif) :
:![[thin space (1/6-em)]](https://www.rsc.org/images/entities/char_2009.gif) CO ratios, in the system feed. Recycle of unreacted CO2, as well as H2 and CO, was enabled to minimise CO2 emissions. Energy requirements for the operation of heat exchangers, compressors and distillation columns, as well as energy saving strategies such as the coupling of heat exchangers and also the utilisation of energy generated by combustion of vented gases, were included in system assessment. Highest system efficiencies for the methanol, direct DME and two-step DME synthesis systems were obtained at a non-stoichiometric H2
CO ratios, in the system feed. Recycle of unreacted CO2, as well as H2 and CO, was enabled to minimise CO2 emissions. Energy requirements for the operation of heat exchangers, compressors and distillation columns, as well as energy saving strategies such as the coupling of heat exchangers and also the utilisation of energy generated by combustion of vented gases, were included in system assessment. Highest system efficiencies for the methanol, direct DME and two-step DME synthesis systems were obtained at a non-stoichiometric H2![[thin space (1/6-em)]](https://www.rsc.org/images/entities/char_2009.gif) :
:![[thin space (1/6-em)]](https://www.rsc.org/images/entities/char_2009.gif) CO2 ratio of 2.5 in the system feeds in the absence of upstream CO generation. For CO-based syngas, the highest efficiencies for the methanol/two-step DME and direct DME synthesis systems were obtained at stoichiometric H2
CO2 ratio of 2.5 in the system feeds in the absence of upstream CO generation. For CO-based syngas, the highest efficiencies for the methanol/two-step DME and direct DME synthesis systems were obtained at stoichiometric H2![[thin space (1/6-em)]](https://www.rsc.org/images/entities/char_2009.gif) :
:![[thin space (1/6-em)]](https://www.rsc.org/images/entities/char_2009.gif) CO feed ratios of 2 and 1, respectively. Direct utilisation of CO2 required maximum energy savings.
CO feed ratios of 2 and 1, respectively. Direct utilisation of CO2 required maximum energy savings.
Taking account of energy requirements and CO2 emissions associated with the upstream syngas production stage, it was determined that CO2 could be utilised directly in the direct DME synthesis route, whereas upstream conversion of CO2 to CO was necessary to achieve significant yields and increased overall CO2 conversion with the methanol/two-step DME systems.
CO-based syngas production via high temperature co-electrolysis of H2O and CO2, or alternatively high temperature CO2 electrolysis coupled with the WGS process, were identified as the best technologies based on energy consumption and CO2 conversion.
Acknowledgements
The authors thank the UK Engineering and Physical Sciences Research Council (EPSRC) for the post-doctoral research associateship for AH (grant EP/K035274/1). As per EPSRC requirements, we have made our experimental data available via Zenodo.org. The link to the data is: http://https://zenodo.org/record/817412#.WUzky-vyvcs. It is also possible to access the data by entering the manuscript title into the search bar in http://www.zenodo.org.References
- A. Goeppert, M. Czaun, J. P. Jones, G. K. S. Prakash and G. A. Olah, Chem. Soc. Rev., 2014, 43, 7995 RSC.
- IPCC, IPCC Guidelines for National Greenhouse Gas Inventories, Prepared by the National Greenhouse Gas Inventories Programme, ed. H. S. Eggleston, L. Buendia, K. Miwa, T. Ngara and K. Tanabe, IGES, Japan, 2006 Search PubMed.
- EU, Roadmap for moving to a low-carbon economy in 2050, European Commission, Brussels, Belgium, 2011, Short version, http://eur-lex.europa.eu/legal-content/EN/ALL/?uri=CELEX:52011DC0112, accessed in 03/2017 Search PubMed.
- EU, Roadmap 2050: a practical guide to a prosperous, low-carbon Europe – Technical & economic analysis (full report), European Climate Foundation, 2010, http://www.roadmap2050.eu/reports, accessed in 03/2017 Search PubMed.
- G. A. Olah, A. Goeppert and G. K. S. Prakash, Beyond Oil and Gas: The Methanol Economy, Wiley-VCH, Weinheim, Germany, 2nd edn, 2009 Search PubMed.
- G. A. Olah, A. Goeppert and G. K. S. Prakash, J. Org. Chem., 2009, 74, 487 CrossRef CAS PubMed.
- P. L. Spath and D. C. Dayton, Preliminary screening – technical and economic assessment of synthesis gas to fuels and chemicals with emphasis on the potential for biomass-derived syngas, NREL/TP-510–34929, 2003 Search PubMed.
- A. de Klerk and E. Furimsky, Catalysis in the Refining of Fischer-Tropsch Syncrude, Chapter 2: Production of Synthesis Gas, Royal Society of Chemistry, 2010 Search PubMed.
- E. F. Sousa-Aguiar and L. Gorenstin Appel, Catalysis, 2011, 23, 284 CAS.
- Y. Ohno, et al., NKK Technical Review no. 85, 2001, pp. 23–28 CAS; Y. Ohno, Kagaku Keizai, 2004, 89–93 CAS.
- T. Matsushita, T. Haganuma and D. Fujita, US Pat., 2013/0237618 A1, 2013.
- http://carbonrecycling.is/, accessed in Dec 2016.
- A. M. Shulenberger, F. R. Jonsson, O. Ingolfsson and K.-C. Tran, US Pat., 2007/0244208 A1, 2007.
- Blue Fuel Energy, http://bluefuelenergy.com/, accessed in 01/2017.
- G. Jacobs and B. H. Davis, Catalysis, 2007, 20, 122 CAS.
- G. C. Chinchen, P. J. Denny, D. G. Parker, M. S. Spencer, K. C. Waugh and D. A. Whan, Appl. Catal., 1987, 30, 333–338 CrossRef CAS.
- C. Kuechen and U. Hoffmann, Chem. Eng. Sci., 1993, 48, 3767 CrossRef CAS.
- K. Klier, V. Chatikavanij, R. G. Herman and G. W. Simmons, J. Catal., 1982, 74, 343 CrossRef CAS.
- K. Law, J. Rosenfeld and M. Jackson, Methanol as a renewable energy resource – White paper, TIAX LLC, 2013, http://www.methanolfuels.org/wp-content/uploads/2013/05/MI-Renewable-Methanol-Pathways-White-Paper_final.pdf, accessed 03/2017 Search PubMed.
- L. Chen, Q. Jiang, Z. Song and D. Posarac, Chem. Eng. Technol., 2011, 34, 817 CrossRef CAS.
- Report: GHG emissions of Blue Fuel methanol production process, (S&T)2 Consultants Inc, 2010, http://www.methanolfuels.org/about-methanol/environment/, accessed in 03/2017 Search PubMed.
- J. Haid and U. Koss, Lurgi's Mega-Methanol technology opens the door for a new era in down-stream applications, Stud. Surf. Sci. Catal., 2001, 136, 399–404 CrossRef CAS.
- M. Cheiky and J. Hillier, US Pat., 8,835,517, 2014.
- J. Sun, G. Yang, Y. Yoneyama and N. Tsubaki, ACS Catal., 2014, 4, 3346 CrossRef CAS.
- X. D. Peng, B. A. Toseland and P. J. A. Tijm, Chem. Eng. Sci., 1999, 54, 2787 CrossRef CAS.
- Y. Ohno, M. Yoshida, T. Shikada, O. Inokoshi, T. Ogawa and N. Inoue, JFE Technical Report No. 8, 2006 Search PubMed.
- X. D. Peng, A. W. Wang, B. A. Toseland and P. J. A. Tijm, Ind. Eng. Chem. Res., 1999, 38, 4381 CrossRef CAS.
- X. D. Peng, B. W. Diamond, T. C. R. Tsao and B. L. Bhatt, US Pat., 6,458,856, 2002.
- T. Shikada, Y. Ohno, T. Ogawa, M. Mizuguchi, M. Ono and K. Fujimoto, US Pat., 6,147,125, 2000.
- J. M. Douglas, Conceptual design of chemical processes, McGraw-Hill, London, 1988 Search PubMed.
- T. Ogawa, N. Inoue, T. Shikada and Y. Ohno, J. Nat. Gas Chem., 2003, 12, 219 Search PubMed.
- W. M. Haynes, CRC Handbook of Chemistry and Physics, CRC press, Taylor & Francis Group, London, 93rd edn, 2012 Search PubMed.
- 2011 Guidelines to Defra/DECC’s GHG Conversion Factors for Company Reporting: Methodology Paper for Emission Factors, August 2011, http://www.defra.gov.uk.
- P. Patnaik, A Comprehensive Guide to the Hazardous Properties of Chemical Substances, Chapter 19: Gases, Common Toxic, and Flammable, John Wiley & Sons, Inc., 2007, pp. 402–409 Search PubMed.
- A. Roy, S. Watson and D. Infield, Int. J. Hyd. Eng., 2006, 31, 1964 CrossRef CAS.
- L. Kleiminger, T. Li, K. Li and G. H. Kelsall, RSC Adv., 2014, 4, 50003 RSC.
- Haldor Topsoe, http://www.topsoe.com/, accessed in 09/2016.
- L. Kleiminger, T. Li, K. Li and G. H. Kelsall, Electrochim. Acta, 2015, 179, 565 CrossRef CAS.
- Q. Fu, C. Mabilat, M. Zahid, A. Brisse and L. Gautier, Energy Environ. Sci., 2010, 3, 1382 CAS.
- G. A. Olah and G. K. S. Prakash, US Pat., 8,791,166, 2014.
- N. von der Assen, J. Jung and A. Bardow, Energy Environ. Sci., 2013, 6, 2721 CAS.
- J. Bøgild Hansen, Faraday Discuss., 2015, 182, 9 RSC.
Footnote |
| † Electronic supplementary information (ESI) available. See DOI: 10.1039/c7se00206h |
| This journal is © The Royal Society of Chemistry 2017 |

