Designing transition metal and nitrogen-codoped SrTiO3(001) perovskite surfaces as efficient photocatalysts for water splitting†
Yang
Yang‡
ab,
Weijie
Zheng‡
ab,
Daojian
Cheng
 *ab and
Dapeng
Cao
 *ab
*ab
aState Key Laboratory of Organic-Inorganic Composites, Beijing University of Chemical Technology, Beijing 100029, People's Republic of China. E-mail: chengdj@mail.buct.edu.cn; caodp@mail.buct.edu.cn
bBeijing Advanced Innovation Center for Soft Matter Science and Engineering, Beijing University of Chemical Technology, Beijing 100029, People's Republic of China
First published on 29th August 2017
Abstract
Development of an efficient photocatalyst with both strong visible light absorption and high charge mobility is highly desirable but still remains a great challenge. In this work, we use density functional theory (DFT) calculations to investigate the electronic structure and the surface activity of M-doped (M = transition metals V, Cr, Mn, Zr, Nb and Mo) and M–N-codoped (N = nitrogen) SrTiO3(001) perovskite surfaces in order to obtain the optimal photocatalytic material with both strong visible light absorption and high charge mobility. Results indicate that the N–Nb codoped SrTiO3(001) surface possesses not only a suitable band gap of 1.90 eV, but also desirable strong visible light absorption and high charge mobility. In addition, by exploring the adsorption and decomposition behavior of water on these modified surfaces, we found that the N–Nb codoped SrTiO3(001) surface not only has band alignments well positioned for the feasibility of photooxidation and photo-reduction of water, but also significantly reduces the activation energy of the water decomposition reaction. Therefore, the N–Nb codoped SrTiO3(001) surface designed here is a very promising candidate for water splitting in the visible light region, which provides a theoretical basis for designing new photocatalytic materials.
1. Introduction
Photocatalytic water splitting as an environmentally friendly technology to generate clean hydrogen energy has attracted wide interest from researchers all over the world.1–7 Since the photoelectron chemical water splitting was reported by Fujishima,8 photocatalytic materials have been widely investigated. The perovskite structure SrTiO3, as one of the good photocatalysts, has special properties including plenty of photocatalytic sites,9 high stability, nontoxicity,10 and, especially excellent charge mobility.11,12 Compared with the commonly used TiO2, SrTiO3 is more suitable for photocatalytic water splitting. First, its conduction band edge is 0.2 eV more positive than that of TiO2. Second, it shows better properties of charge mobility than TiO2. However, similar to other common photocatalytic semiconductors, the band gap (3.20 eV) of SrTiO3 (ref. 13) is still too large for water dissociation, which limits the efficient utilization of solar energy.While designing a high-efficient photocatalytic material for water splitting the following factors should be considered: (i) a bandgap around 2 eV so that it could absorb visible light which accounts for 43% of solar energy; (ii) good charge mobility and slower electron–hole recombination rate; (iii) lower reaction energy barrier making water splitting thermodynamically easier. Among a series of methods to narrow the band gap of semiconductors, such as elemental doping,14–19 structural modification,20 and semiconductor composite formation,21–25 elemental doping has been proved experimentally and theoretically to be a direct and effective way to reduce the band gap. For example, Konta et al.26 reported that the Rh (1%)-doped SrTiO3 photocatalyst loaded with a Pt cocatalyst (0.1 wt%) gave 5.2% quantum yield at 420 nm for the H2 evolution reaction. Chen et al.27 reported that Cr/Ta codoped SrTiO3 extended the absorption band of SrTiO3 to the visible light region at the wavelength of 540 nm. On the other hand, it has been found that doped SrTiO3 can achieve high electron mobility.11,28 The transition metal Nb-doped SrTiO3 exhibits significantly enhanced electron mobilities (exceeding 53![[thin space (1/6-em)]](https://www.rsc.org/images/entities/char_2009.gif) 000 cm2 V−1 s−1). In previous studies on elemental doping, transition metals like V, Cr, Mn, Zr, Nb and Mo and non-metals like N were the most popular choices of monodoping elements.29–31 However, transition metal doping could reduce the carrier mobility by the formation of strongly localized d states within the band gap. Moreover, the doped ions can act as recombination centers of the photo-generated charge carriers. On the other hand, doping non-metal ions extends the optical absorption edge of catalysts and therefore leads to a narrow band gap. Among various nonmetal dopants, nitrogen has been proved to be effective.32 However, N doping creates localized 2p states just above the valence band, which act as traps for photo-generated carriers and, thus, reduces the photo-generated current and limits the photocatalytic efficiency.33 In order to avoid these problems, codoping of a transition metal and a non-metal is a better choice for semiconductor materials.
000 cm2 V−1 s−1). In previous studies on elemental doping, transition metals like V, Cr, Mn, Zr, Nb and Mo and non-metals like N were the most popular choices of monodoping elements.29–31 However, transition metal doping could reduce the carrier mobility by the formation of strongly localized d states within the band gap. Moreover, the doped ions can act as recombination centers of the photo-generated charge carriers. On the other hand, doping non-metal ions extends the optical absorption edge of catalysts and therefore leads to a narrow band gap. Among various nonmetal dopants, nitrogen has been proved to be effective.32 However, N doping creates localized 2p states just above the valence band, which act as traps for photo-generated carriers and, thus, reduces the photo-generated current and limits the photocatalytic efficiency.33 In order to avoid these problems, codoping of a transition metal and a non-metal is a better choice for semiconductor materials.
In the previous theoretical research on photocatalytic materials, electronic structure was the most common focus, which has been studied widely and deeply. But if a material has a similar band gap for different doping ways, how to determine the one with better photocatalytic activity needs to be investigated. Actually, charge mobility and reaction energy barrier are two important factors, which can help us evaluate the effect of material modification comprehensively. In the application of water splitting, one of the most critical steps is cleavage of the O–H bond. The lower energy barrier for breaking the O–H bond makes water require less energy to decompose, which means a lower reaction energy barrier making water splitting (H − OH → H + OH) easier thermodynamically. However, it has been noticed that only few researchers have addressed reaction energy barrier for surface reactions like water splitting. Therefore, further studies on the adsorption and decomposition behaviors of water on modified surfaces are interesting and attractive.
In this work, we design SrTiO3(001) perovskite surfaces by doping with a series of transition metal atoms M (M = V, Cr, Mn, Zr, Nb and Mo) and nitrogen to obtain the optimal photocatalytic material with strong visible light absorption, high charge mobility, and also low activation energy of water decomposition reaction by density functional theory (DFT) calculations. We further investigate the surface properties of M monodoped and M–N codoped (M = V, Cr, Mn, Zr, Nb and Mo) SrTiO3(001) surfaces. The geometric and electronic structures, effective masses, and the adsorption and decomposition behaviors of water on the SrTiO3 surfaces are explored. Finally, some discussion about M-monodoped and M–N-codoped systems is also provided.
2. Calculation method and models
First-principles calculations based on the density functional theory (DFT) were carried out by using the Vienna Ab Initio Simulation Package (VASP 5.3.5)34,35 with the projector-augment-wave (PAW) method.36,37 The generalized gradient approximation (GGA) with the Perdew–Burke–Ernzerhof (PBE) functional38 was used to describe the exchange and correlation potentials. Full optimization of the cell parameters for the bulk SrTiO3 with a perovskite structure was carried out by using the 9 × 9 × 9 Monkhorst–Pack type k-point sampling. The cutoff energy for the plane wave basis set was fixed at 500 eV. The geometries were considered to be converged when the forces on each ion become 0.01 eV Å−1 or less. The calculated lattice parameters of a = b = c = 3.946 Å are consistent with the experimental values,39 and applied in the subsequent calculations of surfaces. For the simulation of surfaces, a cutoff energy of 500 eV and a k-point mesh of 5 × 5 × 1 generated by the Monkhorst–Pack scheme were applied for geometry structure optimization and calculations of electronic properties. The structural relaxations were performed until the residual forces were below 0.01 eV Å−1, and the resulting structures were applied in the subsequent calculations of surfaces. The models with a (2 × 2) periodicity of the supercell adopted in our calculations are shown in Fig. 1, which contains 8 layers (4 layers for –TiO2 and 4 layers for –SrO). The vacuum layer set to 15 Å was used in order to avoid the interaction between periodic slabs. The k-point sampling was set to 5 × 5 × 1 in the calculation of geometry optimization and in the computation of electronic properties. The upper 4 atomic layers were allowed to relax and the bottom 4 atomic layers were fixed to simulate the bulk system when structural relaxation was performed.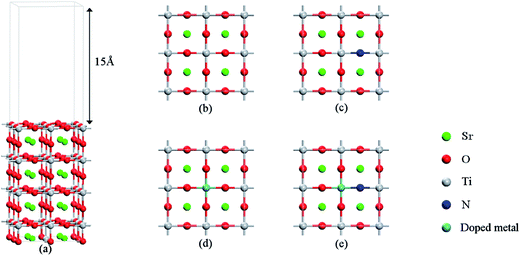 | ||
| Fig. 1 (a) Slab models of the SrTiO3(001) surface with 8 layers. (b) Undoped SrTiO3(001) surfaces, (c) N-doped SrTiO3(001) surfaces, (d) metal-monodoped surface, (e) metal–N-codoped surface. | ||
As shown in Fig. 1, a transition metal was substituted at the center site of the surface in the monodoped state and, additionally, N was substituted at the adjacent O site on SrTiO3(001) surfaces when it comes to the codoped state. The SrTiO3(001) slab contains 48 atoms. The doping ratio of the monodoping model with one impurity atom is 1.04%; the doping ratio of the codoping model with two impurity atoms is 2.08%. It is well-known that the standard DFT fails to provide the correct electronic structure for strongly correlated systems. Though the GW method40 is in agreement with experimental band structures in many cases for the calculations of semiconductors, the limitation is based on the large consumption of computing resources. However, the DFT+U method41 is also reasonable with relatively less computational cost and sufficient accuracy. So, we used the DFT+U method to describe the strong on-site Coulomb and exchange interactions, which can produce a better band gap in comparison with experimental results. The method for energy correction of the localized d electron can be expressed as42
 | (1) |
| Metal | Metal oxide | Band gap (experimental) | Band gap (calculated) | Ueff |
|---|---|---|---|---|
| Ti | TiO2 | 3.2 eV | 3.15 eV | 9.0 |
| V | V2O5 | 2.8 eV | 2.48 eV | 5.5 |
| Cr | Cr2O3 | 3.5 eV | 3.49 eV | 11.5 |
| Mn | MnO2 | 0.25 eV | 0.26 eV | 9.0 |
| Zr | ZrO2 | 3.4 eV | 3.38 eV | 10.5 |
| Nb | Nb2O5 | 5.0 eV | 4.95 eV | 9.5 |
| Mo | MoO3 | 3.8 eV | 3.76 eV | 11.5 |
In order to further understand the effect of surface doping on water dissociation, the climbing image nudged elastic band (CI-NEB) method44,45 was applied to study the reaction pathways and transition states with the energy barriers of water splitting. 8 images were linearly interpolated between the initial state (molecular adsorption state) and final state (dissociated adsorption state). A water molecule was placed on the top layer of a SrTiO3 slab with a vertical distance of 4 Å, which was considered as a separate state (SS). The molecular adsorption state was obtained from full optimization of separate states. The convergence criteria of structural optimizations were set as 0.02 eV Å−1. The decomposition of water (H2O → H + OH) produces one hydrogen atom and one hydroxyl radical. The dissociative adsorption state was obtained by optimizing the configuration of one hydrogen atom and one hydroxyl radical adsorbed on the modified surfaces. On the basis of the calculated adsorption energy of these states, we analyzed the reaction activity and energy for the decomposition reaction of water on the modified surfaces.
3. Results and discussion
3.1 Geometry structure and substitutional energy
According to the research by Guo et al.,46 N atoms tend to substitute the O atoms in the first layer on the TiO2-terminated SrTiO3(001) surfaces. Hence two main co-doped structures are considered: (i) the N atom replaces the O atom on the first layer and the doped metal atom replaces the Ti atom on the third layer (A); (ii) co-doped N and transition metals replace a Ti–O pair, forming the corresponding bond on the first layer (B). To explore the relative difficulty of doping and optimal growth conditions, the dopant formation energies (Ef) are considered, which were calculated by| E(doped)form = E(doped) − E(pure) − μN − μM + μO + μTi | (2) |
| μSr + μTi + 3μO = μSrTiO3(bulk) | (3) |
The chemical potentials of elements Sr, Ti and O cannot exceed the corresponding chemical potential in the bulk. Thus, one has μSr ≤ μSr(bulk), μTi ≤ μTi(bulk), and μO ≤ μO(gas). Under the O-rich limit, μO is calculated from the energy of an oxygen atom in the gaseous O2 molecule placed at the center of a 15 × 15 × 15 Å3 cubic box. Under the metal-rich limit, μSr and μTi are calculated from the energy of the respective atoms in their pure bulk metallic states, and μO is determined using eqn (3). The chemical potential μM is obtained from the energy calculated for one M atom in a cubic unit cell with a side length of 15 Å. The calculated formation energies in co-doped systems are summarized in Table 2. As listed in Table 2, the doping is energetically favored under metal-rich growth conditions when compared to O-rich growth conditions. The co-doping system with smaller formation energy indicated that it is the more probably occurring defective configuration in experiments, which verifies the preparation possibility in experiments, especially for (M, N)-codoped SrTiO3(001) surfaces (M = Mo, Nb, V, Zr). What's more, structure B has the lower formation energy, indicating the rationality of our current model.
| Codoping structures | Cr | Mn | Mo | Nb | V | Zr |
|---|---|---|---|---|---|---|
| E f (metal-rich) | ||||||
| A | 0.92 | 1.67 | −1.49 | −9.60 | −6.95 | −6.34 |
| B | 0.15 | 1.60 | −2.01 | −10.08 | −8.43 | −6.48 |
![[thin space (1/6-em)]](https://www.rsc.org/images/entities/char_2009.gif) |
||||||
| E f (O-rich) | ||||||
| A | 8.77 | 9.52 | 6.36 | −1.75 | 0.90 | 1.50 |
| B | 8.00 | 9.45 | 5.84 | −2.23 | −0.58 | 1.37 |
The optimized partial geometrical structures with bond length annotation for SrTiO3 are shown in Fig. 2. For all the metal monodoped systems, the difference between Ti–Ox (x = 1, 2, 3) bond lengths and M–Ox (M = metal, x = 1, 2, 3) bond lengths is shorter than 0.1 Å, which is about 5%. This indicates that the surface structure of SrTiO3 does not change basically in the transition metal monodoped state. Compared with the monodoped state, it can be found from Fig. 2 that there is an obvious structural change introduced by substitutional nitrogen on the first layer in the co-doped state. The larger distortion of the surface corresponds to the larger substitutional energy. For codoped systems, the angles of M–N–Ti are calculated to be 162–166°, which is different from the straight angle of M–O–Ti.
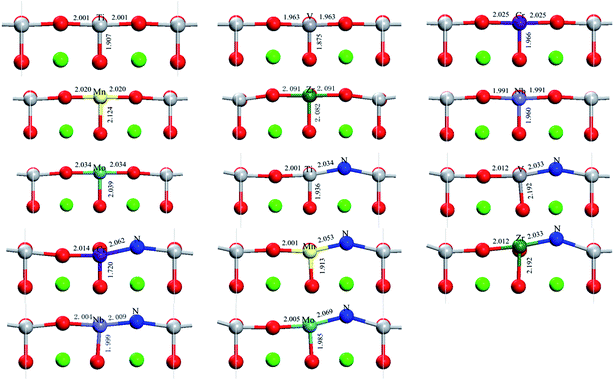 | ||
| Fig. 2 Optimized partial geometry structures of SrTiO3(001) surfaces including undoped, nitrogen-doped, metal-doped and nitrogen–metal codoped systems. | ||
To explore the relative stability of M-monodoped and (M, N)-codoped SrTiO3(001) surfaces, the substitutional energy for doping elements is described by the following equations:
| Es = Etot(M, O) − Etot(O) + ETi − EM | (4) |
| Es = Etot(N) − Etot(O) + EN − EO | (5) |
| Es = Etot(M, N) − Etot(N) + ETi − EM | (6) |
We can clearly see from Table 3 that the substitutional energies of V, Cr and Mn monodoping are much higher than that of codoping, while there is a slight difference between monodoping and codoping when it comes to Zr, Nb and Mo. The increase of substitutional energy for codoping is mostly due to the deformation introduced by nitrogen. In the monodoping state, the value of substitutional energy is negative for V, Mn, and Zr, indicating that they can be easily substituted into the Ti site in the center of the surface. In the case of the codoped system, Cr and Mn codoped with nitrogen on the SrTiO3(001) surface are not energetically favorable because their substitutional energies are about 5 eV. We can also find from Table 1 that the stabilization energy of ∼2 eV is required for V and Mo codoped with N, which is flexible in the experiments. Among these codoped systems, N–Zr is the most stable system because it has the lowest substitutional energy.
| V | Cr | Mn | Zr | Nb | Mo | N | |
|---|---|---|---|---|---|---|---|
| Monodoping | −1.46 | 1.77 | −2.34 | −1.94 | −1.94 | 1.91 | −2.28 |
| Codoping | 2.39 | 4.87 | 4.18 | −1.64 | −0.21 | 2.44 | — |
3.2 Electronic properties and band edge alignment
DFT+U calculations, which can correct the band gap, were performed to systematically investigate electronic properties. As shown in Fig. 3, the calculated band gaps are 3.04 and 2.45 eV for bulk SrTiO3 and SrTiO3(001) surface, respectively. These results are consistent with the previous experimental data in which the band gap is 3.20 eV for bulk SrTiO3 (ref. 10) and theoretical data in which the band gap is 2.56 eV for SrTiO3(001) surface.46 The band gap for the surface is remarkably narrower than the bulk value, which is caused by the formation of new surface states in the valence band maximum (VBM), which are primarily composed of surface O 2p states. By analysis of DOS, we can find that some Ti 3d states overlap within the O 2p states at the conduction band minimum (CBM) which highlights the covalent properties of the Ti–O bond. On the other hand, the Sr valence orbitals contribute very little to both the valence band and the conduction band, meaning that the Sr atoms only contribute to the construction of the perovskite structure but do not affect the electronic structure near the Fermi level, as shown in Fig. 3.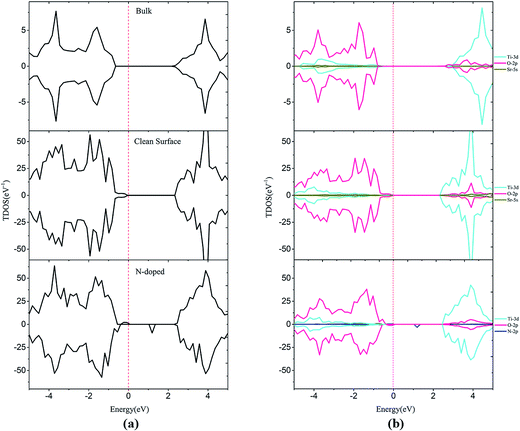 | ||
| Fig. 3 Total density of states (a) and projected density of states (b) for bulk, clean and N-doped SrTiO3(001) surfaces. The Fermi level is shown by the vertical dashed line. | ||
For the monodoped SrTiO3(001) surface (see Fig. 4 and 5), the projected density of states (PDOS) shows that the valence band (VB) is dominated by O 2p orbitals, which is similar to that of the undoped SrTiO3(001) surface. We find that doping of V, Cr or Mn introduces impurity levels located at the CBM or VBM in the forbidden band. However, monodoping of Zr, Nb or Mo does not introduce other impurity levels in the forbidden band.
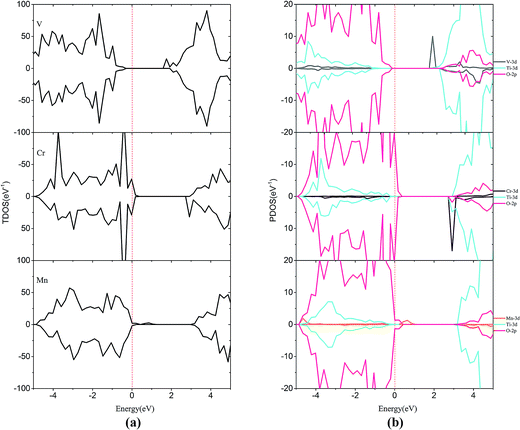 | ||
| Fig. 4 (a) Total density of states and (b) projected density of states for V-doped, Cr-doped, Mn-doped SrTiO3(001) surfaces. The Fermi level is shown by the vertical dashed line. | ||
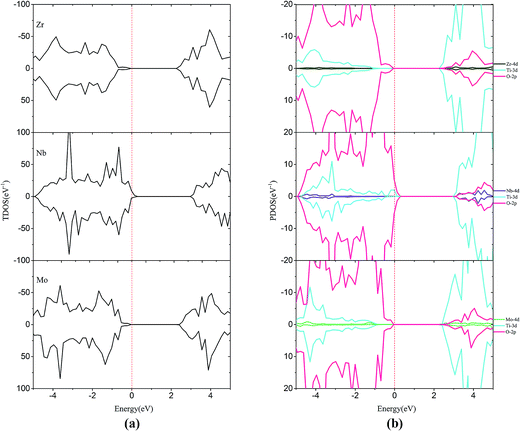 | ||
| Fig. 5 (a) Total density of states and (b) projected density of states for Zr-doped, Nb-doped and Mo-doped SrTiO3(001) surfaces. The Fermi level is shown by the vertical dashed line. | ||
When V is incorporated into the SrTiO3(001) surface, one more electron is released to the SrTiO3 surface, which induces some V 3d donor states appearing at +1.79 eV that is below the bottom of the conduction band. Meanwhile, the valence band moves downward by 0.16 eV and thus its band gap reduced to 1.95 eV. In the case of Cr doping, the CBM and VBM of Cr-doped SrTiO3 shift upwards by 0.30 and 0.46 eV, respectively. Therefore, the band gap of Cr doping is reduced to 2.31 eV. In the case of Mn doping, the introduction of Mn impurity increases the CBM and VBM by 0.85 and 0.33 eV, respectively. The band gap for Mn doping increases to 2.77 eV, indicating that Mn-doping is disadvantageous to improve the photocatalytic activity of the SrTiO3 slab. Similar to the case of V doping, Cr and Mn introduce some impurity states just below the conduction band (CB) and above the VB, respectively. This is due to the extra electron released from the valence shell of Cr (3d54s1) and Mn (3d54s2). By comparing the positions of VBM and CBM of V-doping, Cr-doping and Mn-doping, we find that the order of impact on VBM and CBM is V-doping < Cr-doping < Mn-doping. This is probably due to the variation in the interactions between the dopant 3d orbital and O 2p or Ti 3d orbitals. Accordingly, the order of orbital energy is Ti-3d < V-3d < Cr-3d < Mn-3d, corresponding to the above difference between the VBM and CBM. The impurity states appearing at the CBM or VBM would be the centers of electron–hole recombination and lower the photocatalytic activity.
For Zr-doping, the total density of states (TDOS) and PDOS of the Zr monodoped system are found to be almost similar to the case of the undoped SrTiO3 surface for Zr (4d25s2) valence shell that resembles Ti (3d24s2). The band gap is reduced to 2.34 eV after Zr substitution. For Nb-doping, the VBM has a small rise of 0.56 eV with respect to that of the clean surface, while the CBM has a small increase of 0.39 eV. The shifts of the VBM and CBM make the band gap of Nb-doping to be 2.69 eV. The Mo monodoped SrTiO3 system has no effect on the VBM, but the position of the CBM moves up a little due to the interaction between the Mo 4d orbital and Ti 3d orbital. The obtained band-gap width is equal to 2.54 eV which is slightly, i.e., 0.09 eV larger than that of the clean surface. Although from the point of band gap narrowing, monodoping of transition metals such as V seems to be attractive, the presence of partially occupied impurity states as well as the formation of charge compensating defects is the limiting factor for the improvement of the photocatalytic performance.
In order to passivate the donor states, configuration of M–N codoping to maintain charge balance is a common way to solve this problem. Here, the codoped systems are constructed by replacing one Ti and one O atom from the 2 × 2 slab with one M and N, respectively. The DOS plots for the (M, N)-codoped SrTiO3 have been shown in Fig. 6 and 7. Similar to monodoped systems, the CBM is mainly contributed by the Ti 3d state. For N–V codoping, the mid-states consisting of V-3d and N-2p appear in the forbidden band, which means V and N form the donor–acceptor pair. Although the band gap has been narrowed to 2.09 eV, N–V codoping is not suitable for water splitting, because mid-states would reduce the photocatalytic efficiency. Similar to the N–V codoped systems, the N–Mo codoped system has two mid-states in the forbidden band with the band gap of 1.85 eV, which are formed by one donor–acceptor pair and partially by Mo 4d states. For N–Cr, N–Zr, and N–Nb codoping, the presence of Cr (Zr or Nb) is found to be effective in passivating the N induced acceptor states completely, making its states remain below the Fermi states. The overlap of N 2p and Cr (Zr or Nb) 3d or 4d orbitals in the VB represents the covalent component in Cr (Zr or Nb)–N bonds. As shown in Fig. 6 and 7, some impurity states are localized in the middle of the band gap in N–V and N–Mo codoped systems, which are detrimental to photocatalysts because the gap states can act as the recombination centers to limit the efficiency of semiconductors. Therefore, it can be concluded that the donor–acceptor pairs play a crucial role in shifting the VBM and CBM, resulting in the observed change in the band gap of codoped SrTiO3.
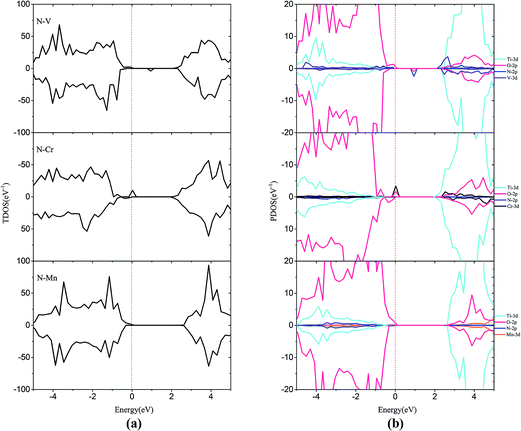 | ||
| Fig. 6 (a) Total density of states and (b) projected density of states for N–V codoped, N–Cr codoped, N–Mn codoped SrTiO3(001) surfaces. The Fermi level is shown by the vertical dashed line. | ||
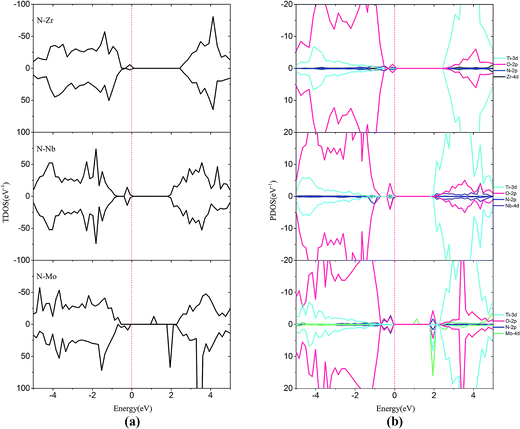 | ||
| Fig. 7 (a) Total density of states and (b) projected density of states for N–Zr codoped, N–Nb codoped and N–Mo codoped SrTiO3(001) surfaces. The Fermi level is shown by the vertical dashed line. | ||
Photocatalyst materials for water splitting require that the energy level of CBM should be more positive than the H+/H2 reduction potential, while the energy level of VBM should be more negative than the O2/H2O oxidation potential. As the band gap narrowing involves either elevation of the VBM or downward shifting of the CBM or both, it may affect the oxidizing–reducing efficiency of the material. Hence, it is necessary to check the band edge alignment of the modified material with respect to water redox levels before reaching a conclusion related to its photocatalytic water-splitting efficiency.
In our calculations, the band gap of the pure SrTiO3 surface is the energy level difference between the CBM and VBM. The calculation result is consistent with the previous experimental data.10 Therefore, the experimental band edge positions of the pure SrTiO3 surface are taken as the reference. As a result, the band edge positions of the doped SrTiO3 surfaces can be determined by calculating the relative energy shifts (CBM and VBM) with respect to the pure SrTiO3 surface. According to the experimental measurements,47 the rough conduction band edge potential of SrTiO3 is 1.26 V. Subsequently the valence band edge position is determined to be 2.14 V based on the calculated band gap of 3.20 eV. To assess the photocatalytic performance, we have aligned the CBM and VBM energy levels of doped SrTiO3(001) surfaces and the band edge positions of the doped SrTiO3 surfaces are determined by the energy levels of CBM and VBM. If the DOS of the dopant (such as M, N) is hybridized with the CBM or VBM of SrTiO3, the lowest or highest energy level of the DOS of the dopant is defined as the new CBM or VBM, respectively. The isolated DOS of the dopant does not affect the positions of CBM or VBM of SrTiO3.
Fig. 8 indicates that the band gap of the pure surface is 2.45 eV with the position of the VBM moving upwards compared with the bulk, which is not only in favor of the absorption of visible light but also helpful for improving the photo-oxidation ability. In the Cr and Mn monodoped cases, photo-oxidation abilities are reduced since the position of the VBM moves very closely towards the O2/H2O redox level. Meanwhile, the hydrogen producing capability of Cr-doping can be improved for the position of the CBM upshifted, which is in good agreement with the previous experimental results.14,27 For the V and Zr monodoped systems, the absorption edge moves from the UV to the visible light range. The position of the VBM was downshifted, leading to the enhancement of the photo-oxidation capacity. As for Nb and Mo monodoped surfaces, replacing Ti with Nb and Mo exerts no effect on the band-gap narrowing. Based on the band alignment of monodoped systems, the V-doped system has the smallest value of band gap with the best energy state position among these monodoped systems.
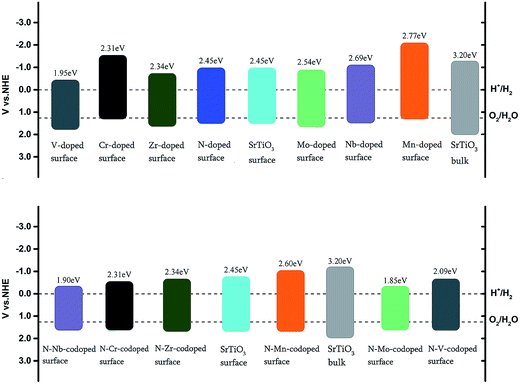 | ||
| Fig. 8 Band alignment of the undoped, nitrogen-doped, metal-doped and nitrogen–metal codoped SrTiO3(001) surfaces with respect to the water redox levels (H+/H2, O2/H2O). | ||
In the codoped cases, some impurity-pair states are localized in the middle of the band gap in N–V and N–Mo codoped systems, which are detrimental to photocatalysts because the mid-states can act as recombination centers to limit the efficiency of semiconductors. We can find that codoping with N–Zr is not able to bring noticeable change in the band gap, due to the fact that the valence electron structures are really similar for Zr and Ti elements. Both N–Cr and N–Nb codoped SrTiO3 are suitable for overall water splitting, with the band gap of 2.31 and 1.90 eV, respectively. These results show that, among these codoped configurations, N–Nb codoped SrTiO3 has the smallest value of band gap with the best position of band edge.
Finally, HSE calculations were also carried out to further confirm the calculated results of V monodoping and N–Nb codoping. The comparison of band gap values is shown in Table 4. It is noted that, owing to the reasonable determination method of U values, the band gap values calculated from DFT+U and HSE methods are almost the same. In particular, the band gaps of the V doped system calculated from DFT+U and HSE methods were 1.95 and 1.96 eV, respectively. The band gaps of the N–Nb codoped system calculated from DFT+U and HSE methods were 1.90 and 1.93 eV, respectively. As shown in Fig. S1,† for V monodoping, the positions of CBM and VBM calculated by the HSE method are in agreement with the results from DFT+U calculations. However, there is a slight difference in impurity state location between HSE and DFT+U calculations. For N–Nb codoping, the positions of CBM and VBM from HSE calculations are identical to the results from DFT+U calculations. Definitely, the band gaps for V monodoping and N–Nb codoping from HSE calculations are consistent with the DFT+U results. However, the DOS is very different. The optimum U values used in the DFT+U method are obtained by comparing the calculated band gaps with the experimental data. In the HSE hybrid functional, the exchange contribution is divided into short- and long-ranged parts and the short-ranged part of PBE exchange is weighted by 25% Hartree–Fock exchange. Therefore, the band gaps from DFT+U and HSE are in good agreement with each other, and the DOS is different. After verification by the HSE calculation, the V monodoped and N–Nb codoped SrTiO3 as candidate systems will be further investigated in the next part.
| DFT+U | HSE | |
|---|---|---|
| V-doped | 1.95 eV | 1.96 eV |
| N–Nb codoped | 1.90 eV | 1.93 eV |
3.3 Effective masses
As we know, the photocatalytic activity of a semiconductor significantly depends on the mobility of photogenerated charge carriers. The ability of charge carriers could be actively assessed from the effective masses of photoinduced electrons and holes.48 The effective mass has an inverse relationship with carrier mobility, which means that electrons and holes with smaller effective masses have higher mobility and can transport faster from the bulk to the surface. The schematic illustration of symmetry points G, M, Z on the SrTiO3(001) surface is shown in Fig. S2.† The effective masses of electrons and holes
  along the directions of G → M and G → Z located at the CBM and VBM are calculated by the following equation:
 | (7) |
| Hole | Electron | |||
|---|---|---|---|---|
| G → M | G → Z | G → M | G → Z | |
| TiO2(101) | 1.260 | 1.119 | 0.458 | 0.447 |
| Undoped | 0.916 | 0.895 | 0.242 | 0.239 |
| V-doped | 0.825 | 0.814 | 0.223 | 0.220 |
| N–Nb codoped | 0.823 | 0.816 | 0.226 | 0.211 |
3.4 Surface activity
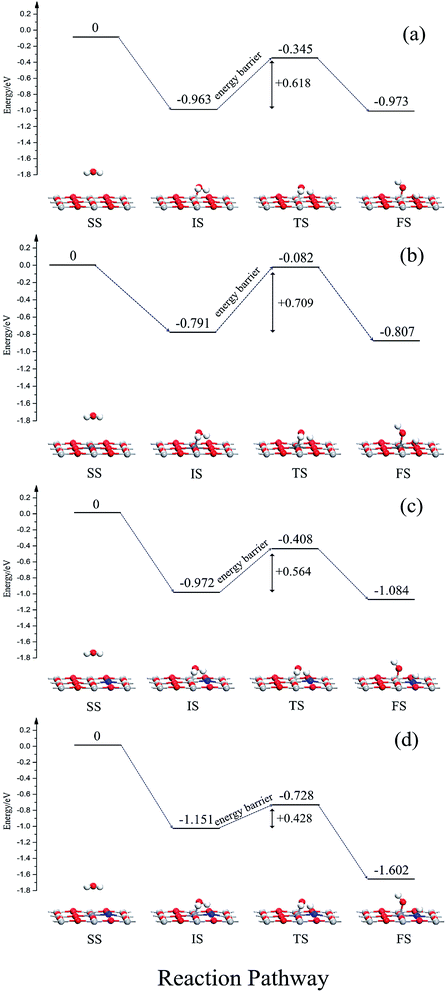
In order to further study the effects of monodoping and codoping on water decomposition, the adsorption and decomposition behaviors of water molecules on V-monodoped and N–Nb-codoped SrTiO3(001) surfaces were explored, because V monodoped and N–Nb codoped systems have the optimal band gaps among the doped systems studied here. For a comparison, the clean surface and N monodoped systems were also calculated. Fig. 9 illustrates the reaction pathway of H2O molecule on several kinds of SrTiO3(001) surfaces. First, we discuss the dissociation mechanism for H2O on a perfect SrTiO3(001) surface. In the separate state, H2O molecule is away from the SrTiO3(001) surface, and there is no obvious interaction between the H2O molecule and SrTiO3(001) surface. In the initial state, namely the adsorption state, the Ti atom is directly connected to the O atom of H2O. The adsorption energy is 0.963 eV and the plane of H2O molecule tilts to the SrTiO3(001) surface with an angle of 74.8°. In the transition state, water decomposition on the clean surface requires activation energy of 0.618 eV. In the dissociative adsorption state, the OH radical and H atom decomposed from the H2O molecule are absorbed on the top site of the Ti atom and O atom, respectively. The adsorption energy of the dissociative state is 0.973 eV, just 0.01 eV lower than that of the initial state. For V monodoped systems, the molecular adsorption site is the V site with the adsorption energy of 0.791 eV. And the molecular plane of water tilts to the surface with an angle of 79.3°. The corresponding dissociative adsorption state is the one wherein the product OH radical is adsorbed on the top layer of the V atom, and the product H atom is adsorbed on the hollow site near the bridged O atom. The adsorption energy of this state is 0.152 eV. Compared with the perfect surface, the molecular adsorption state is less stable because the molecular adsorption energy is lower than that of the corresponding state on the perfect surface. And the water molecule needs the reaction energy of 0.709 eV to decompose on the V-doped surface, which is a little greater than the reaction energy barrier on the perfect surface. These calculated results suggest that the presence of V impurity on the SrTiO3(001) surface is highly disadvantageous for the decomposition reaction of water. Then, we discuss the N-doped systems from the initial molecular adsorption state; water molecules only need lower activation energy of 0.564 eV to accomplish the decomposition reaction, while the reverse reaction activation energy is 0.676 eV. These data imply that the dissociative state is the favorable state for water on the N-doped surface, and N doping could effectively change the decomposition reaction pathway of water. In the case of the N–Nb codoped surface, the adsorption configurations of water on the N–Nb codoped surface are very similar to the adsorption configurations of water on the perfect surface. For this state, the adsorption energy is 1.151 eV, and the molecular plane of water tilts to the surface with an angle of 76.7°. The decomposition product OH radical is adsorbed at the top site of Nb atom, and the other decomposition product H atom is adsorbed at the top site of N atom. From the initial molecular adsorption state, the water molecule requires activation energy of 0.423 eV to decompose, and the activation energy of its reverse reaction is 0.874 eV. The molecular adsorption energy increases and the activation energy decreases. These calculated results show that the N–V codoped SrTiO3(001) surface is relatively suitable for photocatalytic water splitting. To reveal the mechanism of the surface activity, the Bader charge analysis was performed here. The charge of the O atom and N impurity is calculated to be −0.04e and −1.22e, respectively. N impurity is in the state of an unsaturated valence shell, resulting in high attraction of the H atom isolated from the water molecule. This can well explain that the active energy for water splitting is reduced when nitrogen impurity is doped on the surface. From the above discussion, we can know that (i) the order of the reaction energy barrier is N–Nb codoping < N monodoping < clean surface < V monodoping, meaning that water splitting occurs most favorably on the N–Nb codoped surface; (ii) the order of dissociative adsorption energy is N–Nb codoping < N monodoping < clean surface < V monodoping, making decomposition products (H atom and OH radical) have the longest resident time to further react with holes and electrons on the N–Nb codoping surface among these systems. Based on these results, we can believe that the N–Nb codoped system displays the best performance in surface reaction activity for water splitting, compared with other doped systems discussed here.4. Conclusions
We have systematically investigated the effects of M-monodoping (M = V, Cr, Mn, Zr, Nb and Mo) and M–nitrogen codoping on the surface structure, the electronic structure and the surface activity of the SrTiO3(001) perovskite surface by using density functional theory plus U (DFT+U) calculations. The results indicate that doping transition metals into the SrTiO3(001) surface is effective in creating visible light response by shifting CB and VB energy states, which can significantly narrow the energy gap. However, these new dopant associated states may reduce the driving forces of the oxidation reaction, like Cr-doping and Mn-doping, and may serve as charge recombination centers. In the present monodoping studies, V-doping shows the best photocatalytic performance because its band edge alignment is highly suited for water splitting, while in aspects of charge ability and energy barrier for water decomposition, its performance is not as well as the N–Nb codoping as mentioned below.Codoping a M–N pair into the SrTiO3(001) surface can significantly decrease the band gap by lowering the VBM as well as forming impurity energy levels in the band gap, like N–V codoping and N–Mo codoping. Results show that N–Nb codoping can definitely enhance the photocatalytic performance owing to the reduction of band gap and energy barrier of water decomposition. In addition, we also further calculated and compared the adsorption and decomposition of water on different modified surfaces. On these modified surfaces, the stable adsorption configurations of water are very similar to that of water on the perfect surface. N doping not only makes the molecular adsorption state more stable, but also reduces the activation energy of water decomposition reaction. So, it is beneficial for water decomposition on the modified surface. In contrast, V doping is disadvantageous for water decomposition on the V-doped surface. Interestingly, the N–Nb codoping not only significantly broadens the absorption spectrum of the modified surface in the visible-light region, but also greatly reduces the activation energy of the water decomposition reaction. In short, this work indicates that N–Nb codoping modification is very promising for water splitting in the visible light region, which provides a useful guidance for the design of photocatalytic materials.
Conflicts of interest
There are no conflicts to declare.Acknowledgements
This work is supported by the National Science Fund for Distinguished Young Scholars (No. 21625601) and the Major Project of NSF of China (No. 91334203) and Outstanding Talent Fund from BUCT.References
- M. Niu, D. Cheng and D. Cao, Sci. Rep., 2014, 4, 4810 CrossRef CAS PubMed
.
- P. Liao, J. A. Keith and E. A. Carter, J. Am. Chem. Soc., 2012, 134, 13296–13309 CrossRef CAS PubMed
.
- J. Ran, J. Zhang, J. Yu, M. Jaroniec and S. Z. Qiao, Chem. Soc. Rev., 2014, 43, 7787–7812 RSC
.
- X. Chen, S. Shen, L. Guo and S. S. Mao, Chem. Rev., 2010, 110, 6503–6570 CrossRef CAS PubMed
.
- Z. Li, W. Luo, M. Zhang, J. Feng and Z. Zou, Energy Environ. Sci., 2013, 6, 347–370 CAS
.
- T. Tachikawa and T. Majima, Chem. Soc. Rev., 2010, 39, 4802–4819 RSC
.
- H. Tada, T. Kiyonaga and S. I. Naya, Chem. Soc. Rev., 2009, 38, 1849–1858 RSC
.
- A. Fujishima and K. Honda, Nature, 1972, 238, 37–38 CrossRef CAS PubMed
.
- W. N. Zhao and Z. P. Liu, Chem. Sci., 2014, 5, 2256–2264 RSC
.
- M. Cardona, Phys. Rev., 1965, 140, 651–655 CrossRef CAS
.
- A. B. Eyvazov, I. H. Inoue, P. Stoliar, M. J. Rozenberg and C. Panagopoulos, Sci. Rep., 2013, 3, 1721 CrossRef
.
- J. Son, P. Moetakef, B. Jalan, O. Bierwagen, N. J. Wright, R. Engelherbert and S. Stemmer, Nat. Mater., 2010, 9, 482–484 CrossRef CAS PubMed
.
- M. Takizawa, K. Maekawa, H. Wadati, T. Yoshida, A. Fujimori, H. Kumigashira and M. Oshima, Phys. Rev. B, 2009, 79, 113103 CrossRef
.
- D. Wang, J. Ye, T. Kako and T. Kimura, J. Phys. Chem. B, 2006, 110, 15824–15830 CrossRef CAS PubMed
.
- P. Reunchan, N. Umezawa, S. Ouyang and J. Ye, Phys. Chem. Chem. Phys., 2012, 14, 1876–1880 RSC
.
- H. Yu, S. Ouyang, S. Yan, Z. Li, T. Yu and Z. Zou, J. Mater. Chem., 2011, 21, 11347–11351 RSC
.
- S. Kawasaki, R. Takahashi, K. Akagi, J. Yoshinobu, F. Komori, K. Horiba, H. Kumigashira, K. Iwashina, A. Kudo and M. Lippmaa, J. Phys. Chem. C, 2014, 118, 20222–20228 CAS
.
- R. B. Comes, P. V. Sushko, S. M. Heald, R. J. Colby, M. E. Bowden and S. A. Chambers, Chem. Mater., 2014, 26, 7073–7082 CrossRef CAS
.
- M. Niu, R. Cui, H. Wu, D. Cheng and D. Cao, J. Phys. Chem. C, 2015, 119, 13425–13432 CAS
.
- M. Niu, H. Tan, D. Cheng, Z. Sun and D. Cao, J. Chem. Phys., 2015, 143, 054701 CrossRef PubMed
.
- H. Yu, Y. Zhao, C. Zhou, L. Shang, Y. Peng, Y. Cao, L. Z. Wu, C. H. Tung and T. Zhang, J. Mater. Chem. A, 2014, 2, 3344–3351 CAS
.
- Q. Huang, S. Tian, D. Zeng, X. Wang, W. Song, Y. Li, W. Xiao and C. Xie, ACS Catal., 2013, 3, 1477–1485 CrossRef CAS
.
- L. Xu, W. Q. Huang, L. L. Wang, Z. A. Tian, W. Hu, Y. Ma, X. Wang, A. Pan and G. F. Huang, Chem. Mater., 2015, 27, 1612–1621 CrossRef CAS
.
- S. Kumar, S. Tonda, A. Baruah, B. Kumar and V. Shanker, Dalton Trans., 2014, 43, 16105–16114 RSC
.
- M. Niu, D. Cheng and D. Cao, J. Phys. Chem. C, 2014, 118, 5954–5960 CAS
.
- R. Konta, T. Ishii, H. Kato and A. Kudo, ChemInform, 2004, 35, 8992–8995 CrossRef
.
- W. Chen, H. Liu, X. Li, S. Liu, L. Gao, L. Mao, Z. Fan, W. Shangguan, W. Fang and Y. Liu, Appl. Catal., B, 2016, 192, 145–151 CrossRef CAS
.
- S. Kobayashi, Y. Mizumukai, T. Ohnishi, N. Shibata, Y. Ikuhara and T. Yamamoto, ACS Nano, 2015, 9, 10769–10777 CrossRef CAS PubMed
.
- B. Modak, K. Srinivasu and S. K. Ghosh, Phys. Chem. Chem. Phys., 2014, 16, 24527–24535 RSC
.
- S. Chang and W. Liu, Appl. Catal., B, 2011, 101, 333–342 CrossRef CAS
.
- W. Li, C. F. Walther, A. Kuc and T. Heine, J. Chem. Theory Comput., 2013, 9, 2950–2958 CrossRef CAS PubMed
.
- R. Asahi, T. Morikawa, T. Ohwaki, K. Aoki and Y. Taga, Science, 2001, 293, 269–271 CrossRef CAS PubMed
.
- X. Chen and C. Burda, J. Am. Chem. Soc., 2008, 130, 5018–5019 CrossRef CAS PubMed
.
- G. Kresse and J. Furthmuller, Phys. Rev. B, 1996, 54, 11169 CrossRef CAS
.
- G. Kresse and J. Hafner, Phys. Rev. B, 1994, 49, 14251 CrossRef CAS
.
- G. Kresse and D. Joubert, Phys. Rev. B, 1999, 59, 1758–1775 CrossRef CAS
.
- P. E. Blöchl, Phys. Rev. B, 1994, 50, 17953 CrossRef
.
- B. Hammer, L. B. Hansen and J. K. Nørskov, Phys. Rev. B, 1999, 59, 7413 CrossRef
.
- A. Ohtomo, D. A. Muller, J. L. Grazul and H. Y. Hwang, Nature, 2002, 419, 378–380 CrossRef CAS PubMed
.
- D. R. Hamann and D. Vanderbilt, Phys. Rev. B, 2009, 79, 045109 CrossRef
.
- S. L. Dudarev, G. A. Botton, S. Y. Savrasov, C. J. Humphreys and A. P. Sutton, Phys. Rev. B, 1998, 57, 1505–1509 CrossRef CAS
.
- Q. Meng, T. Wang, E. Liu, X. Ma, Q. Ge and J. Gong, Phys. Chem. Chem. Phys., 2013, 15, 9549–9561 RSC
.
- J. C. Wu, J. Zheng, P. Wu and R. Xu, J. Phys. Chem. C, 2011, 115, 5675–5682 CAS
.
- G. Henkelman, B. P. Uberuaga and H. Jónsson, J. Chem. Phys., 2000, 113, 9901–9904 CrossRef CAS
.
- G. Henkelman and H. Jónsson, J. Chem. Phys., 2000, 113, 9978–9985 CrossRef CAS
.
- Y. Guo, X. Qiu, H. Dong and X. Zhou, Phys. Chem. Chem. Phys., 2015, 17, 21611–21621 RSC
.
- Y. Xu, Am. Mineral., 2000, 85, 543–556 CrossRef CAS
.
- M. A. Green, J. Appl. Phys., 1990, 67, 2944–2954 CrossRef CAS
.
Footnotes |
| † Electronic supplementary information (ESI) available. See DOI: 10.1039/c7se00219j |
| ‡ Equally contributed to this work. |
| This journal is © The Royal Society of Chemistry 2017 |

