 Open Access Article
Creative Commons Attribution 3.0 Unported Licence
Exploring effects of intermittent light upon visible light promoted water oxidations†
Dominic
Walsh
 *a,
Pascaline
Patureau
a,
Karen
Robertson
a,
Shaun
Reeksting
b,
Anneke
Lubben
b,
Salvador
Eslava
 c and
Mark T.
Weller
a
aDepartment of Chemistry, University of Bath, Bath, BA2 7AY, UK. E-mail: d.walsh2@bath.ac.uk
bChemical Characterization and Analysis Facility, University of Bath, Bath, BA2 7AY, UK
cDepartment of Chemical Engineering, University of Bath, BA2 7AY, UK
First published on 26th September 2017
Abstract
Visible light promoted photocatalytic water oxidations for potential solar fuel production have been studied widely, with many reports on optimization of reagent components. Here we report an exploration on the effects upon ongoing reactions of daylight equivalent light intensity illumination with regulated short dark periods of a few seconds duration as compared to standard continuous illumination. Comparison was made with systems employing synthesized low cost earth abundant iron oxide, calciumoxomanganite and cobalt oxide nanoparticulate catalysts together with a [Ru(bpy)3]2+ light harvesting dye and an electron acceptor. Yields of gaseous O2 and proton production were measured in situ and in real time. The study found that low cost catalysts could give very significantly increased O2 yields, turn over frequency and improved reaction profiles by use of simple on/off illumination. A range of timings with identical overall photon flux were tested and an optimum determined. Analysis of effects upon the light sensitizer under the range of lighting conditions (through mass spectrometry and UV-vis measurements), together with implementation of a continuous flow system as comparison to the batch reactions, were all employed to help elucidate the mechanisms for the clear improvements in reaction yields observed. These are believed to stem from reduction in self-decomposition of excess oxidized sensitizer and better synchronization of cyclic sensitizer oxidation/reductions with water oxidation at the metal oxide surface at specific light on![[thin space (1/6-em)]](https://www.rsc.org/images/entities/char_2009.gif) :
:![[thin space (1/6-em)]](https://www.rsc.org/images/entities/char_2009.gif) off timing.
off timing.
Introduction
In tandem with solar photovoltaics, the capture and storage of energy in the form of convenient, inexpensive liquid fuels is an essential goal but remains technically challenging. The design of solar-fuel generation systems with the required efficiency, scalability, and sustainability to be economically viable has clear benefits. Artificial photosynthesis utilizing processes that are akin to photosystem II (PSII) water oxidation linked with development of photosystem I (PSI)-like systems with the necessary adaptions for solely liquid fuel production is a vital technological aim for generation of liquid solar fuels.1–3Water oxidation typically utilizes the photocycling light absorbing dye [Ru(bpy)3]2+. The metal-to-ligand charge-transfer (MLCT) visible absorption region of the [Ru(bpy)3]2+ light sensitizer is at ∼410–510 nm (λmax 454 nm) (Fig. 1 inset). Hence for this light dependant component of the cyclic reaction, shorter wavelength visible light is effective in promotion of ruthenium d orbital electrons onto orbitals associated with a bipyridine ligand to give an excited state Ru(bpy)32+* (with relatively long lifetime of ∼0.65 μS in N2 degassed aqueous solution).4 An electron acceptor ((Co(NH3)5Cl)Cl2) quenches the excited state [Ru(bpy)3]2+*, giving [Ru(bpy)3]3+.5 Somewhat akin to natural photosynthesis, light independent steps then occur in which an electron donated from a metal oxide catalyst restores the stable [Ru(bpy)3]2+ state, and absorbed water is subsequently oxidized on the metal oxide surface with the release of O2 and protons. This catalysed oxidation is reported to be the rate limiting step for final generation of gaseous oxygen.6,7 In total, four photons generate four protons and one O2 molecule.5,8,9
| 2H2O + 4hν → O2↑ + 4H+ (to buffer) + 4e− (to Ru3+/e− acceptor) |
Previously, we have investigated the effect of catalyst composition and a range of daylight equivalent light intensities at constant levels over a reaction lifetime.10 Recently we reported an observation that indicated constant illumination of fluctuating intensity could alter yields and turn over frequency (TOF) significantly.11 In this article we have significantly developed on this underexplored theme. A range of earth abundant and low cost metal oxide catalysts were compared, including a commercial nanoparticulate Co3O4 as a known high performing catalyst.12 The system employed a LED light source controlled with a high accuracy electronic on/off timer. Initially a wide range of timings were used to locate an optimal zone for improved activity, further refinements then pinpointed the optimal timing for maximum efficiency.
Mass spectrometry (MS) and UV-vis spectroscopy analysis were used to determine relative levels of light sensitizer decomposition and to elucidate mechanisms for the improved efficiencies. In comparison to reactions under constant illumination, an approximate doubling of gaseous O2, proton yield and measured TOF was obtained when optimized timing was used for reactions that were otherwise identical.
Experimental
Preparation of metal oxide catalysts
Nanoparticulate iron oxide (α-Fe2O3-hematite/γ-Fe2O3 maghemite) and calcium oxomanganite (CaMn3O6) were prepared as previously reported.11,13 Details of the synthesis are given in the ESI.† Comparison also included use of a commercial nanoparticulate Co3O4 (Sigma-Aldrich 637025, measured SBET = 35.8 m2 g−1).Characterization
![[thin space (1/6-em)]](https://www.rsc.org/images/entities/char_2009.gif) :
:![[thin space (1/6-em)]](https://www.rsc.org/images/entities/char_2009.gif) 50 water
50 water![[thin space (1/6-em)]](https://www.rsc.org/images/entities/char_2009.gif) :
:![[thin space (1/6-em)]](https://www.rsc.org/images/entities/char_2009.gif) isopropanol with 2% formic acid. The observed mass and isotope pattern matched the corresponding theoretical values as calculated from the expected elemental formula within 2 ppm mass accuracy. Data processing was performed using the Compass Data Analysis software version 4.3 (Bruker Daltonik GmbH, Bremen, Germany).
isopropanol with 2% formic acid. The observed mass and isotope pattern matched the corresponding theoretical values as calculated from the expected elemental formula within 2 ppm mass accuracy. Data processing was performed using the Compass Data Analysis software version 4.3 (Bruker Daltonik GmbH, Bremen, Germany).
A 3 W LED was utilized as light source, placed at distance from the side of the flask such that a measured emission of 5 mW cm−2 intensity of blue light (λmax 448 nm) reached the outer flask surface adjacent to the stirred reaction mixture. A constant DC voltage/amp supply coupled with a timer module (accurate to ±0.005 s) was used to control LED illumination on![[thin space (1/6-em)]](https://www.rsc.org/images/entities/char_2009.gif) :
:![[thin space (1/6-em)]](https://www.rsc.org/images/entities/char_2009.gif) off periods. In situ real-time measurement of gaseous O2 released into the flask headspace was conducted using an accurate optical sensor system. Increase in O2 ppm into the known headspace volume was used to calculate μmolO2 generated. A pH probe placed within the stirred reaction mixture recorded pH change.10,15 Efforts were made to ensure high consistency between reaction measurements, which were made in triplicate. Yield and profiles for repeat experiments were consistent and representative profiles shown. Collection of samples and dilutions in methanol for MS analysis are detailed in the ESI Experimental section.†
off periods. In situ real-time measurement of gaseous O2 released into the flask headspace was conducted using an accurate optical sensor system. Increase in O2 ppm into the known headspace volume was used to calculate μmolO2 generated. A pH probe placed within the stirred reaction mixture recorded pH change.10,15 Efforts were made to ensure high consistency between reaction measurements, which were made in triplicate. Yield and profiles for repeat experiments were consistent and representative profiles shown. Collection of samples and dilutions in methanol for MS analysis are detailed in the ESI Experimental section.†
Results and discussion
Intermittent light reactions with Fe2O3 as catalyst
Initial experiments employed a simple α/γ-Fe2O3 as catalyst in the reaction mixture to locate the optimal zone and period of on![[thin space (1/6-em)]](https://www.rsc.org/images/entities/char_2009.gif) :
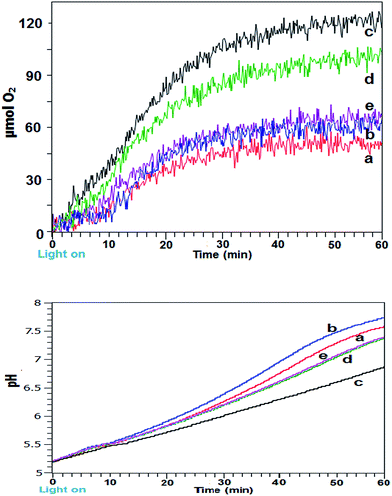
:![[thin space (1/6-em)]](https://www.rsc.org/images/entities/char_2009.gif) off (both in seconds) illumination in comparison to constant illumination. Fig. 1a shows gaseous O2 generation and yield profiles for differing lighting conditions for 60 min photoreactions. Use of intermittent light at 4
off (both in seconds) illumination in comparison to constant illumination. Fig. 1a shows gaseous O2 generation and yield profiles for differing lighting conditions for 60 min photoreactions. Use of intermittent light at 4![[thin space (1/6-em)]](https://www.rsc.org/images/entities/char_2009.gif) :
:![[thin space (1/6-em)]](https://www.rsc.org/images/entities/char_2009.gif) 1 and 6
1 and 6![[thin space (1/6-em)]](https://www.rsc.org/images/entities/char_2009.gif) :
:![[thin space (1/6-em)]](https://www.rsc.org/images/entities/char_2009.gif) 1 on
1 on![[thin space (1/6-em)]](https://www.rsc.org/images/entities/char_2009.gif) :
:![[thin space (1/6-em)]](https://www.rsc.org/images/entities/char_2009.gif) off (s
off (s![[thin space (1/6-em)]](https://www.rsc.org/images/entities/char_2009.gif) :
:![[thin space (1/6-em)]](https://www.rsc.org/images/entities/char_2009.gif) s) was detrimental for reaction rates (not shown), at 12
s) was detrimental for reaction rates (not shown), at 12![[thin space (1/6-em)]](https://www.rsc.org/images/entities/char_2009.gif) :
:![[thin space (1/6-em)]](https://www.rsc.org/images/entities/char_2009.gif) 1 (s
1 (s![[thin space (1/6-em)]](https://www.rsc.org/images/entities/char_2009.gif) :
:![[thin space (1/6-em)]](https://www.rsc.org/images/entities/char_2009.gif) s) the initial reaction rate matched that of the continuous system before overtaking after ∼16 min and overall only very marginal improvement was obtained, presumably because light influx was interrupted too frequently at these on
s) the initial reaction rate matched that of the continuous system before overtaking after ∼16 min and overall only very marginal improvement was obtained, presumably because light influx was interrupted too frequently at these on![[thin space (1/6-em)]](https://www.rsc.org/images/entities/char_2009.gif) :
:![[thin space (1/6-em)]](https://www.rsc.org/images/entities/char_2009.gif) off illumination settings. Conversely at 48
off illumination settings. Conversely at 48![[thin space (1/6-em)]](https://www.rsc.org/images/entities/char_2009.gif) :
:![[thin space (1/6-em)]](https://www.rsc.org/images/entities/char_2009.gif) 4 (s
4 (s![[thin space (1/6-em)]](https://www.rsc.org/images/entities/char_2009.gif) :
:![[thin space (1/6-em)]](https://www.rsc.org/images/entities/char_2009.gif) s), the dark periods were apparently overlong. In both these instances the timings were far from optimally tuned for improvements to the reaction mechanism. It should be noted that the intermittent light timings shown had fixed on
s), the dark periods were apparently overlong. In both these instances the timings were far from optimally tuned for improvements to the reaction mechanism. It should be noted that the intermittent light timings shown had fixed on![[thin space (1/6-em)]](https://www.rsc.org/images/entities/char_2009.gif) :
:![[thin space (1/6-em)]](https://www.rsc.org/images/entities/char_2009.gif) off ratios and thus identical overall photon flux.
off ratios and thus identical overall photon flux.
Significantly, at 36![[thin space (1/6-em)]](https://www.rsc.org/images/entities/char_2009.gif) :
:![[thin space (1/6-em)]](https://www.rsc.org/images/entities/char_2009.gif) 3 and 24
3 and 24![[thin space (1/6-em)]](https://www.rsc.org/images/entities/char_2009.gif) :
:![[thin space (1/6-em)]](https://www.rsc.org/images/entities/char_2009.gif) 2 on
2 on![[thin space (1/6-em)]](https://www.rsc.org/images/entities/char_2009.gif) :
:![[thin space (1/6-em)]](https://www.rsc.org/images/entities/char_2009.gif) off (s
off (s![[thin space (1/6-em)]](https://www.rsc.org/images/entities/char_2009.gif) :
:![[thin space (1/6-em)]](https://www.rsc.org/images/entities/char_2009.gif) s) timings cycled for the 60 min reaction duration the measured profiles clearly showed a marked increase in initial rate together with a prolongation of reaction lifetime. This was reflected in increased O2 yield and TOF over the first 30 min. At 24
s) timings cycled for the 60 min reaction duration the measured profiles clearly showed a marked increase in initial rate together with a prolongation of reaction lifetime. This was reflected in increased O2 yield and TOF over the first 30 min. At 24![[thin space (1/6-em)]](https://www.rsc.org/images/entities/char_2009.gif) :
:![[thin space (1/6-em)]](https://www.rsc.org/images/entities/char_2009.gif) 2 (s
2 (s![[thin space (1/6-em)]](https://www.rsc.org/images/entities/char_2009.gif) :
:![[thin space (1/6-em)]](https://www.rsc.org/images/entities/char_2009.gif) s) timing a yield of 120 μmol O2 and TOF of 5.57 × 10⁻⁴ s−1 was obtained, the oxygen yield was close the theoretical maximum of 125 μmol based on electron acceptor concentration. Also, for the optimal timings, the reaction profiles continued to show a slight upward incline at longer time as opposed to the leveling off shown with the other systems.
s) timing a yield of 120 μmol O2 and TOF of 5.57 × 10⁻⁴ s−1 was obtained, the oxygen yield was close the theoretical maximum of 125 μmol based on electron acceptor concentration. Also, for the optimal timings, the reaction profiles continued to show a slight upward incline at longer time as opposed to the leveling off shown with the other systems.
From the light dependant sensitizer redox cycling, decomposition of the [Co(NH3)5Cl]Cl2 electron acceptor with evolution of ammonia results in pH rise for the photocatalytic system. Corresponding pH measurements for the reactions are shown in Fig. 1b. A trend of more rapidly increasing and higher final pH was shown for the less efficient reactions. Highest pH was obtained with intermittent light at 12![[thin space (1/6-em)]](https://www.rsc.org/images/entities/char_2009.gif) :
:![[thin space (1/6-em)]](https://www.rsc.org/images/entities/char_2009.gif) 1 (s
1 (s![[thin space (1/6-em)]](https://www.rsc.org/images/entities/char_2009.gif) :
:![[thin space (1/6-em)]](https://www.rsc.org/images/entities/char_2009.gif) s) followed by the continuously lit system. Systems using 36
s) followed by the continuously lit system. Systems using 36![[thin space (1/6-em)]](https://www.rsc.org/images/entities/char_2009.gif) :
:![[thin space (1/6-em)]](https://www.rsc.org/images/entities/char_2009.gif) 3 (s
3 (s![[thin space (1/6-em)]](https://www.rsc.org/images/entities/char_2009.gif) :
:![[thin space (1/6-em)]](https://www.rsc.org/images/entities/char_2009.gif) s) and 48
s) and 48![[thin space (1/6-em)]](https://www.rsc.org/images/entities/char_2009.gif) :
:![[thin space (1/6-em)]](https://www.rsc.org/images/entities/char_2009.gif) 4 (s
4 (s![[thin space (1/6-em)]](https://www.rsc.org/images/entities/char_2009.gif) :
:![[thin space (1/6-em)]](https://www.rsc.org/images/entities/char_2009.gif) s) gave near identical pH profiles however the best performing 24
s) gave near identical pH profiles however the best performing 24![[thin space (1/6-em)]](https://www.rsc.org/images/entities/char_2009.gif) :
:![[thin space (1/6-em)]](https://www.rsc.org/images/entities/char_2009.gif) 2 (s
2 (s![[thin space (1/6-em)]](https://www.rsc.org/images/entities/char_2009.gif) :
:![[thin space (1/6-em)]](https://www.rsc.org/images/entities/char_2009.gif) s) showed a smoother upward pH trend with lower final pH of 6.75. With a more optimized water oxidation process the proton production may have led to reduced pH rise for this system. It is known that the oxidised sensitizer (i.e. [Ru(bpy)3]3+) is unstable and prone to hydroxyl attack on the bipyridine rings at pH > 7 which contributed to shutdown of the reaction at higher pH.16,17
s) showed a smoother upward pH trend with lower final pH of 6.75. With a more optimized water oxidation process the proton production may have led to reduced pH rise for this system. It is known that the oxidised sensitizer (i.e. [Ru(bpy)3]3+) is unstable and prone to hydroxyl attack on the bipyridine rings at pH > 7 which contributed to shutdown of the reaction at higher pH.16,17
Intermittent light reactions with CaMn3O6 as catalyst
The photocatalytic reactions were repeated using a synthesized CaMn3O6 catalyst as a basic analogue of the PSII Oxygen Evolving Centre (OEC) CaMn4O5 cluster.18,19 In previous work we have identified that a crystalline calcium oxomanganite with formula of CaMn3O6 was the most efficient under the reaction conditions used.20 Experiments were conducted using continuous illumination and using a range of timings around the optimal 24![[thin space (1/6-em)]](https://www.rsc.org/images/entities/char_2009.gif) :
:![[thin space (1/6-em)]](https://www.rsc.org/images/entities/char_2009.gif) 2 (s
2 (s![[thin space (1/6-em)]](https://www.rsc.org/images/entities/char_2009.gif) :
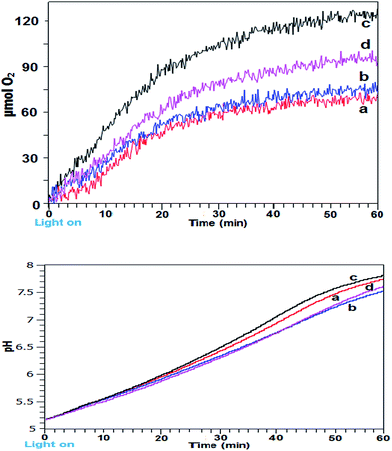
:![[thin space (1/6-em)]](https://www.rsc.org/images/entities/char_2009.gif) s) identified with the iron oxide system. A graph of O2 yields against time and corresponding pH measurements using these conditions is shown in Fig. 2a and b. Firstly, the results indicate that the optimal zone for improved reaction rate was quite narrow and within 0.5 s. Using 24
s) identified with the iron oxide system. A graph of O2 yields against time and corresponding pH measurements using these conditions is shown in Fig. 2a and b. Firstly, the results indicate that the optimal zone for improved reaction rate was quite narrow and within 0.5 s. Using 24![[thin space (1/6-em)]](https://www.rsc.org/images/entities/char_2009.gif) :
:![[thin space (1/6-em)]](https://www.rsc.org/images/entities/char_2009.gif) 1.5 (s
1.5 (s![[thin space (1/6-em)]](https://www.rsc.org/images/entities/char_2009.gif) :
:![[thin space (1/6-em)]](https://www.rsc.org/images/entities/char_2009.gif) s) gave little improvement compared to continuous illumination. Longer dark periods of 2.5 s produced a more marked improvement but a clearer increased yield was obtained at 24
s) gave little improvement compared to continuous illumination. Longer dark periods of 2.5 s produced a more marked improvement but a clearer increased yield was obtained at 24![[thin space (1/6-em)]](https://www.rsc.org/images/entities/char_2009.gif) :
:![[thin space (1/6-em)]](https://www.rsc.org/images/entities/char_2009.gif) 2 (s
2 (s![[thin space (1/6-em)]](https://www.rsc.org/images/entities/char_2009.gif) :
:![[thin space (1/6-em)]](https://www.rsc.org/images/entities/char_2009.gif) s) timing, producing 120 μmol O2 and having a TOF of 7.34 × 10⁻⁴ s−1.
s) timing, producing 120 μmol O2 and having a TOF of 7.34 × 10⁻⁴ s−1.
For this system the best performing 24![[thin space (1/6-em)]](https://www.rsc.org/images/entities/char_2009.gif) :
:![[thin space (1/6-em)]](https://www.rsc.org/images/entities/char_2009.gif) 2 (s
2 (s![[thin space (1/6-em)]](https://www.rsc.org/images/entities/char_2009.gif) :
:![[thin space (1/6-em)]](https://www.rsc.org/images/entities/char_2009.gif) s) illumination system gave highest final pH in contrast to the α/γ-Fe2O3 catalysed system. Quantitative EDX analysis of the CaMn3O6 catalyst after stirring in pH 5.5 acetate buffer for 10 min showed a reduction in relative calcium levels with measured at% Mn
s) illumination system gave highest final pH in contrast to the α/γ-Fe2O3 catalysed system. Quantitative EDX analysis of the CaMn3O6 catalyst after stirring in pH 5.5 acetate buffer for 10 min showed a reduction in relative calcium levels with measured at% Mn![[thin space (1/6-em)]](https://www.rsc.org/images/entities/char_2009.gif) :
:![[thin space (1/6-em)]](https://www.rsc.org/images/entities/char_2009.gif) Ca 3.1
Ca 3.1![[thin space (1/6-em)]](https://www.rsc.org/images/entities/char_2009.gif) :
:![[thin space (1/6-em)]](https://www.rsc.org/images/entities/char_2009.gif) 1 changing to 3.9
1 changing to 3.9![[thin space (1/6-em)]](https://www.rsc.org/images/entities/char_2009.gif) :
:![[thin space (1/6-em)]](https://www.rsc.org/images/entities/char_2009.gif) 1 due to preferential Ca dissolution from the catalyst (Fig. S2 and Table S1 ESI†). Thus, the difference in final pH of the photoreaction can be ascribed to some protons being diverted to attack on the calcium component of CaMn3O6 crystals.
1 due to preferential Ca dissolution from the catalyst (Fig. S2 and Table S1 ESI†). Thus, the difference in final pH of the photoreaction can be ascribed to some protons being diverted to attack on the calcium component of CaMn3O6 crystals.
Intermittent light reactions with Co3O4 as catalyst
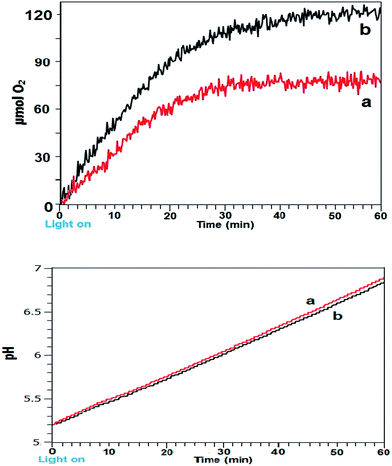
As a final evaluation, the reactions were conducted employing a commercial nanoparticulate Co3O4 using continuous and the optimal 24![[thin space (1/6-em)]](https://www.rsc.org/images/entities/char_2009.gif) :
:![[thin space (1/6-em)]](https://www.rsc.org/images/entities/char_2009.gif) 2 (s
2 (s![[thin space (1/6-em)]](https://www.rsc.org/images/entities/char_2009.gif) :
:![[thin space (1/6-em)]](https://www.rsc.org/images/entities/char_2009.gif) s) timing identified (Fig. 3a and b). Under the reaction conditions used with continuous light the catalyst performed relatively well compared to the other systems. Using 24–2 timing an improvement was still evident however, though to a lesser degree. pH profiles were near identical, suggesting that with intermittent light the Co3O4 proton production process contributed to suppressing pH rise.
s) timing identified (Fig. 3a and b). Under the reaction conditions used with continuous light the catalyst performed relatively well compared to the other systems. Using 24–2 timing an improvement was still evident however, though to a lesser degree. pH profiles were near identical, suggesting that with intermittent light the Co3O4 proton production process contributed to suppressing pH rise.
Reaction conditions, μmol O2 and calculated TOFs and quantum yields (ϕ) for the measurement for the three catalysts are shown in Table 1. The α/γ-Fe2O3 catalyst demonstrated the most marked increase in TOF under optimal (24![[thin space (1/6-em)]](https://www.rsc.org/images/entities/char_2009.gif) :
:![[thin space (1/6-em)]](https://www.rsc.org/images/entities/char_2009.gif) 2 (s
2 (s![[thin space (1/6-em)]](https://www.rsc.org/images/entities/char_2009.gif) :
:![[thin space (1/6-em)]](https://www.rsc.org/images/entities/char_2009.gif) s)) intermittent lighting showing with a 2.31 times increase, CaMn3O6 catalysis gave 1.91 and Co3O4 a 1.51 times increase. The TOF improvement was thus a function of intrinsic catalysis effectiveness with the scope lessening for more active catalysts.
s)) intermittent lighting showing with a 2.31 times increase, CaMn3O6 catalysis gave 1.91 and Co3O4 a 1.51 times increase. The TOF improvement was thus a function of intrinsic catalysis effectiveness with the scope lessening for more active catalysts.
| Catalyst (10 mg) | Light conditions cyclic on![[thin space (1/6-em)]](https://www.rsc.org/images/entities/char_2009.gif) : :![[thin space (1/6-em)]](https://www.rsc.org/images/entities/char_2009.gif) off (s off (s![[thin space (1/6-em)]](https://www.rsc.org/images/entities/char_2009.gif) : :![[thin space (1/6-em)]](https://www.rsc.org/images/entities/char_2009.gif) s) s) |
O2 yield (at t = 40 min) μmol | TOFmax (t = 0–20 min) 10−4 s−1 | ϕ O2% at t = 40 min |
|---|---|---|---|---|
| α/γ-Fe2O3 | Continuous | 52 | 2.41 | 14.4 |
| α/γ-Fe2O3 | 12![[thin space (1/6-em)]](https://www.rsc.org/images/entities/char_2009.gif) : :![[thin space (1/6-em)]](https://www.rsc.org/images/entities/char_2009.gif) 1 1 |
61 | 2.92 | 18.4 |
| α/γ-Fe2O3 | 24![[thin space (1/6-em)]](https://www.rsc.org/images/entities/char_2009.gif) : :![[thin space (1/6-em)]](https://www.rsc.org/images/entities/char_2009.gif) 2 2 |
116 | 5.57 | 35 |
| α/γ-Fe2O3 | 36![[thin space (1/6-em)]](https://www.rsc.org/images/entities/char_2009.gif) : :![[thin space (1/6-em)]](https://www.rsc.org/images/entities/char_2009.gif) 3 3 |
96 | 4.36 | 29.1 |
| α/γ-Fe2O3 | 48![[thin space (1/6-em)]](https://www.rsc.org/images/entities/char_2009.gif) : :![[thin space (1/6-em)]](https://www.rsc.org/images/entities/char_2009.gif) 4 4 |
61 | 2.93 | 18.5 |
| CaMn3O6 | Continuous | 64 | 3.84 | 17.8 |
| CaMn3O6 | 24![[thin space (1/6-em)]](https://www.rsc.org/images/entities/char_2009.gif) : :![[thin space (1/6-em)]](https://www.rsc.org/images/entities/char_2009.gif) 1.5 1.5 |
70 | 4.43 | 20.7 |
| CaMn3O6 | 24![[thin space (1/6-em)]](https://www.rsc.org/images/entities/char_2009.gif) : :![[thin space (1/6-em)]](https://www.rsc.org/images/entities/char_2009.gif) 2 2 |
117 | 7.34 | 35.3 |
| CaMn3O6 | 24![[thin space (1/6-em)]](https://www.rsc.org/images/entities/char_2009.gif) : :![[thin space (1/6-em)]](https://www.rsc.org/images/entities/char_2009.gif) 2.5 2.5 |
86 | 5.25 | 26.6 |
| Co3O4 | Continuous | 80 | 4.1 | 22.3 |
| Co3O4 | 24![[thin space (1/6-em)]](https://www.rsc.org/images/entities/char_2009.gif) : :![[thin space (1/6-em)]](https://www.rsc.org/images/entities/char_2009.gif) 2 2 |
119 | 6.2 | 35.9 |
Since the CaMn3O6 catalyst has been shown to be subject to compositional change during the photo-reaction, the use of active site area for rate calculations may be misleading, a photonic method was thus employed. Previous work indicated that levels of in situ generated cobalt oxides and hydroxides from electron acceptor decomposition that can contribute to O2 generation becomes significant after approximately 40 min.15 Therefore total O2 yields at 40 min was used for yield and ϕ calculations.
Mass spectrometry analysis
To help elucidate the mechanism for the significantly improved reaction efficiencies observed in these systems, mass spectrometry analysis was conducted on the post reaction CaMn3O6 and Fe2O3 mixtures formed using continuous and intermittent lighting. Methanol was used as the MS carrier solvent, thus allowing more distinct analysis of the highly soluble [Ru(bpy)3]2+ component. A brown coloured deposit also gradually formed on the illuminated flask surface. In this photoaquation process bipyridine ligands are displaced from the ruthenium and can be observed to accumulate in the form of a low water solubility hydrocarbon rich coating.11,17,21 This was also quantitatively collected and analysed by MS to provide an assessment of the entire reaction timescale.Mass spectrometry of CaMn3O6 reaction mixtures
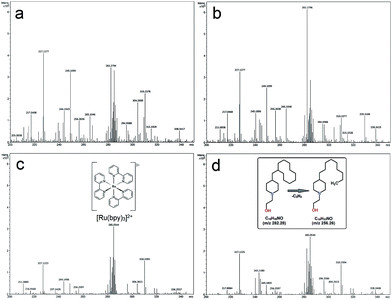
MS analysis of the reaction mixture prior to illumination is shown in Fig. S3a ESI,† a large [Ru(bpy)3]2+z = 2 peak at m/z 285.05 with surrounding Ru isotope peaks was measured. Photocatalytic reactions resulted in emergence of multiple peaks ranging from 96 up to 610 m/z, full scale spectrograms are shown in Fig. S3b–e ESI.† Key features of the spectrometry can be seen associated around the intact [Ru(bpy)3]2+. Fig. S4 ESI† shows a Ru isotope separation of 0.5 Da further confirming the 2+ ion charge. The adjacent decomposition product at m/z 282.279, was a saturated hydrocarbon of composition C18H35NO (H+) without Ru present, as indicated by isotope mass analysis (Fig. 4a–d).Notably [Ru(bpy)3]2+: C18H35NO peaks are either equivalent or decomposition product rich with the poorer performing continuous and 24![[thin space (1/6-em)]](https://www.rsc.org/images/entities/char_2009.gif) :
:![[thin space (1/6-em)]](https://www.rsc.org/images/entities/char_2009.gif) 1.5 (s
1.5 (s![[thin space (1/6-em)]](https://www.rsc.org/images/entities/char_2009.gif) :
:![[thin space (1/6-em)]](https://www.rsc.org/images/entities/char_2009.gif) s) timing system. The converse situation was obtained at 24
s) timing system. The converse situation was obtained at 24![[thin space (1/6-em)]](https://www.rsc.org/images/entities/char_2009.gif) :
:![[thin space (1/6-em)]](https://www.rsc.org/images/entities/char_2009.gif) 2 (s
2 (s![[thin space (1/6-em)]](https://www.rsc.org/images/entities/char_2009.gif) :
:![[thin space (1/6-em)]](https://www.rsc.org/images/entities/char_2009.gif) s) and 24
s) and 24![[thin space (1/6-em)]](https://www.rsc.org/images/entities/char_2009.gif) :
:![[thin space (1/6-em)]](https://www.rsc.org/images/entities/char_2009.gif) 2.5 (s
2.5 (s![[thin space (1/6-em)]](https://www.rsc.org/images/entities/char_2009.gif) :
:![[thin space (1/6-em)]](https://www.rsc.org/images/entities/char_2009.gif) s) timing with highest intact [Ru(bpy)3]2+ present in the best performing 24
s) timing with highest intact [Ru(bpy)3]2+ present in the best performing 24![[thin space (1/6-em)]](https://www.rsc.org/images/entities/char_2009.gif) :
:![[thin space (1/6-em)]](https://www.rsc.org/images/entities/char_2009.gif) 2 (s
2 (s![[thin space (1/6-em)]](https://www.rsc.org/images/entities/char_2009.gif) :
:![[thin space (1/6-em)]](https://www.rsc.org/images/entities/char_2009.gif) s) system (Fig. 4c).
s) system (Fig. 4c).
Mass spectrometry of CaMn3O6 reaction flask deposits
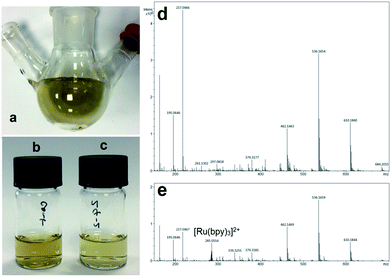
An example image of the rinsed post-reaction flask and filtered deposits collected in methanol are shown in Fig. 5a–c. Mass spectrometry analysis of the lower water-soluble deposits collected from the flask surface were rich in hydrocarbon deposits formed from degradation of reagents. MS results from analysis of deposits from the CaMn3O6 catalysed system with continuous light and 24![[thin space (1/6-em)]](https://www.rsc.org/images/entities/char_2009.gif) :
:![[thin space (1/6-em)]](https://www.rsc.org/images/entities/char_2009.gif) 2 (s
2 (s![[thin space (1/6-em)]](https://www.rsc.org/images/entities/char_2009.gif) :
:![[thin space (1/6-em)]](https://www.rsc.org/images/entities/char_2009.gif) s) timing are shown in Fig. 5d and e. Results show a greater relative level of decomposed material present when continuous illumination was employed with no [Ru(bpy)3]2+ detectable. In contrast, intact sensitizer at m/z 285.055 was clearly present with 24
s) timing are shown in Fig. 5d and e. Results show a greater relative level of decomposed material present when continuous illumination was employed with no [Ru(bpy)3]2+ detectable. In contrast, intact sensitizer at m/z 285.055 was clearly present with 24![[thin space (1/6-em)]](https://www.rsc.org/images/entities/char_2009.gif) :
:![[thin space (1/6-em)]](https://www.rsc.org/images/entities/char_2009.gif) 2 (s
2 (s![[thin space (1/6-em)]](https://www.rsc.org/images/entities/char_2009.gif) :
:![[thin space (1/6-em)]](https://www.rsc.org/images/entities/char_2009.gif) s) timing. Other major decomposition product peaks were present at m/z 610.184, 536.165, 462.146 and 217.046 which correspond to C35H20N11O, C39H22NO2, C29H16N7 and C8H5N6O2 by isotope mass analysis.
s) timing. Other major decomposition product peaks were present at m/z 610.184, 536.165, 462.146 and 217.046 which correspond to C35H20N11O, C39H22NO2, C29H16N7 and C8H5N6O2 by isotope mass analysis.
A similar trend of relatively elevated levels of hydrocarbon deposits using continuous light was obtained with the other catalysed reaction systems (Fig. S5 and S6 ESI†).
Overall the coating that formed on flasks from the photocatalysis was noted to be slightly darker coloured for reactions conducted using continuous illumination. However, coating build-up on the flask was gradual and the blocking effect of incoming light was not significant on early stage crucial reaction rates. The collected MS data indicates that intermittent light at 24![[thin space (1/6-em)]](https://www.rsc.org/images/entities/char_2009.gif) :
:![[thin space (1/6-em)]](https://www.rsc.org/images/entities/char_2009.gif) 2 (s
2 (s![[thin space (1/6-em)]](https://www.rsc.org/images/entities/char_2009.gif) :
:![[thin space (1/6-em)]](https://www.rsc.org/images/entities/char_2009.gif) s) and 24
s) and 24![[thin space (1/6-em)]](https://www.rsc.org/images/entities/char_2009.gif) :
:![[thin space (1/6-em)]](https://www.rsc.org/images/entities/char_2009.gif) 2.5 (s
2.5 (s![[thin space (1/6-em)]](https://www.rsc.org/images/entities/char_2009.gif) :
:![[thin space (1/6-em)]](https://www.rsc.org/images/entities/char_2009.gif) s) timings resulted in less decomposition of the [Ru(bpy)3]2+ sensitizer, thus promoting a more efficient reaction. The MS data also suggest that the self-decomposition of the oxidised unstable [Ru(bpy)3]3+ to hydroxylated derivatives occurred via detachment of ruthenium combined with loss of the heterocyclic nitrogens.
s) timings resulted in less decomposition of the [Ru(bpy)3]2+ sensitizer, thus promoting a more efficient reaction. The MS data also suggest that the self-decomposition of the oxidised unstable [Ru(bpy)3]3+ to hydroxylated derivatives occurred via detachment of ruthenium combined with loss of the heterocyclic nitrogens.
Saturated hydrocarbons depleted in N were present at lower m/z, with some possible N rich compounds formed at high m/z, e.g. C35H20N11O at m/z 610.184. The multi-peak isotope pattern for ruthenium is distinctive and no other fragments and decomposition products containing Ru were evident and it can be concluded that Ru oxides released from the decomposed [Ru(bpy)3]2+ gradually formed insoluble aggregates along with some in situ generated cobalt oxides which were all removed by filtrations prior to MS analysis.15
UV-visible spectroscopy analysis
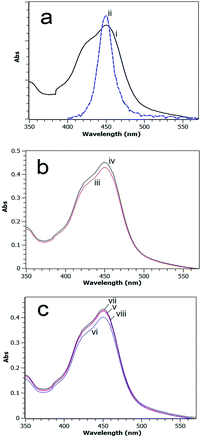
A UV-visible absorption spectrum for the [Ru(bpy)3]2+ MLCT band in methanol overlaid with the emission spectrum of the blue LED light source used in this study is shown in Fig. 6a.The absorption spectra of carefully quantitatively gathered reaction mixtures after 60 min photocatalytic reaction using Fe2O3 or CaMn3O6 as the catalyst with continuous and intermittent light timings are shown in Fig. 6b and c.
The absorption profiles are near identical in shape; however a greater absorption was obtained for systems that employed a timing of 24–2 (s![[thin space (1/6-em)]](https://www.rsc.org/images/entities/char_2009.gif) :
:![[thin space (1/6-em)]](https://www.rsc.org/images/entities/char_2009.gif) s). This agrees with the MS analysis which indicated more intact sensitizer was retained with intermittent lighting.
s). This agrees with the MS analysis which indicated more intact sensitizer was retained with intermittent lighting.
Low reaction volume flow-system photocatalytic water oxidation
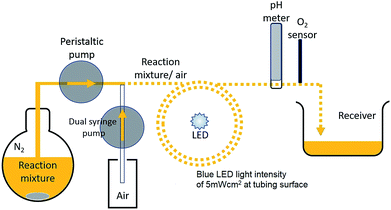
Electron transitions, transfers and sensitizer excited state lifetime are on the order of micro/pico seconds, however it is reported that on illumination a sensitizer solution takes on the order of a few seconds for the major bulk of molecules to become oxidized.7This timescale is due to circulation of reagent molecules around the illuminated surface. For the flask bulk reaction we have demonstrated that dark periods of a few seconds resulted in marked effects in reaction rates. This timescale can thus be ascribed to diffusion rates of reagent molecules in various oxidation states. To help elucidate the mechanism for improved reaction rate a segmented flow system using very low reaction mixture volumes was designed and tested. Here segments of 0.022 cm3 reaction solution were separated by air to prevent sedimentation of particles and back-mixing and generate mixing within each segment. Flow systems have been widely employed for photocatalytic degradation of water pollutants and for hydrogen production from photocatalyzed TiO2/Pt water flow systems.22,23
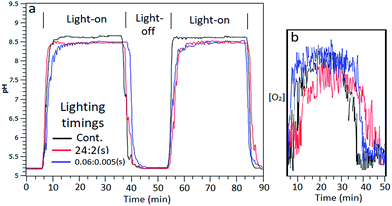
Used here, the flow system permits a continuous reaction under illumination. The reaction set-up employed is illustrated in Scheme 1 and Fig. S7, S8a and b ESI.† For this system, continuous lighting and a fast intermittent light 0.06![[thin space (1/6-em)]](https://www.rsc.org/images/entities/char_2009.gif) :
:![[thin space (1/6-em)]](https://www.rsc.org/images/entities/char_2009.gif) 0.005 (s
0.005 (s![[thin space (1/6-em)]](https://www.rsc.org/images/entities/char_2009.gif) :
:![[thin space (1/6-em)]](https://www.rsc.org/images/entities/char_2009.gif) s) on
s) on![[thin space (1/6-em)]](https://www.rsc.org/images/entities/char_2009.gif) :
:![[thin space (1/6-em)]](https://www.rsc.org/images/entities/char_2009.gif) off (ratio corrected from above batch method of 24
off (ratio corrected from above batch method of 24![[thin space (1/6-em)]](https://www.rsc.org/images/entities/char_2009.gif) :
:![[thin space (1/6-em)]](https://www.rsc.org/images/entities/char_2009.gif) 2 (s
2 (s![[thin space (1/6-em)]](https://www.rsc.org/images/entities/char_2009.gif) :
:![[thin space (1/6-em)]](https://www.rsc.org/images/entities/char_2009.gif) s)) were used and effects upon reaction mixture pH and indication of O2 yields measured. A graph of measured pH and relative gaseous O2 released by the continuous flowing reaction mixture under the differing lighting conditions is shown in Fig. 7aand b.
s)) were used and effects upon reaction mixture pH and indication of O2 yields measured. A graph of measured pH and relative gaseous O2 released by the continuous flowing reaction mixture under the differing lighting conditions is shown in Fig. 7aand b.
Effects of intermittent illumination
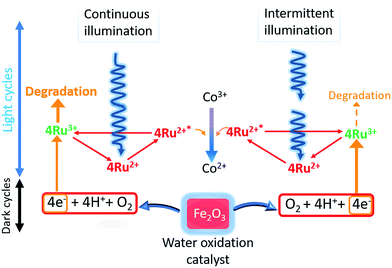
[Ru(bpy)3]2+ has been extensively employed as the light harvester for photocatalytic water oxidations and is a costly component of the reagent mixture. Improvements in reaction efficiency due to its reduced degradation has clear benefits for its use in sustainability applications.Analysis by mass spectrometry showed intact [Ru(bpy)3]2+ was maintained with use of optimized intermittent lighting and was the probable source for the improvements observed. It is suggested that providing regular short dark moments temporarily shuts down formation of Ru(bpy)33+. This allowed water oxidation to progress more fully on the metal oxide and also periodic reduction or elimination of self-degradation of excess oxidized light sensitizer. Increased relative dark periods were found to be detrimental. Conversely, infrequent light interruption gave little difference compared to constant illumination. Thus, a balance of dark periods whilst also maintaining the ongoing photoreaction with sufficient illumination was necessary. Changes in reaction pH are complex as proton generation from the water oxidation was opposed by generation of ammonia from decomposed electron acceptor. With CaMn3O6 catalyst, diversion of generated protons to attack on the calcium component appeared significant as the best performing system resulted in highest final pH. For the other catalysts proton generation counteracted ammonia formation with final pH remaining below 7. Benefits of using dark periods are inversely proportional to catalyst efficiency, since less excess oxidized sensitizer will be present with more active catalysts. Scheme 2 shows a proposed schematic representation of the photocatalytic water oxidation system under continuous and tuned intermittent lighting. Under continuous illumination excess oxidized sensitizer can accumulate and undergo degradation, with intermittent illumination flow of electrons from the metal oxide matches to oxidized sensitizer levels more effectively lessening the sensitizer degradation pathway.
The comparison of batch versus flow system firstly showed that the limitation of reaction duration can be largely eliminated by the continuous flow assembly. Secondly the results were in accordance with batch system since the fast 0.06![[thin space (1/6-em)]](https://www.rsc.org/images/entities/char_2009.gif) :
:![[thin space (1/6-em)]](https://www.rsc.org/images/entities/char_2009.gif) 0.005 (s
0.005 (s![[thin space (1/6-em)]](https://www.rsc.org/images/entities/char_2009.gif) :
:![[thin space (1/6-em)]](https://www.rsc.org/images/entities/char_2009.gif) s) on
s) on![[thin space (1/6-em)]](https://www.rsc.org/images/entities/char_2009.gif) :
:![[thin space (1/6-em)]](https://www.rsc.org/images/entities/char_2009.gif) off was equivalent to gaseous O2 output as continuous lighting (Fig. 7b). Steady state pH was lessened compared to continuous light which can be ascribed to increased proton output counteracting electron acceptor ammonia generation, as was found with Co3O4 catalysed batch systems.
off was equivalent to gaseous O2 output as continuous lighting (Fig. 7b). Steady state pH was lessened compared to continuous light which can be ascribed to increased proton output counteracting electron acceptor ammonia generation, as was found with Co3O4 catalysed batch systems.
Conclusions
Simple non-rare earth catalysts were prepared with a short calcination synthesis using biopolymer templates. It is notable that the templating synthesis resulted in some enhancement of the hematite (110) relative to the (104) plane (compared to normal bulk hematite), (110) enhancement is associated with improved water splitting ability.24Under normal photocatalysis conditions abundant metal oxides are moderately active in comparison to toxic and/or costly rare earths (e.g. IrO2).17 Previously, photo-water oxidations using light at a range of intensities (fixed for the duration of each reaction) resulted in lower TON, O2 yield and increased lag time.10 In this work, photoreactions using the hematite catalyst employed intermittent light at fixed on![[thin space (1/6-em)]](https://www.rsc.org/images/entities/char_2009.gif) :
:![[thin space (1/6-em)]](https://www.rsc.org/images/entities/char_2009.gif) off ratios and activity of the catalysts markedly increased at optimum timings. Thus, differences in efficiency cannot simply be ascribed to an overall lowered light intensity reducing sensitizer decomposition. This is because the differing ratios gave altered O2 yields and pH effects, even though overall photon flux was identical.
off ratios and activity of the catalysts markedly increased at optimum timings. Thus, differences in efficiency cannot simply be ascribed to an overall lowered light intensity reducing sensitizer decomposition. This is because the differing ratios gave altered O2 yields and pH effects, even though overall photon flux was identical.
A dark period that matches reagent to diffusion rates and levels of oxidized sensitizer can be expected to be optimal. Interestingly, this technique can particularly be of benefit with low cost earth abundant catalysts more as these tend to be less active compared to more efficient but costlier rare earth based catalysts.
For use with natural sunlight, readily available fast switching liquid crystal shutter panel systems can control optimized intermittent light delivery onto a reaction vessel or continuous flow tube.
[Ru(bpy)3]2+ is also increasingly being employed as photo-redox agent in for example organic catalysis,25 photopharmacology,26 natural product synthesis,27 amine oxidations28 and biochemical couplings such as C–S click reactions.29 Therefore, the effects of intermittent light source illumination has implications for these wider uses in terms of reaction pathway and improved yields.
Hydrogen generation is readily achieved using well established polymer electrolyte membrane (PEM) proton separation plus catalysed reduction technologies.30,31 A continuous flow system, as demonstrated here, is particularly suitable for larger scale H2 generation.
Our further studies on solar fuel production will investigate if intermittent light intensity effects can enhance redox reactions including water oxidations using non-rare earth Zn-porphyrin or robust Pt-porphyrin light sensitizers.32,33 A particular future aim is use of modified [Fe(bpy)3]2+ sensitizer structures with increased excited state lifetimes.34 Alternatively, quinone derivatives as electron harvesters can replace irreversible electron acceptors.35,36 The overall long term aim is the development of effective low toxicity, earth abundant photocatalytic systems.
Conflicts of interest
There are no conflicts to declare.Acknowledgements
We thank Y. Y. Kim and A. Kulak, University of Leeds for assistance with BET and powder XRD measurement. DW and MTW acknowledge funding from a UoB Faculty of Science departmental grant. KR acknowledges the EPSRC Grand Challenge Network Direct Assembly Network (PP14 11 03) for funding. We would like to thank Vapourtec UK for their kind donation of the SF-10 pump for use in the flow experiments.References
- S. Styring, Faraday Discuss., 2012, 155, 357–376 RSC.
- Y. Tachibana, L. Vayssieres and J. R. Durrant, Nat. Photonics, 2012, 6, 511–518 CrossRef CAS.
- K. J. Young, L. A. Martini, R. L. Milot, R. C. S. Iii, V. S. Batista, C. A. Schmuttenmaer, R. H. Crabtree and G. W. Brudvig, Coord. Chem. Rev., 2012, 256, 2503–2520 CrossRef CAS PubMed.
- J. Van Houten and R. J. Watts, J. Am. Chem. Soc., 1976, 98, 4853–4858 CrossRef CAS.
- L. Duan, Y. Xu, P. Zhang, M. Wang and L. Sun, Inorg. Chem., 2010, 49, 209–215 CrossRef CAS PubMed.
- A. Harriman, G. Porter and P. Walters, J. Chem. Soc., Faraday Trans. 2, 1981, 77, 2373–2383 RSC.
- B. Limburg, E. Bouwman and S. Bonnet, ACS Catal., 2016, 6, 5273–5284 CrossRef CAS.
- C. Herrero, A. Quaranta, W. Leibl, A. W. Rutherford and A. Aukauloo, Energy Environ. Sci., 2011, 4, 2353–2365 CAS.
- M. Morikawa, Y. Ogura, N. Ahmed, S. Kawamura, G. Mikami, S. Okamoto and Y. Izumi, Catal. Sci. Technol., 2014, 4, 1644–1651 CAS.
- D. Walsh, N. M. Sanchez-Ballester, V. P. Ting, S. R. Hall, L. R. Terry and M. T. Weller, Catal. Sci. Technol., 2015, 5, 4760–4764 CAS.
- D. Walsh, P. Patureau, J. Walton, J. Potticary, S. R. Hall and M. T. Weller, RSC Adv., 2016, 6, 97363–97366 RSC.
- F. Jiao and H. Frei, Angew. Chem., Int. Ed., 2009, 48, 1841–1844 CrossRef CAS PubMed.
- Y. Y. Kim, D. Williams, F. C. Meldrum and D. Walsh, Small, 2013, 9, 61–66 CrossRef CAS PubMed.
- J. Hadermann, A. M. Abakumov, L. J. Gillie, C. Martin and M. Hervieu, Chem. Mater., 2006, 18, 5530–5536 CrossRef CAS.
- D. Walsh, N. M. Sanchez-Ballester, K. Ariga, A. Tanaka and M. Weller, Green Chem., 2015, 17, 982–990 RSC.
- C. Creutz and N. Sutin, Proc. Natl. Acad. Sci. U. S. A., 1975, 72, 2858–2862 CrossRef CAS.
- M. Hara, C. C. Waraksa, J. T. Lean, B. A. Lewis and T. E. Mallouk, J. Phys. Chem. A, 2000, 104, 5275–5280 CrossRef CAS.
- B. Loll, J. Kern, W. Saenger, A. Zouni and J. Biesiadka, Nature, 2005, 438, 1040–1044 CrossRef CAS PubMed.
- Y. Umena, K. Kawakami, J.-R. Shen and N. Kamiya, Nature, 2011, 473, 55–60 CrossRef CAS PubMed.
- Y.-Y. Kim, D. Williams, F. C. Meldrum and D. Walsh, Small, 2013, 9, 61–66 CrossRef CAS PubMed.
- A. Vaidyalingam and P. K. Dutta, Anal. Chem., 2000, 72, 5219–5224 CrossRef CAS PubMed.
- S. Chang, X. Yang, Y. Sang and H. Liu, Chem. - Asian J., 2016, 11, 2352–2371 CrossRef CAS PubMed.
- R. Zhou, S.-Z. Kang, X. Li, L. Wang, L. Qin and J. Mu, RSC Adv., 2015, 5, 6954–6961 RSC.
- S. Kment, P. Schmuki, Z. Hubicka, L. Machala, R. Kirchgeorg, N. Liu, L. Wang, K. Lee, J. Olejnicek, M. Cada, I. Gregora and R. Zboril, ACS Nano, 2015, 9, 7113–7123 CrossRef CAS PubMed.
- D. A. Nicewicz and D. W. C. MacMillan, Science, 2008, 322, 77–80 CrossRef CAS PubMed.
- V. H. S. van Rixel, B. Siewert, S. L. Hopkins, S. H. C. Askes, A. Busemann, M. A. Siegler and S. Bonnet, Chem. Sci., 2016, 7, 4922–4929 RSC.
- T. P. Nicholls, D. Leonori and A. C. Bissember, Nat. Prod. Rep., 2016, 33, 1248–1254 RSC.
- M. Rueping, C. Vila, A. Szadkowska, R. M. Koenigs and J. Fronert, ACS Catal., 2012, 2, 2810–2815 CrossRef CAS.
- S. S. Zalesskiy, N. S. Shlapakov and V. P. Ananikov, Chem. Sci., 2016, 7, 6740–6745 RSC.
- Y. Wang, K. S. Chen, J. Mishler, S. C. Cho and X. C. Adroher, Appl. Energy, 2011, 88, 981–1007 CrossRef CAS.
- J. Tymoczko, F. Calle-Vallejo, W. Schuhmann and A. S. Bandarenka, Nat. Commun., 2016, 7, 10990 CrossRef CAS PubMed.
- D. G. Nocera, Acc. Chem. Res., 2012, 45, 767–776 CrossRef CAS PubMed.
- H.-C. Chen, D. G. H. Hetterscheid, R. M. Williams, J. I. van der Vlugt, J. N. H. Reek and A. M. Brouwer, Energy Environ. Sci., 2015, 8, 975–982 CAS.
- L. A. Fredin, M. Pápai, E. Rozsályi, G. Vankó, K. Wärnmark, V. Sundström and P. Persson, J. Phys. Chem. Lett., 2014, 5, 2066–2071 CrossRef CAS PubMed.
- D. Walsh, N. M. Sanchez-Ballester, V. P. Ting, K. Ariga and M. T. Weller, Catal. Sci. Technol., 2016, 6, 3718–3722 CAS.
- E. J. Son, J. H. Kim, K. Kim and C. B. Park, J. Mater. Chem. A, 2016, 4, 11179–11202 CAS.
Footnote |
| † Electronic supplementary information (ESI) available: Powder XRD of metal oxides, full experimental and equipment details, quantitative EDX of mild acid treated CaMn3O6, full scale MS spectroscopy of reaction mixtures and deposits, flow system experimental details, example calculations. See DOI: 10.1039/c7se00304h |
| This journal is © The Royal Society of Chemistry 2017 |

