Thermal crosslinking of PBI/sulfonated polysulfone based blend membranes
Dickson
Joseph
a,
N. Nambi
Krishnan
a,
Dirk
Henkensmeier
*ab,
Jong Hyun
Jang
ac,
Sun Hee
Choi
a,
Hyoung-Juhn
Kim
a,
Jonghee
Han
a and
Suk Woo
Nam
ac
aFuel Cell Research Center, Korea Institute of Science and Technology, Hwarangro 14-gil5, Seongbuk-gu, Seoul 02792, Republic of Korea. E-mail: henkensmeier@kist.re.kr; Tel: +82 2 958 5298
bUniversity of Science and Technology, 217 Gajungro, Yuseonggu, Daejeon, Republic of Korea
cGreen School, Korea University, Seoul 136-713, Republic of Korea
First published on 5th December 2016
Abstract
Crosslinked polybenzimidazole (PBI) membranes are most often obtained by reacting the nitrogen atoms of PBI with an alkylating agent. These links can be attacked by nucleophiles at elevated temperatures. To avoid N–CH2-links we introduce a new method to crosslink PBI, starting from ionically crosslinked acid/base blend membranes. By heating them to temperatures above say 200 °C, a Friedel–Crafts reaction between sulfonic acid groups and electron rich phenyl groups covalently crosslinks the acid and base components in the blend by chemically stable aromatic sulfone bonds. According to the literature pure PBI can also be cured and a radical mechanism involving air was suggested. We show that PBI can also be cured in an inert atmosphere. We propose that the thermal curing of pure PBI, which necessitates slightly higher temperatures than blend membranes, proceeds via hydrolysis of imidazole to –COOH and diamine, followed by a Friedel–Crafts reaction of the acid. While crosslinks cannot be directly analysed by nmr or IR, our data support the mentioned mechanism. We show the effect of curing temperature and time on membrane properties like solubility, phosphoric acid uptake and mechanical properties, and test a membrane in a fuel cell, proving that the membranes are gas tight and show a good performance.
1. Introduction
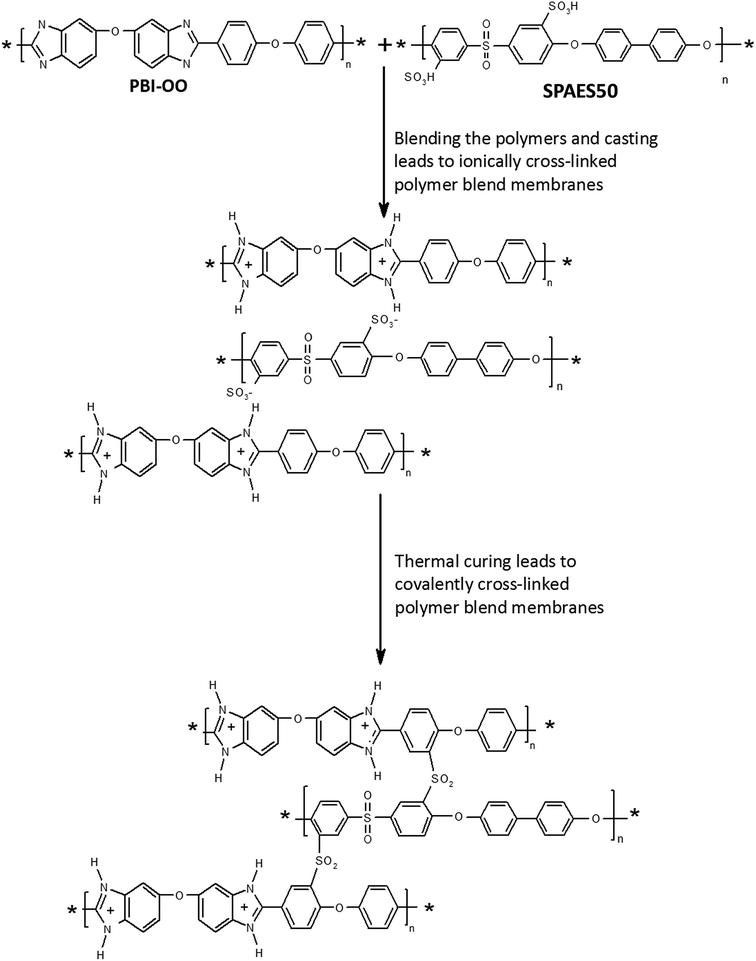
Proton exchange membrane fuel cells (PEMFCs) are energy conversion devices that convert chemical energy into electric power. If the operating temperature is in the range of 120–200 °C, the systems are called high temperature PEMFCs. Most commercial systems are based on phosphoric acid (PA) doped polybenzimidazole (PBI) membranes. The most successful material is poly[2,2′-(m-phenylene)-5,5′-bisbenzimidazole] (meta-PBI), a high performance polymer developed by Vogel and Marvel.1 In 1995 Wainright et al. demonstrated that PBI can be doped with PA and used as a membrane in HT PEMFCs.2 Their initial research results inspired many researchers, and PA doped polybenzimidazole and its derivatives have been developed and systematically characterized over the past two decades, as demonstrated in several review articles and books on this field.3–5 One of the remaining challenges is to push the trade-off relationship between the high PA uptake (correlating with high conductivity) and mechanical strength, because PA softens the membranes. In extreme cases, PA doped meta-PBI membranes consist of over 90% of PA.6 Especially such highly doped membranes can suffer from creep.7 In order to shift the trade-off relationship to more beneficial values, different cross-linking methods have been developed to modify the PBI structure and to improve the mechanical properties without sacrificing the proton conductivity much. Ionically crosslinked PBI membranes were prepared by blending PBI (containing basic nitrogen atoms) with different sulfonated polymers (as the acidic component).8–12 Stronger, covalently cross-linked PBI membranes can be prepared by several ways.13–20 Most of these crosslinking routes involve alkylation of the PBI nitrogen atoms, which easily degrade in the presence of nucleophiles around the operating temperature of the fuel cells.21,22 An alternative is thermal curing.1,13,23 The mechanism is not well understood, but the crosslinking is efficient, as shown by complete insolubility, high resistance to swelling and improved mechanical toughness in the PA doped state.13A crosslinking method which does not employ nitrogen atoms is the thermally activated Friedel–Crafts reaction between sulfonic acid groups and electron rich, activated phenyl groups, leading to chemically highly stable aromatic sulfones. This type of reaction can be employed without any additive or reagents by simply heating a sulfonated aromatic polymer.24–27 As far as we know, this reaction was never applied to PBI derivatives. In the present contribution, we prepare ionically crosslinked blend membranes of a sulfonated polysulfone (SPAES50), and a commercially available PBI derivative which contains activated phenyl rings in the main chain (PBI–OO). By heating the membranes, we activate the Friedel–Crafts reaction. Due to the large excess of PBI–OO, the sulfonic acid groups preferentially react with PBI–OO, leading to a covalently crosslinked system. The effects of temperature and curing time on the solubility, PA uptake and membrane flexibility and mechanical strength are investigated in this work.
2. Experimental part
2.1 Materials
PBI–OO was obtained from FuMA-Tech GmbH, Germany. Traces of methanesulfonic acid were removed either by washing with a weak basic solution and water, or by dissolution of 6 g in 54 g NMP, followed by precipitation in 2 L water. SPAES50 in the salt form was purchased from YANJIN Technology, China and protonated before use. In SPAES50 (catalog number SES0005), half of the diphenylsulfone groups are double sulfonated. This corresponds to an IEC value of 2.08 meq. g−1. The H+ form was obtained by pouring a solution of SPAES50 (K+ form) into a mixture of methanol and concentrated hydrochloric acid. N,N-Dimethylacetamide (DMAc) (≥99.9%) and phosphoric acid (≥85 wt%), were purchased from Sigma-Aldrich and used as received.2.2 Membrane preparation
PBI–OO and SPAES50 were blended by mixing different ratios of 5 wt% polymer solutions in DMAc. The mixed solutions were filtered using 0.45 μm PTFE filters and drop cast on clean Petri dishes. The solvent was evaporated in a vacuum oven at 60 °C for 12 h without vacuum followed by 24 h with vacuum and then the temperature was increased to 80 °C and kept for 8 h. After attaining room temperature the polymer blend films were soaked in deionized (DI) water to peel of the membranes. The membranes were then washed in DI water for 24 h at 80 °C to remove the excess solvent present in the membranes. Membranes with thickness ranging from 40 to 70 μm were obtained.2.3 Thermal curing
2.4 Phosphoric acid uptake
The PA doping of the membranes was performed by immersing the membranes or samples (4 × 1 cm2) into 85 wt% at the given temperature. The phosphoric acid uptake was determined by gravimetric measurements before and after doping. The weight gain due to absorption of PA was calculated by the difference of initial (wi) (dried at 60 °C under vacuum) and doped sample weight (wPA) according to the following equation:In the following, PA uptake and weight gain during doping are used synonymously. For meta-PBI the acid concentration inside of the doped membranes was found to be around 85% and practically independent of the doping bath concentration.28 Since the water content of the doped acid is very probably not related to the polymer structure, but rather a consequence of hydrogen bonding between PA molecules and water, a concentration of 85% seems to be reasonable also for PBI–OO and blend membranes.
2.5 Characterisation
The maximum tensile strength and the Young's modulus of the PA doped membranes were determined from force displacement curves measured with a Cometech QC-508E instrument. For each material, at least four samples from the same membrane were measured. The sample size was 4 × 1 cm2 and the elongation speed was 10 mm min−1. Thermogravimetric analysis was conducted with a TAQ50-1260 instrument in the temperature range from room temperature to 900 °C under a nitrogen atmosphere. The heating rate was 10 °C min−1.2.6 Fuel cell test and electrochemical characterization
Catalyst ink was prepared by mixing Pt/C (Tanaka 46.3 wt% Pt) with PTFE dispersion (60 wt% in water) in deionized water and isopropyl alcohol. The dry ratio between Pt/C and PTFE was 4![[thin space (1/6-em)]](https://www.rsc.org/images/entities/char_2009.gif) :
:![[thin space (1/6-em)]](https://www.rsc.org/images/entities/char_2009.gif) 1. The gas diffusion electrode (GDE) was prepared by spraying the ink on a gas diffusion layer (SGL GDL 10 BC) using an automatic spraying machine. The GDEs were annealed at 350 °C for 5 minutes under a nitrogen atmosphere. The active area was 7.84 cm2 with a platinum loading of 1 mg cm−2 for each, the anode and cathode. The single cell was assembled by placing the membrane between the GDEs without any hot pressing.
1. The gas diffusion electrode (GDE) was prepared by spraying the ink on a gas diffusion layer (SGL GDL 10 BC) using an automatic spraying machine. The GDEs were annealed at 350 °C for 5 minutes under a nitrogen atmosphere. The active area was 7.84 cm2 with a platinum loading of 1 mg cm−2 for each, the anode and cathode. The single cell was assembled by placing the membrane between the GDEs without any hot pressing.
Single cell tests were carried out with a constant gas flow of 82 sccm H2 at the anode and 296 sccm air at the cathode in a fuel cell testing station (CNL, Korea) including mass flow controllers and a temperature control system. All experiments were conducted under ambient pressure at a temperature of 160 °C without any humidification.
The single cell was activated at a constant current density of 0.2 A cm−2. The polarization curve (i–V) was measured using an electronic load (DC-Electronic Load ESL-300Z, ELP) and Fuel Cell Control software V3.00 (CNL, Korea).
3. Results and discussion
3.1 Preparation of blend membranes
The preparation of acid/base blend membranes and their properties have been extensively investigated by many researchers, e.g. by the Kerres group.8 In such membranes, the sulfonic acid groups of the acid component protonate amine groups of the base components, resulting in ionically crosslinked membranes. Since the bonds are not covalent, the membranes usually show advantageous properties, but still can be dissolved, and bonds can be broken and reformed over time, which should allow creep, although less than may be observed for un-crosslinked membranes. In this work we blend PBI–OO (a polymer which has electron rich aromatic rings) and a sulfonated polysulfone (SPAES50) (Fig. 1). From previous work we know that SPAES50 can be thermally crosslinked above temperatures of 180 °C. The crosslinking unit is an aromatic sulfone group, formed in a Friedel–Crafts reaction between sulfonic acid groups and electron rich aromatic rings.26 By blending SPAES50 into a PBI–OO matrix, we believe that the crosslinking will mainly occur between PBI–OO and SPAES50, leading to the formation of a covalent network structure.PBI–OO is usually synthesized in Eaton's reagent, a mixture of P2O5 and methanesulfoinic acid (MSA). For the preparation of the blend membranes, PBI–OO may need to be washed with a slightly alkaline solution, to remove trace amounts of MSA (Fig. 2). Alternatively, the polymer can also be re-precipitated from NMP into water.
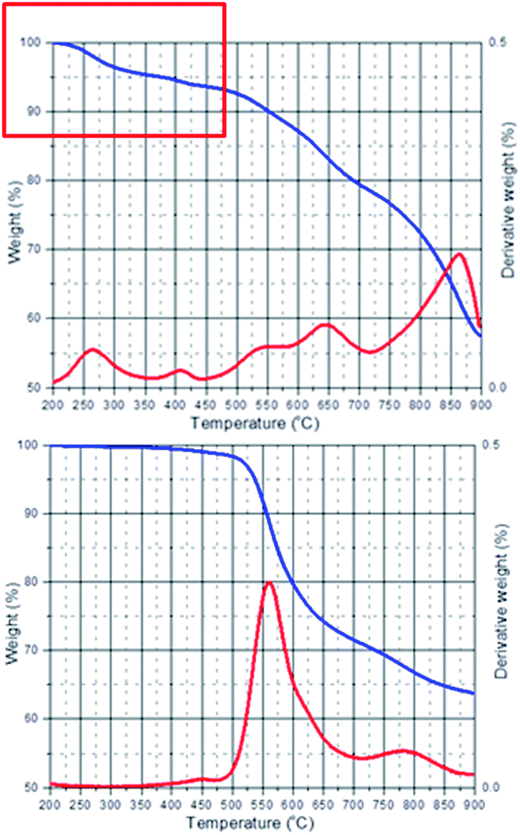 | ||
| Fig. 2 TGA curves of PBI–OO. Top: as received, with ca. 5 wt% methanesulfonic acid and bottom: after washing. | ||
3.2 Rapid screening: thermal curing between two metal plates
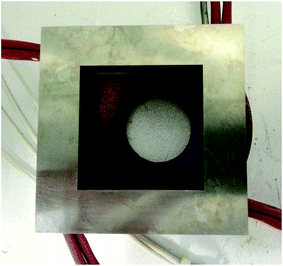
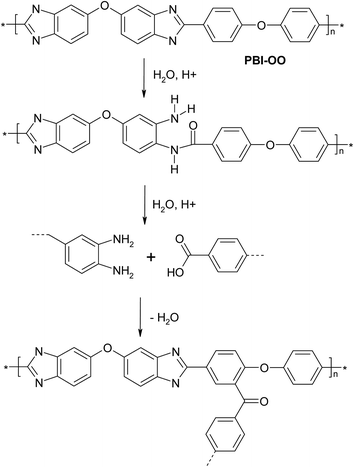
The crosslinking reaction, as shown in Fig. 1, will be mainly affected by the reaction temperature and time. To avoid oxidative side reactions, the reaction should be done in an inert atmosphere.26 For this purpose, and to get a quick overview over the crosslinking reaction, 4 cm long and 1 cm broad membrane stripes were put between two metal plates, one of which can be heated to a defined temperature (temperature sensor and 4 heat fingers, Fig. 3). To avoid oxidative side reactions, the setup was installed in a glovebox.First crosslinking experiments were done by heating membranes for 8 hours in an argon atmosphere. To evaluate if the reaction parameters lead to covalent crosslinking, the membrane samples were immersed in DMAc at 80 °C for 15 hours (Fig. 4). Another important parameter is the membrane flexibility, which was assessed qualitatively by bending samples. As shown in Table 1, if the temperature chosen is too high, membranes become brittle. It can also be seen that both PBI–OO and ionically crosslinked blend membranes of 80% PBI–OO and 20% SPAES50 are soluble without heat treatment, and that a temperature of about 180–240 °C is necessary to obtain insoluble, apparently covalently crosslinked, membranes. It is also possible to crosslink pure PBI–OO.1,13,23 The mechanism for this is not clear, but may involve carboxylic acid groups which are either present as unreacted end groups or available by hydrolytic degradation of imidazole rings, and react in a Friedel–Crafts reaction with a phenyl ring (Fig. 5). Hydrolysis of polybenzimidazole under alkaline conditions is a very fast process,21,29 but also hydrolysis of polybenzoxazole under neutral conditions is known, and discussed as a failure mode in bullet proof vests.30 Therefore, to assume hydrolysis of PBI as a first reaction step during crosslinking is not unreasonable. Alternative mechanisms could involve formation of amides, or radical mechanisms in the presence of air, leading also to the formation of carbonyl groups.23 Radical crosslinking in the absence of air is not expected, because the traditional synthesis of linear PBI involves heating to 260–400 °C for several hours under high vacuum and does not lead to crosslinked materials.1 Therefore, the presence of some water traces in the membrane seems to be vital. The finding that thermal crosslinking of washed, acid free PBI–OO in an inert atmosphere affords higher reaction temperatures than acid containing PBI–OO supports a hydrolysis-Friedel–Crafts reaction mechanism, which is acid catalysed. For crosslinking blend membranes in an argon atmosphere during a reaction time of 8 hours, temperatures of about 240–280 °C seem to be good, leading to covalently crosslinked, flexible membranes. For acid free PBI–OO, higher temperatures around 300 °C seem to be needed, risking brittleness. This brittleness, beginning at temperatures above 240 °C, could be a direct result of hydrolysis induced chain scission.
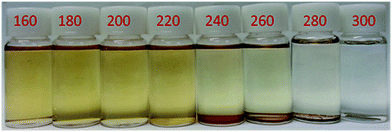 | ||
| Fig. 4 PBI–OO (washed) membrane samples immersed in DMAc at 80 °C for 15 h (as in Table 1, 2nd data column). | ||
![[thin space (1/6-em)]](https://www.rsc.org/images/entities/char_2009.gif) :
:![[thin space (1/6-em)]](https://www.rsc.org/images/entities/char_2009.gif) SPAES50 (80
SPAES50 (80![[thin space (1/6-em)]](https://www.rsc.org/images/entities/char_2009.gif) :
:![[thin space (1/6-em)]](https://www.rsc.org/images/entities/char_2009.gif) 20) membranes heated for 8 hours in an argon atmospherea
20) membranes heated for 8 hours in an argon atmospherea
| Solubility in DMAc at 80 °C for 15 h | Flexibility | |||||||
|---|---|---|---|---|---|---|---|---|
| PBI–OO, as received | PBI–OO, washed | Blend, SPAES in K+ form | Blend, SPAES in H+ form | PBI–OO, as received | PBI–OO, washed | Blend, SPAES in K+ form | Blend, SPAES in H+ form | |
| a +: soluble, ±: gelation and/or partially soluble, −: insoluble, O: flexible, ✗: brittle, n/a: not assessed. | ||||||||
| Untreated | + | + | + | + | O | O | O | O |
| 160 °C | + | + | + | n/a | O | O | n/a | n/a |
| 180 °C | ± | + | − | n/a | O | O | n/a | n/a |
| 200 °C | + | + | − | ± | O | O | O | O |
| 220 °C | − | + | − | ± | O | O | O | O |
| 240 °C | − | ± | − | − | ✗ | O | O | O |
| 260 °C | − | ± | − | − | ✗ | O | O | O |
| 280 °C | − | ± | − | − | ✗ | O | O | O |
| 300 °C | − | − | − | n/a | ✗ | ✗ | O | n/a |
| 320 °C | − | − | − | n/a | ✗ | ✗ | ✗ | n/a |
According to the van't Hoff rule, reactions should proceed at least 2 times faster when the temperature is increased by 10 °C. As shown in Table 2, washed PBI–OO membranes are brittle after 8 hours at 300 °C. Shortening the reaction time to 1–4 hours allows obtaining flexible, crosslinked membranes. Only at a reaction time of 30 minutes do the membrane samples start to be partially soluble, and a slight discoloration of the solution in which the membrane is immersed can be observed (Fig. 6). Very probably, an increased reaction temperature will allow to further reduce the reaction time, rendering the process also attractive for industrial production processes.
| Solubility in DMAc at 80 °C for 15 h | Flexibility | |
|---|---|---|
| a ±: partially soluble, −: insoluble, O: flexible, ✗: brittle. | ||
| 0.5 h | ± | O |
| 1 h | − | O |
| 2 h | − | O |
| 4 h | − | O |
| 8 h | − | ✗ |
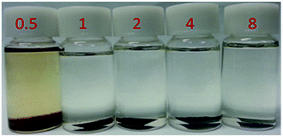 | ||
| Fig. 6 PBI–OO (washed) membrane samples immersed in DMAc at 80 °C for 15 h (as in Table 2, 1st data column). | ||
For the application, a most important parameter is the phosphoric acid (PA) uptake of membranes, which highly correlates with the proton conductivity, and inversely correlates with the tensile strength and Young's modulus of the doped membranes. For a 80![[thin space (1/6-em)]](https://www.rsc.org/images/entities/char_2009.gif) :
:![[thin space (1/6-em)]](https://www.rsc.org/images/entities/char_2009.gif) 20 blend membrane containing SPAES50 in the salt form, the PA content was analysed (Fig. 7). It can be seen that the PA uptake follows the expected trend: higher reaction temperature led to a higher degree of crosslinking, limiting the swelling of the membrane and thus the PA uptake. An interesting feature of the doping curves in Fig. 7 is the doping behavior of the pure PBI–OO membrane, which shows a local minimum at around 48 hours. PBI–OO is fully soluble in PA at temperatures larger than 160–200 °C, and it makes sense to assume also a slight solubility at room temperature. And indeed, all doping solutions developed a slight discoloration. Therefore, the curves in Fig. 7 represent two simultaneous processes: polymer dissolution, reducing the weight, and PA absorption, increasing the weight.
20 blend membrane containing SPAES50 in the salt form, the PA content was analysed (Fig. 7). It can be seen that the PA uptake follows the expected trend: higher reaction temperature led to a higher degree of crosslinking, limiting the swelling of the membrane and thus the PA uptake. An interesting feature of the doping curves in Fig. 7 is the doping behavior of the pure PBI–OO membrane, which shows a local minimum at around 48 hours. PBI–OO is fully soluble in PA at temperatures larger than 160–200 °C, and it makes sense to assume also a slight solubility at room temperature. And indeed, all doping solutions developed a slight discoloration. Therefore, the curves in Fig. 7 represent two simultaneous processes: polymer dissolution, reducing the weight, and PA absorption, increasing the weight.
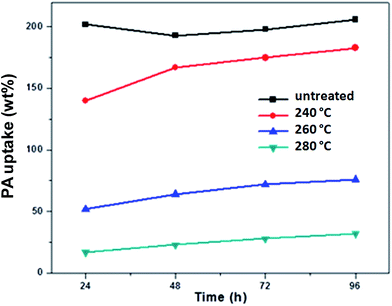 | ||
Fig. 7 PA uptake under ambient conditions for a 80![[thin space (1/6-em)]](https://www.rsc.org/images/entities/char_2009.gif) : :![[thin space (1/6-em)]](https://www.rsc.org/images/entities/char_2009.gif) 20 blend of PBI–OO and SPAES50 (K+ form), heated in an argon atmosphere for 8 hours. 20 blend of PBI–OO and SPAES50 (K+ form), heated in an argon atmosphere for 8 hours. | ||
3.3 Upscaling: thermal curing in an oven
For further testing, the curing process needed to be upscaled to larger membrane areas. This was done by heating membranes in an oven which can be flushed with nitrogen. Because the oven should not contain air during the curing step, the membranes were first inserted at room temperature, and then the oven was flushed with nitrogen and heated to the desired temperature. As a consequence, the parameters obtained by the rapid screening with heated metal plates in a glovebox could not be transferred directly to the oven process, and several new experiments had to be done. Furthermore, to investigate further into the role of the acidic blend component, blends with 2.5, 5, 10 and 20 wt% SPAES50 were prepared. As shown in Fig. 8, pure PBI–OO, doped at 80 °C for 24 hours, swells excessively, and totally loses its flat sheet membrane shape. Similarly, ionically crosslinked blend membranes with 2.5 wt%, and, to a lesser extent, 5.0 wt% SPAES50 swell so strongly that they form many wrinkles and folds. Membranes with 10–20 wt% SPAES50, on the other hand, absorbed large amounts of acid, but retained their shape.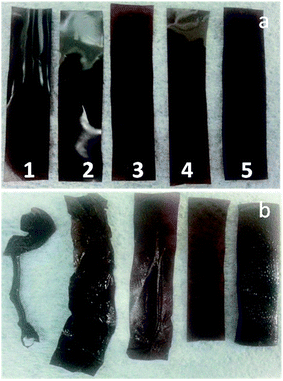 | ||
| Fig. 8 Photographic images of PBI–OO blend membranes with (1) 0, (2) 2.5, (3) 5, (4) 10 and (5) 20 wt% SPAES50, (a) before and (b) after PA doping at 80 °C for 24 h. | ||
Table 3 summarizes experimental parameters and the resulting material properties for different materials and processes. Entries 9/10 and 14/15 each represent nominally same batches, to test the reproducibility, which is in general given, with most values being within each other's error range. If we assume that insufficient crosslinking (too low curing temperatures) and too harsh curing conditions (degradative reactions) can lead to increased variation in the PA uptake, it is interesting to analyse the standard deviation of the PA uptake. Only in 6 cases the standard deviation is >10% of the PA uptake. In the case of entries 3–5 (PBI–OO), the reason could be the low, insufficient curing temperature, while in the case of entry 18 (blend), the short curing time. As already concluded from Table 1, pure PBI–OO seems to need a higher curing temperature than blend membranes. When the curing temperature for PBI–OO is increased from 300 to 320 °C, the PA uptake shows a standard deviation of only 6% (entry 6). For entry 17 (blend), the reason may be that degradation already sets in when the material is cured at 320 °C for 2.5 hours. In conclusion, the curing temperature and time needs to be optimised for each material, considering parameters like flexibility, solubility, PA uptake, PA uptake variation between samples, conductivity and the mechanical properties.
| Sample number | Polymer blend composition PBI–OO![[thin space (1/6-em)]](https://www.rsc.org/images/entities/char_2009.gif) : :![[thin space (1/6-em)]](https://www.rsc.org/images/entities/char_2009.gif) SES SES |
Heat treatment conditions (temperature, gas, time) | PA doping conditions | PA uptake (wt%) | Tensile strength (MPa) | Young modulus (MPa) | Elongation at break (%) | Performance indicator |
|---|---|---|---|---|---|---|---|---|
| 1 | 100![[thin space (1/6-em)]](https://www.rsc.org/images/entities/char_2009.gif) : :![[thin space (1/6-em)]](https://www.rsc.org/images/entities/char_2009.gif) 0 0 |
No heat treatment | 80 °C 48 h | Excessive swelling | — | — | — | — |
| 2 | 100![[thin space (1/6-em)]](https://www.rsc.org/images/entities/char_2009.gif) : :![[thin space (1/6-em)]](https://www.rsc.org/images/entities/char_2009.gif) 0 0 |
No heat treatment | 30 °C 48 h | 361 ± 17 | 5.93 ± 1.3 | 78.14 ± 12 | 102 ± 21 | 4.3 |
| 3 | 100![[thin space (1/6-em)]](https://www.rsc.org/images/entities/char_2009.gif) : :![[thin space (1/6-em)]](https://www.rsc.org/images/entities/char_2009.gif) 0 0 |
300 °C/Ar/2.5 h (metal plates) | 90 °C 48 h | 582 ± 118 | 2.32 ± 0.3 | 75.23 ± 9 | 8 ± 2 | 2.7 |
| 4 | 100![[thin space (1/6-em)]](https://www.rsc.org/images/entities/char_2009.gif) : :![[thin space (1/6-em)]](https://www.rsc.org/images/entities/char_2009.gif) 0 0 |
300 °C/N2/2.5 h | 90 °C 48 h | 903 ± 357 | 2.96 ± 0.8 | 29.27 ± 9 | 52 ± 35 | 5.3 |
| 5 | 100![[thin space (1/6-em)]](https://www.rsc.org/images/entities/char_2009.gif) : :![[thin space (1/6-em)]](https://www.rsc.org/images/entities/char_2009.gif) 0 0 |
300 °C/N2/2.5 h | 80 °C 48 h | 649 ± 142 | 4.68 ± 2.3 | 65.03 ± 19 | 65 ± 26 | 6.1 |
| 6 | 100![[thin space (1/6-em)]](https://www.rsc.org/images/entities/char_2009.gif) : :![[thin space (1/6-em)]](https://www.rsc.org/images/entities/char_2009.gif) 0 0 |
320 °C/N2/2.5 h | 80 °C 24 h | 505 ± 30 | 6.4 ± 2.4 | 84.02 ± 23 | 28 ± 7 | 6.5 |
| 7 | 97.5![[thin space (1/6-em)]](https://www.rsc.org/images/entities/char_2009.gif) : :![[thin space (1/6-em)]](https://www.rsc.org/images/entities/char_2009.gif) 2.5 2.5 |
290 °C/N2/2.5 h | 80 °C 48 h | 459 ± 39 | 5.35 ± 0.90 | 104.27 ± 36 | 39 ± 6 | 4.9 |
| 8 | 95![[thin space (1/6-em)]](https://www.rsc.org/images/entities/char_2009.gif) : :![[thin space (1/6-em)]](https://www.rsc.org/images/entities/char_2009.gif) 5 5 |
No heat treatment | 80 °C 24 h | 419 ± 65 | 3.4 ± 0.6 | 85.49 ± 11 | 15 ± 7 | 2.8 |
| 9 | 95![[thin space (1/6-em)]](https://www.rsc.org/images/entities/char_2009.gif) : :![[thin space (1/6-em)]](https://www.rsc.org/images/entities/char_2009.gif) 5 5 |
280 °C/N2/2.5 h | 90 °C 48 h | 329 ± 10 | 10.05 ± 3 | 151.40 ± 8 | 55 ± 25 | 6.6 |
| 10 | 95![[thin space (1/6-em)]](https://www.rsc.org/images/entities/char_2009.gif) : :![[thin space (1/6-em)]](https://www.rsc.org/images/entities/char_2009.gif) 5 5 |
280 °C/N2/2.5 h | 90 °C 48 h | 325 ± 19 | 8.57 ± 1.7 | 168.40 ± 10 | 30 ± 21 | 5.6 |
| 11 | 95![[thin space (1/6-em)]](https://www.rsc.org/images/entities/char_2009.gif) : :![[thin space (1/6-em)]](https://www.rsc.org/images/entities/char_2009.gif) 5 5 |
280 °C/N2/2.5 h | 80 °C 48 h | 494 ± 26 | 4.97 ± 0.84 | 75.94 ± 4 | 33 ± 30 | 4.9 |
| 12 | 95![[thin space (1/6-em)]](https://www.rsc.org/images/entities/char_2009.gif) : :![[thin space (1/6-em)]](https://www.rsc.org/images/entities/char_2009.gif) 5 5 |
320 °C/N2/0.5 h | 80 °C 24 h | 445 ± 3 | 8.6 ± 0.7 | 70.06 ± 13 | 20 ± 2 | 7.7 |
| 13 | 90![[thin space (1/6-em)]](https://www.rsc.org/images/entities/char_2009.gif) : :![[thin space (1/6-em)]](https://www.rsc.org/images/entities/char_2009.gif) 10 10 |
No heat treatment | 80 °C 24 h | 380 ± 32 | 4.33 ± 0.83 | 57.03 ± 15 | 60 ± 16 | 3.3 |
| 14 | 90![[thin space (1/6-em)]](https://www.rsc.org/images/entities/char_2009.gif) : :![[thin space (1/6-em)]](https://www.rsc.org/images/entities/char_2009.gif) 10 10 |
260 °C/N2/2.5 h | 90 °C 48 h | 385 ± 10 | 9.10 ± 0.24 | 73.65 ± 19 | 113 ± 6 | 7.0 |
| 15 | 90![[thin space (1/6-em)]](https://www.rsc.org/images/entities/char_2009.gif) : :![[thin space (1/6-em)]](https://www.rsc.org/images/entities/char_2009.gif) 10 10 |
260 °C/N2/2.5 h | 90 °C 48 h | 400 ± 33 | 5.84 ± 1.74 | 95.16 ± 34 | 36 ± 27 | 4.7 |
| 16 | 90![[thin space (1/6-em)]](https://www.rsc.org/images/entities/char_2009.gif) : :![[thin space (1/6-em)]](https://www.rsc.org/images/entities/char_2009.gif) 10 10 |
260 °C/N2/2.5 h | 80 °C 48 h | 400 ± 29 | 5.86 ± 0.94 | 99.48 ± 28 | 62 ± 30 | 4.7 |
| 17 | 90![[thin space (1/6-em)]](https://www.rsc.org/images/entities/char_2009.gif) : :![[thin space (1/6-em)]](https://www.rsc.org/images/entities/char_2009.gif) 10 10 |
320 °C/N2/2.5 h | 80 °C 24 h | 454 ± 57 | 7.7 ± 1.8 | 85.25 ± 19 | 15 ± 9 | 7.0 |
| 18 | 80![[thin space (1/6-em)]](https://www.rsc.org/images/entities/char_2009.gif) : :![[thin space (1/6-em)]](https://www.rsc.org/images/entities/char_2009.gif) 20 20 |
220 °C/N2/2.5 h | 90 °C 48 h | 313 ± 31 | 7.13 ± 0.24 | 106.16 ± 49 | 44 ± 24 | 4.5 |
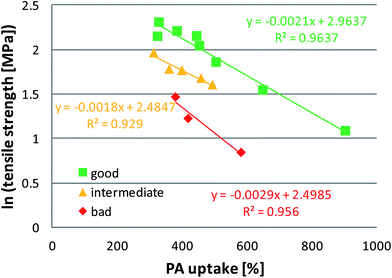
In order to describe the trade-off relationship between the PA uptake and tensile strength, which should be pushed to overall higher values for good materials, we introduce a “performance indicator” in Table 3. It is calculated as
| Performance indicator = (PA uptake) × (tensile strength) × 2/1000. |
Roughly, materials with an indicator below 3.5 are rather bad materials, values <5 indicate intermediate materials, and >5 indicates potentially good materials. This is a very crude approach to categorize the materials as it does not include important properties like the conductivity and probably does not weigh the available data correctly. However, when the tensile strength data from Table 3 are plotted logarithmically against the PA uptake, the materials from Table 3 seem to fall into 3 categories, which correlate with the performance indicator (Fig. 9). It is seen that blend membranes without heat treatment and the PBI–OO membrane treated between metal plates have a disadvantageous relationship between the PA uptake and tensile strength (red diamonds). Untreated PBI–OO and some blend membranes are in the middle range (yellow triangles). All membranes with a performance indicator >5 fall into the best category (green squares), and are heat treated. For comparison, commercial meta-PBI shows indicator values between 4.2 and 5.6 in the literature.31,32 Future good materials should provide values above the green line. An alternative to the tensile strength based performance indicator could be a performance indicator which is calculated in the same way but based on the Young modulus. In that case, materials with an indicator above 80 may be considered as good, and entries 5, 6, 9 and 10 would be considered as good materials according to both performance indicators.
The sample with the highest performance indicator was sample 12. Therefore, it was tested in the fuel cell (Fig. 10). The performance is comparable to that of cells using the standard material meta-PBI, with a peak power density of ca. 200 mW cm−2.33 The test shows clearly that the membranes are gas tight (high open circuit voltage) and can operate in a fuel cell. By using an improved cell design, it will be possible to increase the performance. Details will be shown in another paper.
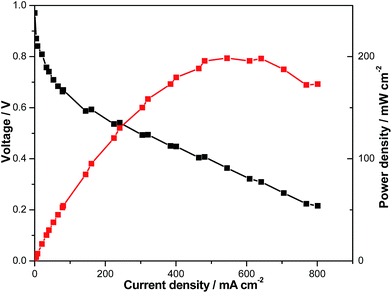 | ||
| Fig. 10 Polarization curves of the membrane (sample number 12 from Table 3, thickness after doping = 130 μm) at 160 °C, cell area 7.84 cm2, non-humidified, after 24 h activation at 160 °C, 0.2 A cm−2. | ||
4. Conclusions
It is known that meta-PBI membranes can be crosslinked by heating to temperatures of 350–500 °C.1,13,23 We suggest that this crosslinking mechanism involves first hydrolysis of imidazole groups to diamine and acid, followed by a Friedel–Crafts reaction between the carboxylic acid groups and phenyl rings of PBI. A detailed analysis to verify this mechanism could not be done using our methods, because crosslinked materials typically have only a low concentration of crosslinking groups, too low to be analysed by using standard IR, and cannot be dissolved for high resolution solution state nmr. In one reference, meta-PBI was dried at 200 °C for 3 days before crosslinking.23 This is a condition which would already infer crosslinking in the blend membranes prepared in this work, which already provide sulfonic acid groups for Friedel–Crafts reactions. In combination, our data and the literature indicate that the addition of a sulfonated component and an electron rich aromatic system allows to thermally crosslink PBI based membranes at lower temperatures and/or shorter reaction times, avoiding hydrolytic chain scission events.When the mechanical properties are plotted logarithmically against the PA uptake, a linear trend can be observed. By crosslinking it is possible to shift this trade-off relationship towards more advantageous values. By a fuel cell test, we show for the first time that sulfone crosslinked blend membranes can be used in fuel cells. A more detailed analysis is ongoing and will be published later.
Acknowledgements
The authors received funding from the Korea-Denmark green technology cooperative research program (KIST, GTC).References
- H. Vogel and C. S. Marvel, J. Polym. Sci., 1961, 50, 511–539 CrossRef CAS
.
- J. S. Wainright, J. T. Wang, D. Weng, R. F. Savinell and M. Litt, J. Electrochem. Soc., 1995, 142, L121–L123 CrossRef CAS
.
- J. A. Asensio and P. Gomez-Romero, Fuel Cells, 2005, 5, 336–343 CrossRef CAS
.
- Q. Li, J. O. Jensen, R. F. Savinell and N. J. Bjerrum, Prog. Polym. Sci., 2009, 34, 449–477 CrossRef CAS
.
-
High Temperature Polymer Electrolyte Membrane Fuel Cells – Approaches, Status and Perspective, ed. Q. Li, D. Aili, H. A. Hjuler and J. O. Jensen, Springer, 2015, ISBN 978-3-319-17081-7, DOI:10.1007/978-3-319-17082-4
.
- L. Xiao, H. Zhang, E. Scanlon, L. S. Ramanathan, E.-W. Choe, D. Rogers, T. Apple and B. C. Benicewicz, Chem. Mater., 2005, 17, 5328–5333 CrossRef CAS
.
- X. Chen, G. Qian, M. A. Molleo, B. C. Benicewicz and H. J. Ploehn, J. Polym. Sci., Part B: Polym. Phys., 2015, 53, 1527–1538 CrossRef CAS
.
- F. Mack, K. Aniol, C. Ellwein, J. Kerres and R. Zeis, J. Mater. Chem., 2015, 3, 10864–10874 RSC
.
- Q. Li, H. C. Rudbeck, A. Chromik, J. O. Jensen, C. Pan, T. Steenberg, M. Calverley, N. J. Bjerrum and J. Kerres, J. Membr. Sci., 2010, 347, 260–270 CrossRef CAS
.
- J. A. Kerres, D. Xing and F. Schönberger, J. Polym. Sci., Part B: Polym. Phys., 2006, 44, 2311–2326 CrossRef CAS
.
- D. Aili, M. K. Hansen, C. Pan, Q. Li, E. Christensen, J. O. Jensen and B. J. Bjerrum, Int. J. Hydrogen Energy, 2011, 36, 6985–6993 CrossRef CAS
.
- J. Kerres, F. Schönberger, A. Chromik, T. Häring, Q. Li, J. O. Jensen, C. Pan, P. Noyé and N. J. Bjerrum, Fuel Cells, 2008, 8, 175–187 CrossRef CAS
.
- D. Aili, L. N. Cleemann, Q. Li, J. O. Jensen, E. Christensen and N. J. Bjerrum, J. Mater. Chem., 2012, 22, 5444–5453 RSC
.
- M. Han, G. Zhang, Z. Liu, S. Wang, M. Li, J. Zhu, H. Li, Y. Zhang, C. M. Lew and H. Na, J. Mater. Chem., 2011, 21, 2187–2193 RSC
.
- S. Yu and B. C. Benicewicz, Macromolecules, 2009, 42, 8640–8648 CrossRef CAS
.
- Y. S. Guan, H. T. Pu, M. Jin, Z. H. Chang and D. C. Wan, Fuel Cells, 2010, 10, 973–982 CrossRef CAS
.
- H. Luo, H. Pu, Z. Chang, D. Wan and H. Pan, J. Mater. Chem., 2012, 22, 20696–20705 RSC
.
- S. K. Kim, S. W. Choi, W. S. Jeon, J. O. Park, T. Ko, H. Chang and J. C. Lee, Macromolecules, 2012, 45, 1438–1446 CrossRef CAS
.
- J. Yang, D. Aili, Q. Li, L. N. Cleemann, J. O. Jensen, N. J. Bjerrum and R. He, ChemSusChem, 2013, 6, 275–282 CrossRef CAS PubMed
.
- C. H. Shen, L. C. Jheng, S. L. C. Hsu and J. Tse-Wei Wang, J. Mater. Chem., 2011, 21, 15660–15665 RSC
.
- D. Henkensmeier, H. Cho, H.-J. Kim, C. Nunes Kirchner, J. Leppin, A. Dyck, J. H. Jang, E. Cho, S.-W. Nam and T.-H. Lim, Polym. Degrad. Stab., 2012, 97, 264–272 CrossRef CAS
.
- W. Germer, J. Leppin, C. Nunes-Kirchner, D. Henkensmeier and A. Dyck, Procedia Eng., 2012, 44, 1310–1314 CrossRef
.
- P. Musto, F. E. Karasz and W. J. MacKnight, Polymer, 1993, 34, 2934–2945 CrossRef CAS
.
- B. Maranesi, H. Hou, R. Polini, E. Sgreccia, G. Alberti, R. Narducci, P. Knauth and M. L. Di Vona, Fuel Cells, 2013, 13, 107–117 CrossRef CAS
.
- M. Luisa Di Vona, E. Sgreccia, S. Licoccia, G. Alberti, L. Tortet and P. Knauth, J. Phys. Chem. B, 2009, 113, 7505–7512 CrossRef PubMed
.
- N. Nambi Krishnan, D. Henkensmeier, J. H. Jang, S. Hink, H.-J. Kim, S.-W. Nam and T.-H. Lim, J. Membr. Sci., 2014, 454, 174–183 CrossRef
.
- Y. Zhang, J.-D. Kim and K. Miyatake, J. Appl. Polym. Sci., 2016 DOI:10.1002/app.44218
.
- Q. Li, R. He, R. W. Berg, H. A. Hjuler and N. J. Bjerrum, Solid State Ionics, 2004, 168, 177–185 CrossRef CAS
.
- J. O. Jensen, D. Aili, M. K. Hansen, Q. Li, N. J. Bjerrum and E. Christensen, ECS Trans., 2014, 64, 1175–1184 CrossRef CAS
.
- G. A. Holmes, K. Rice and C. R. Snyder, J. Mater. Sci., 2006, 41, 4105–4116 CrossRef CAS
.
- J. S. Yang, L. N. Cleemann, T. Steenberg, C. Terkelsen, Q. F. Li, J. O. Jensen, H. A. Hjuler, N. J. Bjerrum and R. H. He, Fuel Cells, 2014, 14, 7–15 CrossRef CAS
.
- J. Yang, Q. Li, L. N. Cleemann, C. Xu, J. O. Jensen, C. Pan, N. J. Bjerrum and R. He, J. Mater. Chem., 2012, 22, 11185–11195 RSC
.
- S. A. Grigoriev, N. V. Kuleshov, A. S. Grigoriev and P. Millet, J. Fuel Cell Sci. Technol., 2015, 12, 031004 CrossRef
.
| This journal is © The Royal Society of Chemistry 2017 |


