One-pot carbonization enrichment of nitrogen in microporous carbon spheres for efficient CO2 capture†
Lei
Liu
ab,
Zheng-Hu
Xie
c,
Qing-Fang
Deng
c,
Xiao-Xu
Hou
c and
Zhong-Yong
Yuan
*ac
aNational Institute for Advanced Materials, School of Materials Science and Engineering, Nankai University, Tianjin 300350, China. E-mail: zyyuan@nankai.edu.cn
bSchool of Materials Science and Engineering, Shandong University of Science and Technology, Qingdao 266590, China
cKey Laboratory of Advanced Energy Materials Chemistry (Ministry of Education), Collaborative Innovation Center of Chemical Science and Engineering (Tianjin), College of Chemistry, Nankai University, Tianjin 300071, China
First published on 24th November 2016
Abstract
Nitrogen-enriched porous carbon spheres are synthesized through a one-pot carbonization process by decorating the as-made melamine–formaldehyde spheres with resorcinol and hexamethylenetetramine, exhibiting high surface areas of 518–828 m2 g−1 with a micropore size of 0.5–1.3 nm. Due to the successful incorporation of large amounts of highly dispersed N (4.3–10.8 wt%) into the carbon matrix, the synthesized microporous carbon spheres, having a large amount of narrow micropores (<1.0 nm), show a good capacity to store CO2. At 1 atm, the equilibrium CO2 capture capacities of the obtained microporous carbons are in the range of 4.0–5.4 mmol g−1 at 0 °C and 3.0–4.3 mmol g−1 at 25 °C, revealing their great promise for practical CO2 capture applications. More importantly, the CO2 uptake as large as 2.76 mmol g−1 can be obtained at 75 °C, suggesting the significant promise of the synthesized carbon materials for CO2 capture and separation.
Introduction
The continuous rise of the atmospheric CO2 concentration and its linkage to climate change demand an urgent technological solution to reduce CO2 emissions.1 Among all of the research efforts, the capture of CO2 by adsorption/sorption on porous sorbents has been considered as one of the most promising approaches.2–5Porous carbon-based sorbents present several advantages as CO2 adsorbents: low cost, high adsorption capacity, ease of regeneration and no degradation by moisture.6–8 However, CO2 adsorption on carbons and some other porous materials is generally a weak physisorption process, which means that the uptake capacity can be low with poor selectivity and great sensitivity to temperature. For this reason, enhancing the adsorbate–adsorbent interaction and the selectivity for CO2 capture and storage in solid-state stores, via increase of the internal area of adsorbents or functionalization of the adsorbing surfaces have received great concerns.
An ideal material for CO2 capture must have the following features. First, it must have a porous architecture that allows for efficient use of the pore space. The CO2 capture capacity of carbons essentially corresponds to a micropore volume-filling process,9,10 and the maximum CO2 retention capacity at 1 bar and 298 K can only be found for carbons with a high micropore volume arising from pores less than 1.0 nm.11–13 Second, it should have strong interaction with the adsorbate molecules (CO2) to ensure an improved selectivity and adsorption capacity. As a result of the acidic properties of carbon dioxide, basic nitrogen groups were usually chosen to incorporate into carbon frameworks.7,14,15 To date, porous carbons with amine groups used for CO2 capture can be prepared by post-synthetic amine modification or in situ fabrication.16–18 As reported in previous research, the impregnated samples appear to leach amine after subsequent runs, while for the carbons obtained directly from nitrogen-rich precursors, the assistance of hard templates is usually needed to produce porous structures.19,20 Although a high CO2 capture capacity (4.4–4.6 mol g−1 at 25 °C and 1 bar) can be gained by phenolic resin-based carbon spheres, an additional activation procedure by KOH13 or activating gas21,22 is required to enlarge their microporous surface area (higher than 2000 m2 g−1).
Significantly, both hard templates and the activation procedure make the process time-consuming and costly. Moreover, as for the nitrogen-doped porous carbons based on polycondensation reactions, the CO2 uptake is usually lower than 4.0 mmol g−1 at 25 °C and 1 bar.22,23 The surface area and nitrogen content depend highly on the conditions during the synthesis and the carbonization process.24,25 Hence, it still remains a major challenge to develop economically viable porous carbons for highly effective CO2 capture.
In this work, nitrogen enriched microporous carbon spheres were designed by the combination of the porosity of resol resin and the high nitrogen content of melamine resin. The as-made melamine–formaldehyde (MF) resin spheres were used as the template for the polymerization of resorcinol and hexamethylenetetramine (HMT). Without additional steps, after carbonization, microporous N-doped carbon spheres were obtained, possessing a high nitrogen content of 4.3–10.8 wt% and a large micropore surface area with a narrow micropore size smaller than 1.0 nm, which is promising for CO2 capture.
Experimental
Synthesis
Characterization
Scanning electron microscopy (SEM) was carried out on a Shimadzu SS-550 microscope at 15 keV. Transmission electron microscopy (TEM) measurements were performed on a FEI Tecnai F20 microscope at 200 kV. All samples subjected to TEM measurements were ultrasonically dispersed in ethanol and drop-cast onto copper grids covered with a carbon film. X-ray photoelectron spectroscopy (XPS) measurements were performed on a Kratos Axis Ultra DLD (delay line detector) spectrometer equipped with a monochromatic Al Kα X-ray source (1486.6 eV). All XPS spectra were recorded using an aperture slot of 300 μm × 700 μm, survey spectra were recorded with a pass energy of 160 eV, and high-resolution spectra with a pass energy of 40 eV. Fourier transform infrared (FT-IR) spectra were collected on a Nicolet Fourier spectrophotometer, using the KBr pellet technique. Nitrogen adsorption–desorption isotherms were measured on a Quantachrome Autosorb-1MP sorption analyzer at −196 °C. Before measurements, the samples were degassed at 200 °C for at least 6 h. The specific surface area (SBET) was calculated according to the Brunauer–Emmett–Teller (BET) method (0.01 < P/P0 < 0.1), the pore size distribution was derived from the adsorption branch of isotherms using the non-local density functional theory method, and the total pore volume (Vtotal) was estimated from the adsorbed amount at a relative pressure P/P0 of 0.980. The micropore surface area and micropore volume were obtained via t-plot analysis. Narrow micropores were analyzed using the Dubinin–Radushkevich equation given as W/W0 = exp{−(A/βE0)2} from the CO2 adsorption isotherms at 0 °C (assuming an affinity coefficient (β) of 0.36). The average pore width is calculated by L0 (nm) = 10.8/(E0 − 11.4 kJ mol−1), while the surface area of micropores is determined by Smicro (m2 g−1) = 2000W0 (cm3 g−1)/L0 (nm).27 Thermogravimetric analysis (TGA) curves were recorded on a TA SDT Q600 analyzer under a constant air flow of 100 mL min−1 with a temperature rate of 10 °C min−1.CO2 capture measurements
The CO2 adsorption isotherms of the materials were measured using a Quantachrome Autosorb-1MP equipment at 0–75 °C. Each sample was outgassed for 12 h at 200 °C to remove the guest molecules from the pores before starting the adsorption measurements and then cooled down to room temperature, followed by the introduction of CO2 into the system.Results and discussion
Material synthesis and characterization
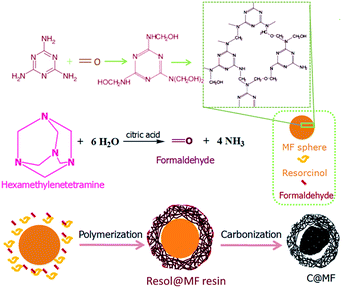
Nitrogen-doped microporous carbon spheres were prepared through a one-pot carbonization method, as shown in Fig. 1. Melamine resin spheres were first prepared by the polycondensation reaction of melamine and formaldehyde. The methylolmelamine formation reaction first occurred when mixing melamine and formaldehyde under basic conditions (M–NH2 + CH2O = M–NHCH2OH, where M–NH2 represents melamine).28,29 Then, melamine–formaldehyde oligomeric derivatives were produced by the formation of two different types of bridges between triazine rings, namely, a methylene ether bridge (M–NHCH2OH + HOCH2HN–M = M–NHCH2OCH2NH–M + H2O)30 and a methylene bridge (M–NHCH2OH + H2N–M = M–NHCH2NH–M + H2O).31 A sequentially cross-linked network was formed by the polycondensation reaction. The as-made MF spheres were then decorated with resorcinol and HMT through a sol–gel process. The hydrolysis of HMT under acidic conditions produced formaldehyde and ammonia.26,32,33 Resorcinol reacts with formaldehyde to form numerous hydroxymethyl-substituted and/or aminomethyl-substituted species, and further crosslinking of these species on the surface of MF spheres resulted in the formation of resol@MF resin composites (Fig. 1). Nitrogen enriched microporous carbon spheres were then obtained after heating the prepared resol@MF composites under an inert gas of nitrogen. The unique morphology of the synthesized MF spheres and microporous carbon spheres was characterized by using SEM and TEM images (Fig. 2). As shown in Fig. 2a, the obtained carbon spheres by the pyrolysis of spherical micrometer-sized MF resin particles are smooth-surfaced and highly monodisperse, and their diameters are ranged between 700 and 1200 nm, which is consistent with the TEM images (Fig. 2c). After decorating with HMT and resorcinol, the SEM image in Fig. 2b clearly shows that the surface of MF became rough. Fig. 2d and e display TEM images of the obtained C@MF-600, from which the spherical morphology of the sphere sample can be clearly identified. The HRTEM image (Fig. 2f) further proves that C@MF-600 carbon spheres have an amorphous framework which are not homogeneous in composition, and possess micropore channels with diameters less than 1.0 nm.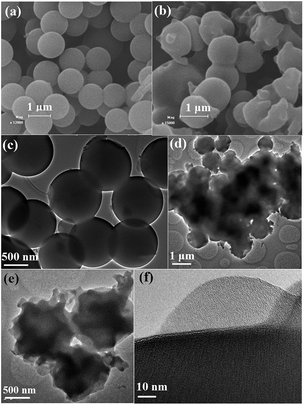 | ||
| Fig. 2 SEM images of (a) C-MF-600 and (b) C@MF-600, and TEM images of (c) C-MF-600 and (d–f) C@MF-600. | ||
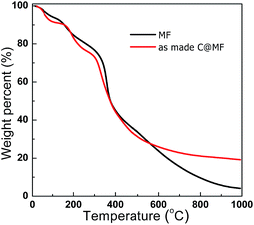
The TG analysis was performed to monitor the decomposition performances of the MF resin and as-made C@MF. Fig. 3 shows the TG-DTG profiles of the synthesized MF resin and as-made C@MF. The weight loss between 20 and 100 °C in the TG curves of the MF resin could be attributed to the loss of surface adsorbed water. The weight loss of 20 wt% between 100 and 250 °C in the TG curves is mainly due to the initial scission of methylene bridges, water evaporation from the interior of particles, degradation of residual methylol groups, decarbonylation of free formaldehyde, and sublimation of melamine.34 The weight loss of approximately 40 wt% between 260 and 460 °C is mainly caused by decomposition reactions of the MF resin, that is, scission of ether or methylene bridges, degradation of residual methylol groups, or sublimation of melamine, accompanied by evolution of formaldehyde, carbon monoxide, and an additional loss of water.35 A further increase in the temperature allows the decomposition to continue accompanied by a weight loss of about 30 wt% above 460 °C, which is due to the degradation of the external links of the triazine rings such as continuous scission of methylene bridges, and subsequent inter-ring condensation to melem, melam, and higher condensation products of melamine, and further to ammonia and hydrogen cyanide during the above-mentioned reactions. Finally, about 10.3 wt% carbon residue remained after annealing at 800 °C. Compared with the DTG curve of the MF resin, the weight loss below 500 °C in the DTG curve of the as-made C@MF could be attributed to the decomposition reactions of the MF resin, and condensation and decomposition of the resol polymer.36 In the TG profile of the as-made C@MF, the weight loss of approximately 30 wt% between 525 and 600 °C as well as above 600 °C is due to the framework degradation and carbonization, which release small molecules and other fragments. At the end, approximately 21.6 wt% of carbon residue was left after pyrolysis at 800 °C.
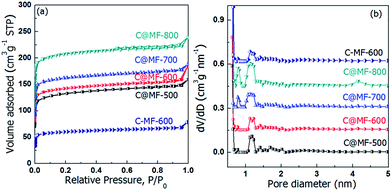
The porosity of the carbons was analyzed using nitrogen sorption at 77 K and the textural properties are summarized in Table 1. As shown in Fig. 4, all of the isotherms display type I curves with well-defined capillary condensation steps at a very low relative pressure (P/P0) below 0.08, indicating the formation of small pores with a diameter of approximately 1.0 nm. Sample C-MF-600 exhibits a much lower BET surface area (148 m2 g−1) and pore volume (0.10 cm3 g−1) than C@MF-x. Carbonization at elevated temperatures led to a significant increase in the nitrogen uptake of C@MF-x, indicating well-developed porosity due to the decomposition and release of small molecules enveloped in the micropores. The BET surface area and total pore volume increase with the carbonization temperature (Table 1), i.e. from 518 m2 g−1 and 0.25 cm3 g−1 for C@MF-500 to 828 m2 g−1 and 0.37 cm3 g−1 for C@MF-800. In addition, the samples C@MF-x have a much higher proportion of the micropore surface area, which is calculated to be 90.2%, 92% and 93.4% for C@MF-600, C@MF-700, and C@MF-800 respectively. From the pore size distribution curves, it can be clearly seen that C@MF-500 and C@MF-600 have a pore size distribution curves centered at 1.2 nm, proving their microporous character. Another new peak at 0.8 nm was observed when the carbonization temperature was higher than 700 °C for C@MF-x.
| Samples | From N2 adsorption at −196 °C | From CO2 adsorption at 0 °C | Chemical compositions | |||||||||
|---|---|---|---|---|---|---|---|---|---|---|---|---|
| S BET (m2 g−1) | S micro (m2 g−1) | V total (cm3 g−1) | V micro (cm3 g−1) | E 0 (kJ mol−1) | W 0 (cm3 g−1) | L 0 (nm) | S micro (m2 g−1) | C (wt%) | H (wt%) | O (wt%) | N (wt%) | |
| a The BET surface area, SBET, was calculated using adsorption data in a relative pressure range P/P0 = 0.05–0.24. b The micropore volume Vmicro and micropore surface area Smicro were estimated by the t-plot method. | ||||||||||||
| C-700 | 645 | 552 | 0.32 | 0.25 | 30.4 | 0.24 | 0.54 | 869 | 91.9 | 1.3 | 4.6 | 2.0 |
| C-MF-600 | 148 | 122 | 0.10 | 0.09 | 31.3 | 0.09 | 0.54 | 319 | 58.33 | 3.15 | 17.05 | 21.5 |
| C@MF-500 | 518 | 458 | 0.25 | 0.20 | 32.9 | 0.19 | 0.50 | 777 | 66.16 | 3.22 | 19.87 | 10.8 |
| C@MF-600 | 558 | 504 | 0.28 | 0.22 | 31.9 | 0.24 | 0.53 | 893 | 68.69 | 3.02 | 18.54 | 9.8 |
| C@MF-700 | 648 | 596 | 0.29 | 0.25 | 32.0 | 0.29 | 0.52 | 959 | 70.43 | 2.96 | 18.69 | 7.9 |
| C@MF-800 | 828 | 774 | 0.37 | 0.32 | 30.4 | 0.32 | 0.57 | 1122 | 72.59 | 2.89 | 19.82 | 4.3 |
It has been reported that the reaction of melamine with formaldehyde leads at first to hydroxymethylation, where hydrogen atoms in the NH2 groups of the melamine are substituted by methylol groups (–CH2OH), followed by crosslinking of the resulting methylolmelamines. Depending on the degree of crosslinking, a couple of different bonds can appear,37 such as ether linkages (–CH2–O–CH2–), amino groups (–NH2), –CH–CH2–, –NR3, methylene bridges (![[double bond, length as m-dash]](https://www.rsc.org/images/entities/char_e001.gif) N–CH2–N
N–CH2–N![[double bond, length as m-dash]](https://www.rsc.org/images/entities/char_e001.gif) ), and hydroxyl groups (–CH2–OH). In the FT-IR spectrum of the MF resin (Fig. 5), stretching of the hydroxyl groups at 3550–3200 cm−1 overlaps with the NH2 vibration, whereas the absorption peaks at 1570 cm−1 are due to the C–N–C bonds of the triazine ring itself, caused by “quadrant stretching”.35 The peaks at 1351 and 1172 cm−1 can be attributed to C–N in –CH2–NH–CH2– or –CH2–NH–CH3. The stretching at 1010 cm−1 corresponds to the C–O bonds in –CH2–O–CH2–. The broad medium-strong bands between 950 and 650 cm−1 correspond to the out-of-plane N–H deformation vibrations. After annealing at temperatures above 600 °C, all infrared absorption signals almost disappeared. It can be deduced that most of the triazine rings and other possibly formed organic compounds have been decomposed and the MF resin has been mostly transformed into nitrogen enriched carbon. This was also confirmed in the literature, which indicates that the rupture of the triazine rings takes place between 600 and 675 °C.38 As for the sample C@MF-500, the strong and broad peak at 1500–1600 cm−1 is attributed to the C–N–C bonds of the triazine ring and the carbon–carbon bond stretching of 1,2,4- and 1,2,6-trisubstituted and phenyl alkyl ether-type substituted aromatic ring structures,39,40 confirming the existence of MF and resol resin species in the polymeric framework. With increasing the carbonization temperature, the bands mentioned above became weak and then disappeared, indicating the variation of the polymeric framework to carbon. As for C@MF-700, the bands at 1600 cm−1 which can be ascribed to the in-plane N–H deformation vibration strengthened. This can be interpreted as the activation of the carbon framework by N-rich alkaline gases such as NH3 released from the rupture of triazine rings.35
), and hydroxyl groups (–CH2–OH). In the FT-IR spectrum of the MF resin (Fig. 5), stretching of the hydroxyl groups at 3550–3200 cm−1 overlaps with the NH2 vibration, whereas the absorption peaks at 1570 cm−1 are due to the C–N–C bonds of the triazine ring itself, caused by “quadrant stretching”.35 The peaks at 1351 and 1172 cm−1 can be attributed to C–N in –CH2–NH–CH2– or –CH2–NH–CH3. The stretching at 1010 cm−1 corresponds to the C–O bonds in –CH2–O–CH2–. The broad medium-strong bands between 950 and 650 cm−1 correspond to the out-of-plane N–H deformation vibrations. After annealing at temperatures above 600 °C, all infrared absorption signals almost disappeared. It can be deduced that most of the triazine rings and other possibly formed organic compounds have been decomposed and the MF resin has been mostly transformed into nitrogen enriched carbon. This was also confirmed in the literature, which indicates that the rupture of the triazine rings takes place between 600 and 675 °C.38 As for the sample C@MF-500, the strong and broad peak at 1500–1600 cm−1 is attributed to the C–N–C bonds of the triazine ring and the carbon–carbon bond stretching of 1,2,4- and 1,2,6-trisubstituted and phenyl alkyl ether-type substituted aromatic ring structures,39,40 confirming the existence of MF and resol resin species in the polymeric framework. With increasing the carbonization temperature, the bands mentioned above became weak and then disappeared, indicating the variation of the polymeric framework to carbon. As for C@MF-700, the bands at 1600 cm−1 which can be ascribed to the in-plane N–H deformation vibration strengthened. This can be interpreted as the activation of the carbon framework by N-rich alkaline gases such as NH3 released from the rupture of triazine rings.35
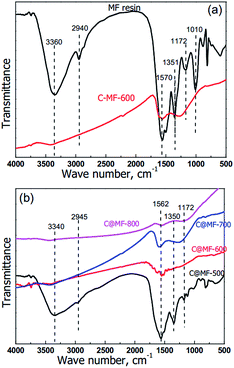 | ||
| Fig. 5 FT-IR spectra of the polymer MF and the corresponding carbon samples C@MF-x carbonized at different temperatures. | ||
The bulk concentrations from wide scan elemental analysis are given in Table 1. Approximately 21.5 wt% of nitrogen was detected for C-MF-600, while about 4.3–10.8 wt% was detected for C@MF-x. The nitrogen content decreases with increasing carbonization temperature (Table 1). Sample C@MF-500 shows the highest nitrogen content of 10.8 wt%. C@MF-700 shows a reduced nitrogen content of 7.9 wt%, which is still much higher than that of sample C-700 (2.0 wt%) prepared without employing MF spheres as template. The results clearly suggest that more nitrogen can be incorporated into the carbon frameworks by introducing MF into the synthesis process. It is suggested that some N-rich alkaline gases such as NH3 (ref. 35 and 41) could be formed from the MF core during the carbonization process. The N-rich gases continuously formed in situ and effused through the resin shell, introducing more nitrogen into the carbon framework.23 As the nitrogen content decreases, the carbon content increases concomitantly with increasing carbonization temperature. The oxygen content appears to be relatively independent of the carbonization temperature.
Analysis of the C@MF-x series carbons generated at 500–900 °C was also performed by XPS to determine the changes occurring in nitrogen species presented on the polymer surfaces before and after pyrolysis (Fig. S1†). A principal component of the MF resin is the triazine resin structures of melamine. Deconvolution of the N 1s spectrum of C-MF-600 provides the ratios of the three forms of nitrogen, pyridinic-N (N-6) and/or triazine nitrogen at 398.4 eV, pyrrolic-N in the five-membered ring and/or pyridonic-N (N-5) at 400.2 eV, and quaternary-N (N-Q) at 402 eV, which are similar to those previously reported for MF resin.42 The N 1s signals of C@MF-x can also be deconvoluted into three different types of nitrogen species (N5, N6 and N-Q). Considering the high oxygen content in the C@MF-x and the fact that pyridonic-N is more stable than pyrrolic-N at elevated temperature, the peak at 400.2 eV is probably associated exclusively with pyridonic-N.43 It has been proved that pyridonic-N acting as an anchor is beneficial for CO2 capture.44 The decrease of the intensity of the fitted component at 398.4 eV for C@MF-800 could be due to the loss of triazine nitrogen. As reported previously, triazine rings were stable under pyrolytic conditions up to 700 °C with a series of condensation reactions.35,41 With increasing carbonization temperature, triazine nitrogen altered and decomposed to be lost or converted to more thermostable forms of nitrogen.41 From FT-IR and XPS results, it is clear that both the polymer and carbon samples contain a large amount of nitrogen-containing groups, which is believed to be promising for CO2 capture.
CO2 capture capacities
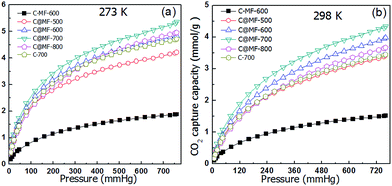
The CO2 adsorption capacity of each sample can be obtained from their respective CO2-sorption isotherms at 760 mm Hg and at ambient pressure. Fig. 6 shows the CO2 adsorption isotherms of the C-MF-600 and C@MF-x samples at 0 and 25 °C. The CO2 capture capacity of sample C@MF-x is ca. 4.2–5.4 mmol g−1 at 0 °C and 3.4–4.3 mmol g−1 at 25 °C. At 25 °C, the maximum CO2 uptakes were 3.4 mmol g−1 and 4.0 mmol g−1 for C@MF-x samples thermally treated at 500 and 600 °C, respectively, and reached up to ca. 4.3 mmol g−1 for the one thermally treated at 700 °C. The data of our work are comparable with those of templated or activated porous carbons. For example, coconut shell-based nitrogen-doped microporous carbon achieved a CO2 adsorption capacity of 4.26 mmol g−1,3 N-doped activated carbons from bean dreg possessed a CO2 uptake capacity of 4.24 mmol g−1 at 25 °C and 1 atm,45 and N-doped zeolite-templated carbons exhibited a CO2 uptake capacity of ca. 4.4 mmol g−1,12 much higher than that of most of the recently reported N-decorated porous carbons based on polycondensation reactions, e.g., 2.26–3.43 mmol g−1 at 25 °C for nitrogen doped mesoporous carbon,46,47 2.67 mmol g−1 for hollow carbon spheres with a high nitrogen loading content of 14.8 wt%,48 2.96 mmol g−1 for nitrogen doped porous carbon hollow spheres with an ultrahigh nitrogen content of 15.9 wt%.23 A further increase of the carbonization temperature leads to a decrease in CO2 uptake, and 3.8 mmol g−1 is observed for the 800 °C-carbonized sample.While preserving a certain microporous surface area, C@MF-700 with a higher nitrogen content shows a much higher CO2 uptake capacity than C-700. Clearly, nitrogen-doped carbons benefit from a certain basic character that favours CO2 adsorption. However, the achievement of high CO2-capture performance relies not only on the surface chemistry provided by basic nitrogen groups but also on the micropore surface area. Under similar conditions, sample C-MF-600, which has the highest N content (21.5 wt%) but the least surface area (148 m2 g−1), displays a very low CO2 adsorption capacity of 1.5 mmol g−1 at 25 °C and 1.9 mmol g−1 at 0 °C. In contrast, the sample C@MF-600, carbonized at the same temperature (600 °C), despite preserving a nitrogen content of 9.8 wt%, displays a high surface area of 558 m2 g−1 and a high CO2-adsorption capacity of 4.0 mmol g−1 at 25 °C and 4.8 mmol g−1 at 0 °C. The especially remarkable CO2-adsorption capacity observed in the samples C-MF-600 and C@MF-600 reveals that the increase in the micropore surface area contributes favorably to the overall enhancement of the CO2-capture performance.49 Moreover, microporous carbons with a high micropore volume arising from pores below 0.6 nm (characteristic energy, E0, above 29 kJ mol−1) have been described as suitable candidates for CO2 capture under post-combustion conditions.10
To determine the strength of the interaction between CO2 molecules and the carbon materials, the CO2 adsorption energy (i.e., the isosteric heat of adsorption, Qst) of C@MF-x was calculated using the CO2 sorption isotherms measured at 273 and 298 K based on the Clausius–Clapeyron equation.50 The plots of Qst as a function of CO2 uptake for C@MF-x are presented in Fig. 7. The Qst for the carbons is calculated to lie in the range of 19.9–34.8 kJ mol−1, 19.3–34.4 kJ mol−1 and 19.4–22.9 kJ mol−1 for C@MF-600, C@MF-700 and C@MF-800, respectively, which is higher than previously reported values for typical carbon adsorbents and most metal–organic frameworks, covalent organic frameworks, and zeolitic imidazolate frameworks.51–53 The high initial Qst values indicate strong interaction between CO2 molecules and the pore walls of N-doped carbons.50 It is noteworthy that the Qst value decreases with the nitrogen content of the carbon materials, implying that N functional groups play an important role in the initial interaction between CO2 and the carbon surface. However, there is no clear relationship between the N content and the initial isosteric heat of adsorption. At high gas loadings, the isosteric heat reached nearly constant values. The sample C@MF-600 with a high N content exhibits a high Qst of ca. 20 kJ mol−1 at higher coverage, while the sample C@MF-700 with a higher CO2 uptake capacity has an intermediate Qst of 19.3 kJ mol−1 at high coverage. The dependence of the isosteric heat of C@MF-x on the carbonization temperatures (e.g. 600–800 °C) could be simply ascribed to the different nitrogen contents and/or the nature of the nitrogen functional groups of the samples (see XPS data, Fig. S1†). In any case, the decrease in the isosteric heat along with the amount of adsorbed gas (Fig. 7) reflects the coexistence of two CO2 adsorption mechanisms based, first, on specific sites defined by nitrogen functional groups and, second, on unspecific sites defined by the non-doped carbon microporous surface once the specific ones are saturated. At room temperature, the high uptake at the initial stage of the isotherm is attributed to the affinity between basic nitrogen groups and CO2via acid–base interaction. The decrease of the CO2-adsorption capacity at high temperature is a common effect for porous carbons.54 The nitrogen-containing functionalities are also responsible for the high-temperature adsorption properties.
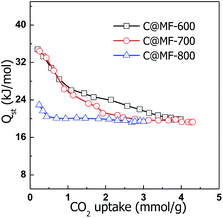 | ||
| Fig. 7 Isosteric heat of CO2 adsorption (Qst) for carbon samples as a function of the amount of CO2 adsorbed. | ||
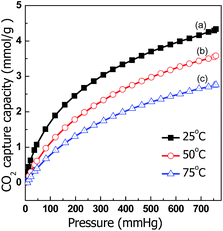
The CO2-capture performance of C@MF-700 was also studied at 50 and 75 °C (Fig. 8). Despite the exothermic character of the adsorption process causing a decrease in the adsorption capacity at increased temperatures, C@MF-700 still exhibited a CO2-sorption capacity of up to 2.76 mmol g−1 at 75 °C (Fig. 8). This value is much higher than that of other similar nitrogen-doped carbons. For example, OMCs with a high N content of up to 13.1 wt% displayed 2.2 mmol g−1 CO2 uptake at 50 °C.25 Polymer-derived carbons adsorbed 1.89 mmol g−1 of CO2 at 60 °C.55 The previously reported highest CO2 uptake in nitrogen-doped mesoporous carbons is only 1.66 mmol g−1 at 75 °C and 1 bar.53,56 The large capture capacity of C@MF-700 is most likely due to the molecular adsorption over the surface and the chemical interaction of CO2 molecules with nitrogen and oxygen functional groups. As reported in the literature, the introduction of accessible nitrogen-donor groups into the internal walls of porous materials can dramatically improve the selective adsorption of CO2.57,58 The pyrrolic/pyridonic-N and pyridinic N groups located at the edge of carbon frameworks having a lone pair of electrons make them advantageous for effective binding to the electron deficient center of the carbon atom in CO2.59 Particularly, pyridine-like nitrogen species possess stronger basicity because of their more accessible electrons.60,61 Additionally, the hydrogen existing on pyrrolic/pyridonic groups makes a positive contribution to CO2 capture by inducing NH⋯O hydrogen bonding.59 Furthermore, it should also be noted here that surface oxygen (18.69 wt%), which has a feature similar to nitrogen species, can increase affinity of a surface to CO2 as they can facilitate the Lewis acid–base interaction and/or hydrogen bonding with CO2 molecules.62 Therefore, it is clear that the obtained carbon material from this simple and inexpensive one-pot method achieves an excellent adsorption capacity for CO2 capture at high temperatures.
Conclusions
Microporous carbon spheres with a high nitrogen content (4.3–10.8 wt%) have been synthesized by a one-pot carbonization route by using resorcinol and HMT as carbon precursors and MF spheres as the hard template. The resultant carbon materials from this method show high surface areas of 518–828 m2 g−1 with a micropore size of 0.5–1.3 nm. Due to these featured characters, the nitrogen-doped carbons exhibit high CO2 uptake capacities at atmospheric pressure with a maximum value of 4.3 and 5.4 mmol g−1 at 25 °C and 0 °C, respectively. More importantly, due to the successful incorporation of N into the carbon matrix, the obtained carbon C@MF-700 exhibits a significantly enhanced CO2 capture capacity of 2.76 mmol g−1 at 75 °C, originating from the well-developed porosity and basic heteroatoms (N and O) on the pore walls. This simple and effective synthesis method offers great potential for large scale production of microporous carbons and N-doped carbons and holds very great promise for practical applications in CO2 capture and separation.Acknowledgements
This work was supported by the National Natural Science Foundation of China (21421001, 51302154, and 21573115), the Natural Science Foundation of Tianjin (15JCZDJC37100), the MOE Innovative Team (IRT13022), the SDUST Research Fund (2015YQJH101) and the 111 project (B12015).Notes and references
- R. A. Khatri, S. S. C. Chuang, Y. Soong and M. L. Gray, Energy Fuels, 2006, 20, 1514 CrossRef CAS
.
- H. Bai and A. C. Yeh, Ind. Eng. Chem. Res., 1997, 36, 2490 CrossRef CAS
.
- M. Yang, L. Guo, G. Hu, X. Hu, L. Xu, J. Chen, W. Dai and M. Fan, Environ. Sci. Technol., 2015, 49, 7063 CrossRef CAS PubMed
.
- S. G. Zhang, T. Mandai, K. Ueno, K. Dokko and M. Watanabe, Nano Energy, 2015, 13, 376 CrossRef CAS
.
- M. Cao and Y. Li, Chem.–Asian J., 2015, 10, 1496 CrossRef PubMed
.
- S. Govind and S. Abdelhamid, Energy Fuels, 2014, 28, 2727 CrossRef
.
- K. Huang, S. H. Chai, R. T. Mayes, G. M. Veith, K. L. Browning, M. A. Sakwa-Novak, M. E. Potter, C. W. Jones, Y. T. Wu and S. Dai, Chem. Commun., 2015, 51, 17261 RSC
.
- J. Liu, N. P. Wickramaratne, S. Z. Qiao and M. Jaroniec, Nat. Mater., 2015, 14, 763 CrossRef CAS PubMed
.
- M. Heuchel, G. M. Davies, E. Buss and N. A. Seaton, Langmuir, 1999, 15, 8695 CrossRef CAS
.
- C. F. Martın, M. G. Plaza, J. J. Pis, F. Rubiera, C. Pevida and T. A. Centeno, Sep. Purif. Technol., 2010, 74, 225 CrossRef
.
- S. Govind and S. Abdelhamid, Carbon, 2015, 93, 68 CrossRef
.
- Y. D. Xia, R. Mokaya, G. S. Walker and Y. Q. Zhu, Adv. Energy Mater., 2011, 1, 678 CrossRef CAS
.
- N. P. Wickramaratnea and M. Jaroniec, J. Mater. Chem. A, 2013, 1, 112 Search PubMed
.
- Y. Li, B. Zou, C. W. Hu and M. H. Cao, Carbon, 2016, 99, 79 CrossRef CAS
.
- B. Ashourirad, P. Arab, A. Verlander and H. M. El-Kaderi, ACS Appl. Mater. Interfaces, 2016, 8, 8491 CAS
.
- L. Zhao, Z. Bacsik, N. Hedin, W. Wei, Y. H. Sun, M. Antonietti and M. M. Titirici, ChemSusChem, 2010, 3, 840 CrossRef CAS PubMed
.
- J. Yu, M. Y. Guo, F. Muhammad, A. Wang, F. Zhang, Q. Li and G. S. Zhu, Carbon, 2014, 69, 502 CrossRef CAS
.
- Z. Liu, Z. Du, H. Song, C. Wang, F. Subhan, W. Xing and Z. Yan, J. Colloid Interface Sci., 2014, 416, 124 CrossRef CAS PubMed
.
- C. Pevida, T. C. Drage and C. E. Snape, Carbon, 2008, 46, 1464 CrossRef CAS
.
- R. L. Liu, W. J. Ji, T. He, Z. Q. Zhang, J. Zhang and F. Q. Dang, Carbon, 2014, 76, 84 CrossRef CAS
.
- N. P. Wickramaratnea and M. Jaroniec, ACS Appl. Mater. Interfaces, 2013, 5, 1849 Search PubMed
.
- N. P. Wickramaratne, J. Xu, M. Wang, L. Zhu, L. Dai and M. Jaroniec, Chem. Mater., 2014, 26, 2820 CrossRef CAS
.
- Y. Wang, H. Zou, S. Zeng, Y. Pan, R. Wang, X. Wang, Q. Sun, Z. Zhang and S. Qiu, Chem. Commun., 2015, 51, 12423 RSC
.
- G. P. Hao, W. C. Li, D. Qian and A. H. Lu, Adv. Mater., 2010, 22, 853 CrossRef CAS PubMed
.
- J. Wei, D. D. Zhou, Z. K. Sun, Y. H. Deng, Y. Y. Xia and D. Y. Zhao, Adv. Funct. Mater., 2013, 23, 2322 CrossRef CAS
.
- L. Liu, Q. F. Deng, X. X. Hou and Z. Y. Yuan, J. Mater. Chem., 2012, 22, 15540 RSC
.
- F. Stoeckli and L. Ballerini, Fuel, 1991, 70, 557 CrossRef CAS
.
- M. Okano and Y. Ogata, J. Am. Chem. Soc., 1952, 74, 5728 CrossRef
.
- A. Kumar and V. Katiyar, Macromolecules, 1990, 23, 3729 CrossRef CAS
.
- M. L. Scheepers, P. J. Adrianensens, J. M. Gelan, R. A. Carleer, D. J. Vanderzande, N. K. DeVries and P. M. Brandts, J. Polym. Sci., Part A: Polym. Chem., 1995, 33, 915 CrossRef CAS
.
- K. Sato, Bull. Chem. Soc. Jpn., 1968, 41, 7 CrossRef CAS
.
- H. Jiang, T. Zhao, C. Z. Li and J. Ma, J. Mater. Chem., 2011, 21, 3818 RSC
.
- D. Liu, J. H. Lei, L. P. Guo and K. J. Deng, Carbon, 2011, 49, 2113 CrossRef CAS
.
- I. H. Anderson, M. Cawley and W. Steedman, Br. Polym. J., 1971, 3, 86 CrossRef CAS
.
- B. Friedel and S. Greulich-Weber, Small, 2006, 2, 859 CrossRef CAS PubMed
.
- R. W. Pekala, J. Mater. Sci., 1989, 24, 3221 CrossRef CAS
.
- C. Gao, S. Moya, H. Lichtenfeld and H. Moehwald, Macromol. Mater. Eng., 2001, 286, 355 CrossRef CAS
.
- D. Feng, Z. Zhou and M. Bo, Polym. Degrad. Stab., 1995, 50, 65 CrossRef CAS
.
- Y. J. Kim, M. I. I. Kim, C. H. Yun, J. Y. Chang, C. R. Park and M. Inagaki, J. Colloid Interface Sci., 2004, 274, 555 CrossRef CAS PubMed
.
- K. A. Trick and T. E. Saliba, Carbon, 1995, 33, 1509 CrossRef CAS
.
- H. Zhong, H. Zhang, S. Liu, C. Deng and M. Wang, ChemSusChem, 2013, 6, 807 CrossRef CAS PubMed
.
- A. Derylo-Marczewska, J. Goworek, S. Pikus, E. Kobylas and W. Zgrajka, Langmuir, 2002, 18, 7538 CrossRef CAS
.
- Y. Li, B. Zou, C. Hu and M. Cao, Carbon, 2016, 99, 79 CrossRef CAS
.
- X. Q. Fan, L. X. Zhang, G. B. Zhang, Z. Shu and J. L. Shi, Carbon, 2013, 61, 423 CrossRef CAS
.
- W. Xing, C. Liu, Z. Zhou, L. Zhang, J. Zhou, S. Zhuo, Z. Yan, H. Gao, G. Wang and S. Z. Qiao, Energy Environ. Sci., 2012, 5, 7323 CAS
.
- Z. Z. Zhang, C. M. Zhu, N. N. Sun, H. Wang, Z. Y. Tang, W. Wei and Y. H. Sun, J. Phys. Chem. C, 2015, 119, 9302 CAS
.
- L. Liu, Q. F. Deng, T. Y. Ma, X. Z. Lin, X. X. Hou, Y. P. Liu and Z. Y. Yuan, J. Mater. Chem., 2011, 21, 16001 RSC
.
- S. S. Feng, W. Li, Q. Shi, Y. H. Li, J. C. Chen, Y. Ling, A. M. Asiri and D. Y. Zhao, Chem. Commun., 2014, 50, 329 RSC
.
- Q. Li, J. Yang, D. Feng, Z. Wu, Q. Wu, S. S. Park, C.-S. Ha and D. Zhao, Nano Res., 2010, 3, 632 CrossRef CAS
.
- S. Himeno, T. Komatsu and S. Fujita, J. Chem. Eng. Data, 2005, 50, 369 CrossRef CAS
.
- A. Phan, C. J. Doonan, F. J. Uribe-Romo, C. B. Knobler, M. O'Keeffe and O. M. Yaghi, Acc. Chem. Res., 2010, 43, 58 CrossRef CAS PubMed
.
- G. Qi, Y. Wang, L. Estevez, X. Duan, N. Anako, A.-H. A. Park, W. Li, C. W. Jones and E. P. Giannelis, Energy Environ. Sci., 2011, 4, 444 CAS
.
- A. P. Katsoulidis and M. G. Kanatzidis, Chem. Mater., 2011, 23, 1818 CrossRef CAS
.
- N. Hiyoshi, K. Yogo and T. Yashima, Microporous Mesoporous Mater., 2005, 84, 357 CrossRef CAS
.
- J. Choma, K. Stachurska, M. Marszewski and M. Jaroniec, Adsorption, 2016, 22, 581 CrossRef CAS
.
- Z. Z. Zhang, B. D. Wang, C. M. Zhu, P. Gao, Z. Y. Tang, N. N. Sun, W. Wei and Y. H. Sun, J. Mater. Chem. A, 2015, 3, 23990 CAS
.
- R. Vaidhyanathan, S. S. Iremonger, G. K. H. Shimizu, P. G. Boyd, S. Alavi and T. K. Woo, Science, 2010, 330, 650 CrossRef CAS PubMed
.
- R. Vaidhyanathan, S. S. Iremonger, K. W. Dawson and G. K. H. Shimizu, Chem. Commun., 2009, 5230 RSC
.
- B. Ashourirad, P. Arab, A. Verlander and H. M. El-Kaderi, ACS Appl. Mater. Interfaces, 2016, 8, 8491 CAS
.
- C. Pevida, T. C. Drage and C. E. Snape, Carbon, 2008, 46, 1464 CrossRef CAS
.
- Y. Huang, F. Yang, Z. Xu and J. Shen, J. Colloid Interface Sci., 2011, 363, 193 CrossRef CAS PubMed
.
- S. G. Kazarian, M. F. Vincent, F. V. Bright, C. L. Liotta and C. A. Eckert, J. Am. Chem. Soc., 1996, 118, 1729 CrossRef CAS
.
Footnote |
| † Electronic supplementary information (ESI) available. See DOI: 10.1039/c6ta09782k |
| This journal is © The Royal Society of Chemistry 2017 |

