Improved Li-ion diffusion and stability of a LiNi0.5Mn1.5O4 cathode through in situ co-doping with dual-metal cations and incorporation of a superionic conductor
Weijie
Liu
,
Qiang
Shi
,
Qunting
Qu
*,
Tian
Gao
,
Guobin
Zhu
,
Jie
Shao
and
Honghe
Zheng
*
College of Physics, Optoelectronics and Energy & Collaborative Innovation Center of Suzhou Nano Science and Technology, Soochow University, Suzhou, Jiangsu 215006, China. E-mail: qtqu@suda.edu.cn; hhzheng@suda.edu.cn
First published on 2nd November 2016
Abstract
The co-doping with metal cations and incorporation of the Li7La3Zr2O12 (LLZO) superionic conductor into spinel LiNi0.5Mn1.5O4 are achieved in situ through a spray drying method by co-doping with Zr and La elements. Microscopic structural characterizations reveal that the doping of hetero-cations into LiNi0.5Mn1.5O4 is effective at reducing the amount of Mn3+, enhancing the cation ordering, and improving the structural stability of LNMO crystals. Scanning transmission electron microscopy (STEM) and Energy Dispersive Spectrometric (EDS) analyses validate the successful growth of LLZO during the calcination of the LNMO material. Incorporation of the LLZO superionic conductor into the bulk phase of LNMO considerably improves the intrinsic lithium diffusion rate within the crystal. Electrochemical studies reveal that the LNMO/LLZO composite at 50![[thin space (1/6-em)]](https://www.rsc.org/images/entities/char_2009.gif) :
:![[thin space (1/6-em)]](https://www.rsc.org/images/entities/char_2009.gif) 1 ratio exhibits the best overall electrochemical behavior, in terms of reversible capacity, rate capability, and long-term cycling performance. At 20C discharge rate, the composite cathode delivers a capacity of 84.5 mA h g−1, whereas the pristine LNMO only maintains 14.8 mA h g−1 capacity. After 300 cycles, a capacity retention of 95.9% is obtained for the composite electrode, but only 87.6% for the pure LNMO cathode. The lithium ion diffusion coefficient of 1.83 × 10⁻¹⁰ cm2 s−1 is obtained for the composite cathode, which is three times as high as that of pure LNMO (6.43 × 10⁻¹¹).
1 ratio exhibits the best overall electrochemical behavior, in terms of reversible capacity, rate capability, and long-term cycling performance. At 20C discharge rate, the composite cathode delivers a capacity of 84.5 mA h g−1, whereas the pristine LNMO only maintains 14.8 mA h g−1 capacity. After 300 cycles, a capacity retention of 95.9% is obtained for the composite electrode, but only 87.6% for the pure LNMO cathode. The lithium ion diffusion coefficient of 1.83 × 10⁻¹⁰ cm2 s−1 is obtained for the composite cathode, which is three times as high as that of pure LNMO (6.43 × 10⁻¹¹).
1. Introduction
To address many environmental issues arising from energy consumption, lithium ion batteries (LIBs) have become the excellent choice, due to their high energy density, good cyclability and environmental friendliness. To meet the aggressive requirements of electric vehicles (EVs), hybrid EVs (HEVs) and plug-in HEVs (PHEVs), energy density and power density of LIBs still need to be further improved.1 Since the cathode material plays a vital role in determining the overall electrochemical performance of the LIBs, research on new cathode materials has drawn world-wide attention in the last two decades.2 Among the many Li-storage cathode materials explored in recent years, the spinel LiNi0.5Mn1.5O4 (LNMO) is very attractive for future applications, as it offers large reversible capacity (theoretical specific capacity 147 mA h g−1), high operating voltage (∼4.7 V vs. Li/Li+), high energy density (∼658 W h kg−1, 30% higher than LiMn2O4), and good thermostability.3,4 Spinel LNMO has been known to have two different crystallographic structures: the ordered space group of P4332 and the disordered space group of Fd3m.5,6 An important difference between the two structures is that only Mn4+ is present in the ordered P4332 group, while a little Mn3+ exists in the disordered Fd3m group.7 Besides, the electrical conductivity of the disordered Fd3m phase is higher than that of the ordered P4332 phase by 2.5 orders of magnitude.8,9Although there are many advantages over other different cathode materials, there are still some serious obstacles hindering the commercialization of the LNMO material. One is the relatively low lithium ion diffusion coefficient in the bulk phase of the material. Within the LNMO crystal, lithium moves from one tetrahedral site to the next by migration via a vacant octahedral site. Strong electrostatic repulsion and high activation barriers along the pathway affect the diffusion of lithium. Yang et al. reported a DLi of 7.6 × 10⁻¹¹ for a LNMO cathode synthesized through the sol–gel method.10 Kavocheva et al. reported that the DLi for a micro-scale LNMO cathode between 4.6–4.8 V is in the range of 10−11 to 10−13.11 Ito et al. reported the 10−13 to 10−9 order of DLi for LNMO material prepared by a spray drying method in the voltage range between 3 and 4.9 V.12 The low Li diffusion ability definitely limits the high rate performance of the electrode. Surface coating is an effective approach to enhancing the rate performance and stabilizing the electrode/electrolyte interface of the LNMO cathode. Carbon coating has been widely adopted to increase the electronic conductivity of the electrode particles, and thus contribute to the improvement in high power performance.10 Lithium ionic conductor coating, such as Li3PO4, Li4P2O7 and LiAlO2 have also been applied to the LNMO cathode to enhance the rate capability.13–15 However, it should be noted that surface coating only improves the electronic or ionic conductivity on the surface of the active material. The intrinsic low lithium diffusion within the particle, which causes slow kinetics of charge and discharge, cannot be improved.
Another important problem for the LNMO cathode is the serious capacity degradation. Currently, an important reason responsible for the capacity-fading of the LNMO cathode is known to be related to the dissolution of manganese and the Jahn–Teller distortion arising from the existence of Mn3+. During the high temperature calcination process, a small amount of Mn4+ turns into Mn3+ because of oxygen deficiency, leading to a transition from the ordered P4332 phase to the disordered Fd3m phase.7 Meanwhile, the appearance of Mn3+ generates the LixNi1−xO impurity phase, which affects the structural stability of the electrode. Of course, side reactions at the electrode/electrolyte interface at high voltage are another factor bringing about the capacity loss.16 To improve the cycling stability, cation doping is one of the most popular strategies. Recent studies have shown that cation substitution is effective for reducing the amount of Mn3+ and eliminating the formation of the LixNi1−xO impurity phase. These effects contribute to the stabilization of the spinel structure and improvement of the cycling performance. So far, many doping metal ions, including Ti, Zr, Co, Ru, Cr, Cu, Nb, Al, Ga, V, Zn, Fe, Mg, etc.,17–29 have been investigated and most of them seem quite effective at improving the cycling performance of the LNMO cathode. However, cation doping is less effective at improving lithium ion diffusion and enhancing the high rate performance of the electrode.
In order to realize the bi-functional effects of improving lithium ion diffusion and reducing Mn3+ interference, a new approach to synthesizing the spinel LNMO/superionic conductor composites was attempted through the in situ co-doping of dual-metal cations. Through appropriate metal cation doping, Mn3+ interference can be reduced and the crystalline structure of LNMO can be stabilized. By introducing two co-doping metal elements, superionic conductors can be formed by the combination of the two doping elements and the excess Li in the bulk LNMO phase. For example, Zr doping is able to suppress the formation of nickel oxide-like impurities related to the presence of Mn3+ ions;18 however, it is invalid to promote lithium ion diffusion properties and enhance the high power performance of the cathode. By introducing a stoichiometric amount of another doping element, La, the Li7La3Zr2O12 (LLZO) superionic conductor may be formed during the sintering process, through the combination of Li, La and Zr. The LLZO superionic conductor has high ionic conductivity, low activation energy, and good chemical/electrochemical stability. It should be noted that LLZO has two different phases: one is a cubic phase with high ionic conductivity (∼10−4 S cm−1) reported by Murugan et al. in 2007, and the other is a tetragonal phase with relatively low ionic conductivity (∼10−7 S cm−1) reported by Awaka et al. in 2009.30,31 The ionic conductivity of LLZO is higher than that of the LNMO phase by several orders of magnitude. In this sense, with the incorporation of LLZO into the LNMO bulk phase, it is possible to enhance the intrinsic lithium diffusion rate within the crystal.
In this work, the co-doping of metal cations and the incorporation of the Li7La3Zr2O12 (LLZO) superionic conductor into the spinel LiNi0.5Mn1.5O4 are simultaneously achieved through a spray drying method by co-doping with Zr and La elements. The co-doping of metal cations into spinel LNMO plays the role of controlling the amount of Mn3+, leading to the improved structural stability of LNMO. Meanwhile, the LLZO superionic conductor is produced in situ through the combination of Li, La and Zr during the calcination, which greatly enhances the lithium ion diffusion rate. The bi-functional effects are realized by the careful design of the co-doping with Zr and La. Electrochemical performances of the LNMO-based cathode, in terms of rate capability and cycling stability, are significantly improved. This new approach of synthesizing superionic conductor composite materials in situ through the co-doping of dual-metal ions may be an effective way to solve the kinetics of many different electrode materials for future LIBs.
2. Experimental
2.1. Materials synthesis
Li(CH3COO)·4H2O (AR, Sinopharm), Ni(CH3COO)2·4H2O (AR, Sinopharm), Mn(CH3COO)2·4H2O (AR, Sinopharm), La(NO3)3·nH2O (AR, Sinopharm) and Zr(NO3)4·5H2O (AR, Sinopharm) were used as the starting materials. LNMO, LLZO and the composite materials were prepared by the spray drying method. First, stoichiometric amounts of the starting materials of Li, Ni and Mn sources were dissolved in deionized water to form the precursor solution of LNMO; the precursor solution of LLZO was prepared similarly. Precursor solutions of the composite materials at different LNMO![[thin space (1/6-em)]](https://www.rsc.org/images/entities/char_2009.gif) :
:![[thin space (1/6-em)]](https://www.rsc.org/images/entities/char_2009.gif) LLZO ratios (100
LLZO ratios (100![[thin space (1/6-em)]](https://www.rsc.org/images/entities/char_2009.gif) :
:![[thin space (1/6-em)]](https://www.rsc.org/images/entities/char_2009.gif) 1, 50
1, 50![[thin space (1/6-em)]](https://www.rsc.org/images/entities/char_2009.gif) :
:![[thin space (1/6-em)]](https://www.rsc.org/images/entities/char_2009.gif) 1, 20
1, 20![[thin space (1/6-em)]](https://www.rsc.org/images/entities/char_2009.gif) :
:![[thin space (1/6-em)]](https://www.rsc.org/images/entities/char_2009.gif) 1, 10
1, 10![[thin space (1/6-em)]](https://www.rsc.org/images/entities/char_2009.gif) :
:![[thin space (1/6-em)]](https://www.rsc.org/images/entities/char_2009.gif) 1) were obtained by dissolving stoichiometric amounts of the starting materials in deionized water, respectively. The concentrations of Ni2+ and Mn2+ in the precursor solutions were set at 0.164 and 0.492 mol L−1. The concentrations of Zr4+ and La3+ varied with different LNMO/LLZO ratios. It should be noted that all these precursor solutions contained 5% excess lithium to compensate for the Li loss during high temperature calcination, as we have shown in our previous studies.32 The solutions were then atomized and dried in the spray-dryer by dry, hot air and the corresponding precursor powders were obtained. The inlet air temperature of the spray-dryer was 220 °C. Subsequently, the as-prepared precursors were preheated at 500 °C for 6 hours to get composite oxide powders. After being ground in an agate mortar, the oxide powders were annealed at 900 °C for 24 hours to obtain the final products. The composite materials of different LNMO
1) were obtained by dissolving stoichiometric amounts of the starting materials in deionized water, respectively. The concentrations of Ni2+ and Mn2+ in the precursor solutions were set at 0.164 and 0.492 mol L−1. The concentrations of Zr4+ and La3+ varied with different LNMO/LLZO ratios. It should be noted that all these precursor solutions contained 5% excess lithium to compensate for the Li loss during high temperature calcination, as we have shown in our previous studies.32 The solutions were then atomized and dried in the spray-dryer by dry, hot air and the corresponding precursor powders were obtained. The inlet air temperature of the spray-dryer was 220 °C. Subsequently, the as-prepared precursors were preheated at 500 °C for 6 hours to get composite oxide powders. After being ground in an agate mortar, the oxide powders were annealed at 900 °C for 24 hours to obtain the final products. The composite materials of different LNMO![[thin space (1/6-em)]](https://www.rsc.org/images/entities/char_2009.gif) :
:![[thin space (1/6-em)]](https://www.rsc.org/images/entities/char_2009.gif) LLZO ratios of 1
LLZO ratios of 1![[thin space (1/6-em)]](https://www.rsc.org/images/entities/char_2009.gif) :
:![[thin space (1/6-em)]](https://www.rsc.org/images/entities/char_2009.gif) 0, 100
0, 100![[thin space (1/6-em)]](https://www.rsc.org/images/entities/char_2009.gif) :
:![[thin space (1/6-em)]](https://www.rsc.org/images/entities/char_2009.gif) 1, 50
1, 50![[thin space (1/6-em)]](https://www.rsc.org/images/entities/char_2009.gif) :
:![[thin space (1/6-em)]](https://www.rsc.org/images/entities/char_2009.gif) 1, 20
1, 20![[thin space (1/6-em)]](https://www.rsc.org/images/entities/char_2009.gif) :
:![[thin space (1/6-em)]](https://www.rsc.org/images/entities/char_2009.gif) 1, 10
1, 10![[thin space (1/6-em)]](https://www.rsc.org/images/entities/char_2009.gif) :
:![[thin space (1/6-em)]](https://www.rsc.org/images/entities/char_2009.gif) 1, and 0
1, and 0![[thin space (1/6-em)]](https://www.rsc.org/images/entities/char_2009.gif) :
:![[thin space (1/6-em)]](https://www.rsc.org/images/entities/char_2009.gif) 1 are referred to as LNMO, LNMO-100, LNMO-50, LNMO-20, LNMO-10, and LLZO, respectively.
1 are referred to as LNMO, LNMO-100, LNMO-50, LNMO-20, LNMO-10, and LLZO, respectively.
2.2. Physical characterization
The crystalline phase of the materials was characterized by powder X-ray diffraction (XRD, Rint-2000, Rigaku with Cu Kα) at a scan rate of 3° min−1 from 10° to 80°. The software ‘Jade’ was used to refine the XRD patterns and get the lattice parameters. Fourier transform infrared spectroscopy (FTIR, Bruker, Tensor 27 System) studies were carried out over the range of 400–700 cm−1. Raman spectroscopy (Jobin Yvon LabRAM HR800) studies were conducted at an excitation wavelength of 514 nm in the range of 100 to 800 cm−1. The morphology and elemental distribution of the as-prepared materials were observed by scanning electron microscopy (SEM, Hitachi S-4700, 15 kV) and scanning transmission electron microscopy (STEM, FEI Tecnai G2 F20 S-TWIN, 200 kV).2.3. Electrochemical measurements
The LNMO cathode laminates were fabricated by casting the slurries onto an aluminum foil using the doctor blade method. The homogeneous slurries consisting of 80 wt% active material, 10 wt% acetylene black and 10 wt% polyvinylidene fluoride (PVDF) were obtained by thorough mixing in N-methyl-2-pyrrolidone (NMP) solvent. All the electrode laminates were controlled to have a similar active material loading of ca. 2.1 mg cm−2. The electrodes were dried at 60 °C for 5 hours to completely remove the NMP solvent. Afterwards, the laminates were calendered and punched into circular discs (13 mm in diameter). Before being moved into the glove box, all the discs were dried at 120 °C under vacuum for 16 hours.To investigate the electrochemical behavior of the as-prepared materials, CR2032-type coin cells were assembled in an argon-filled glove box. Lithium sheet was used as the counter electrode and a porous polypropylene film (Celgard 2500) as the separator; 1 M LiPF6 in a mixture of ethylene carbonate (EC) and diethyl carbonate (DEC) (1![[thin space (1/6-em)]](https://www.rsc.org/images/entities/char_2009.gif) :
:![[thin space (1/6-em)]](https://www.rsc.org/images/entities/char_2009.gif) 1 by volume) solution was chosen as the electrolyte. Galvanostatic charge/discharge tests on these cells were performed using a LAND-CT2001A battery test system in the voltage range of 3.5–4.9 V. Five formation cycles for each cell at C/10 charge/discharge were applied. The rate performance test consisted of charging at the rate of C/5 and discharging at C/10, C/5, C/2, 1C, 2C, 5C, 10C, and 20C after charging, respectively. Long-term cycling of these cells was carried out with 0.5C charge and 1C discharge for 300 cycles. Cyclic voltammetry (CV) was performed between 3.5 and 4.9 V with a scan rate of 0.1 mV s−1 by an Autolab potentiostat instrument. Electrochemical impedance spectroscopy (EIS) measurements were operated in the frequency range between 10 mHz and 100 kHz on a Zahner Elektrik IM6 electrochemical Workstation. All the electrochemical tests above were carried out at an ambient temperature of 25 °C.
1 by volume) solution was chosen as the electrolyte. Galvanostatic charge/discharge tests on these cells were performed using a LAND-CT2001A battery test system in the voltage range of 3.5–4.9 V. Five formation cycles for each cell at C/10 charge/discharge were applied. The rate performance test consisted of charging at the rate of C/5 and discharging at C/10, C/5, C/2, 1C, 2C, 5C, 10C, and 20C after charging, respectively. Long-term cycling of these cells was carried out with 0.5C charge and 1C discharge for 300 cycles. Cyclic voltammetry (CV) was performed between 3.5 and 4.9 V with a scan rate of 0.1 mV s−1 by an Autolab potentiostat instrument. Electrochemical impedance spectroscopy (EIS) measurements were operated in the frequency range between 10 mHz and 100 kHz on a Zahner Elektrik IM6 electrochemical Workstation. All the electrochemical tests above were carried out at an ambient temperature of 25 °C.
3. Results and discussion
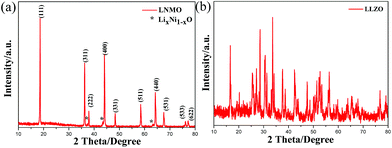
XRD patterns of the pure LNMO and LLZO prepared by the spray drying method are displayed in Fig. 1; all the typical peaks of each sample are in accordance with the standard power diffraction cards of LNMO and LLZO, respectively. A nickel rich LixNi1−xO impurity phase is present, as evidenced by the weak reflections at 37°, 43°, and 64°, respectively, and the obtained LNMO sample is known to have the Fd3m space group. The existence of this impurity phase results from oxygen deficiency in the compound, which brings about a small amount of Mn4+ turning into Mn3+ during the 900 °C calcination process. The synthesis of cubic phase LLZO (around 1300 °C) usually needs a much higher temperature than that of the tetragonal phase (around 900 °C); the LLZO superionic conductor prepared in this work is a typical tetragonal structure with the space group of I41/acd. It should be noted that LLZO produced by the spray drying method has never been reported before in literature. This result shows that LLZO can be successfully synthesized with the spray drying method under the same growth conditions as LNMO.
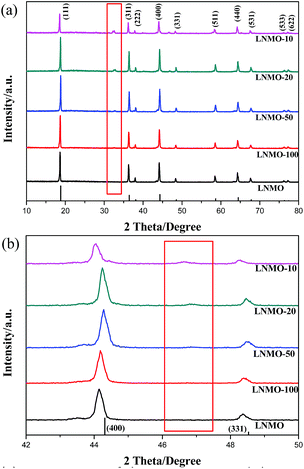
Fig. 2a shows the XRD patterns of the LNMO/LLZO composite materials at different stoichiometric ratios. Partial patterns in the range from 42° to 50° are shown in Fig. 2b. With the increase of the LLZO ratio to 50![[thin space (1/6-em)]](https://www.rsc.org/images/entities/char_2009.gif) :
:![[thin space (1/6-em)]](https://www.rsc.org/images/entities/char_2009.gif) 1, the diffraction peak of LNMO shifts to a higher angle, implying the decrease of the lattice parameter. Further increase of the LLZO ratio from 50
1, the diffraction peak of LNMO shifts to a higher angle, implying the decrease of the lattice parameter. Further increase of the LLZO ratio from 50![[thin space (1/6-em)]](https://www.rsc.org/images/entities/char_2009.gif) :
:![[thin space (1/6-em)]](https://www.rsc.org/images/entities/char_2009.gif) 1 to 10
1 to 10![[thin space (1/6-em)]](https://www.rsc.org/images/entities/char_2009.gif) :
:![[thin space (1/6-em)]](https://www.rsc.org/images/entities/char_2009.gif) 1 leads to the shift of diffraction peaks to a lower angle, implying an enlargement of the lattice parameter. The lattice parameter changes of different LNMO samples validate that LNMO is doped with La and Zr. Table 1 lists the lattice parameters of LNMO/LLZO composites, which clearly manifest the variation of the lattice parameter resulting from the co-doping with Zr and La elements. As Mn3+ has a larger ionic radius (65 pm) than Mn4+ (54 pm) and the reduction of Mn3+ always leads to the decrease of lattice parameter,33 the decrease of the lattice parameter in LNMO-100 and LNMO-50 indicates that the amount of Mn3+ is suppressed. The decrease of the Mn3+ amount upon introduction of La and Zr will be validated by the FTIR, CV, and charge/discharge results.
1 leads to the shift of diffraction peaks to a lower angle, implying an enlargement of the lattice parameter. The lattice parameter changes of different LNMO samples validate that LNMO is doped with La and Zr. Table 1 lists the lattice parameters of LNMO/LLZO composites, which clearly manifest the variation of the lattice parameter resulting from the co-doping with Zr and La elements. As Mn3+ has a larger ionic radius (65 pm) than Mn4+ (54 pm) and the reduction of Mn3+ always leads to the decrease of lattice parameter,33 the decrease of the lattice parameter in LNMO-100 and LNMO-50 indicates that the amount of Mn3+ is suppressed. The decrease of the Mn3+ amount upon introduction of La and Zr will be validated by the FTIR, CV, and charge/discharge results.
 | ||
| Fig. 2 (a) XRD patterns of the pure LNMO and the composites; (b) partial patterns of these samples from 42° to 50°. | ||
| Sample | Lattice parameter (Å) |
|---|---|
| LNMO | 8.17026 |
| LNMO-100 | 8.16819 |
| LNMO-50 | 8.16752 |
| LNMO-20 | 8.16920 |
| LNMO-10 | 8.17101 |
When the LLZO ratio was increased from 50![[thin space (1/6-em)]](https://www.rsc.org/images/entities/char_2009.gif) :
:![[thin space (1/6-em)]](https://www.rsc.org/images/entities/char_2009.gif) 1 to 10
1 to 10![[thin space (1/6-em)]](https://www.rsc.org/images/entities/char_2009.gif) :
:![[thin space (1/6-em)]](https://www.rsc.org/images/entities/char_2009.gif) 1, the enlargement of the lattice parameter was observed. From the SEM images, it can be seen that the further increase of LLZO ratio (samples LNMO-20 and LNMO-10) leads to the disappearance of the typical spinel morphology of LNMO. Moreover, many small particles are dispersed on the large particles. The morphology changes indicate the decreased crystallinity of samples; i.e., the incorporation of excessive heterogeneous La and Zr cations could destroy the crystalline structure of LNMO, which is believed to be the main reason for the enlargement of the lattice parameter.
1, the enlargement of the lattice parameter was observed. From the SEM images, it can be seen that the further increase of LLZO ratio (samples LNMO-20 and LNMO-10) leads to the disappearance of the typical spinel morphology of LNMO. Moreover, many small particles are dispersed on the large particles. The morphology changes indicate the decreased crystallinity of samples; i.e., the incorporation of excessive heterogeneous La and Zr cations could destroy the crystalline structure of LNMO, which is believed to be the main reason for the enlargement of the lattice parameter.
In addition, from the XRD patterns, two small extra peaks at 33° and 47° are observed for the samples with La and Zr doping. The two peaks get stronger with the increase of La and Zr amounts. Deng et al.34 reported the coating of LiMn1.95Ni0.05O3.98F0.02 (LMNOF) with LLZO. They declared that no obvious peaks characteristic of LLZO were observed in the XRD pattern, due to the low content of LLZO (2 wt%). However, they did not mention that there were also two extra peaks at around 33° and 47° in the XRD pattern of one LMNOF sample calcined at high temperature (LMNOF-H). It is therefore assumed that the two peaks at 33° and 47° can be correlated to the formation of the LLZO phase.
FTIR spectroscopy is an effective tool to quantitatively resolve the cation ordering in the LNMO phase. In order to differentiate the ordered P4332 and disordered Fd3m group of the spinel LNMO, FTIR studies were conducted, as shown in Fig. 3. The peaks at 621 cm−1 and 588 cm−1 are the vibration bands of Mn–O and Ni–O, respectively. For the Fd3m structure, the peak at about 621 cm−1 usually exhibits a higher intensity than that at 588 cm−1. The peaks at 430, 465 and 650 cm−1 are the characteristic peaks of the ordered P4332 spinel.35,36 It can be seen that all the samples are the mixtures of a dominant, disordered Fd3m phase and a small amount of ordered P4332 phase. By comparing the intensity ratio between 588 cm−1 and 621 cm−1, the cation ordering of the LNMO/LLZO composites can be semi-quantitatively compared.37 As illustrated, with increasing the doping elements, the peak at 621 cm−1 becomes less intense than that at 588 cm−1, implying an increase in the ordered P4332 spinel. This shows that co-doping with Zr and La is able to improve the cation ordering and reduce the amount of Mn3+ in the crystal.
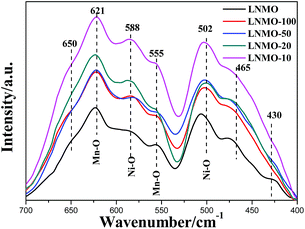 | ||
| Fig. 3 FTIR spectra of the pure LNMO and the composites at different proportions in the range of 400–700 cm−1. | ||
To further confirm the cation ordering of the LNMO/LLZO composites, Raman spectroscopy was carried out in the frequency range from 100 to 800 cm−1. As shown in Fig. 4, all samples exhibit similar features, having six Raman bands. With the increase of Zr and La doping elements, the intensities of all these bands became weaker and weaker. The band located at 637 cm−1 represents the symmetrical Mn–O stretching vibration (A1g) of the octahedral MnO6, while the bands at around 406 and 498 cm−1 are attributed to the Ni2+–O stretching mode in spinel.38 The band at 220 cm−1 and the split of F2g(3) near 580 to 620 cm−1 are deemed to be characteristic of the ordered P4332 phase.39 It is seen from this figure that all these samples exhibit a dominant disordered Fd3m phase and a small part of the ordered P4332 phase. This result is consistent with that obtained from the FTIR spectroscopic study.
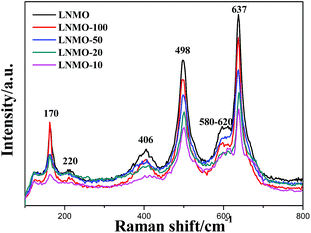 | ||
| Fig. 4 Raman spectra of the pure LNMO and the composites at different proportions in the frequency range from 100 to 800 cm−1. | ||
SEM images of LNMO, LNMO-100, LNMO-50, LNMO-20, LNMO-10 samples are depicted in Fig. 5. It is seen that the particles of pure LNMO material are polyhedrons with non-uniform size of 0.4 to 4 μm. The morphologies suggest that this sample is a well-crystallized spinel. By comparison, LNMO-100 and LNMO-50 exhibit more uniform polyhedrons with a slightly larger particle size. The surface facets are observed to be clean and smooth. The XRD and FTIR studies have shown that Mn3+ is suppressed and the cation ordering is increased by La and Zr doping, and the well developed morphologies of LNMO-100 and LNMO-50 indicate perfect crystallization of the samples. Further increase of the Zr and La doping contents leads to a decrease in the particle size for LNMO-20 and LNMO-10. Typical polyhedrons are no longer observed and many small particles are seen dispersed on the particles. Taking the enlargement of the lattice parameters into consideration, a decrease in the crystallinity may occur, due to the excessive doping elements in the sample.
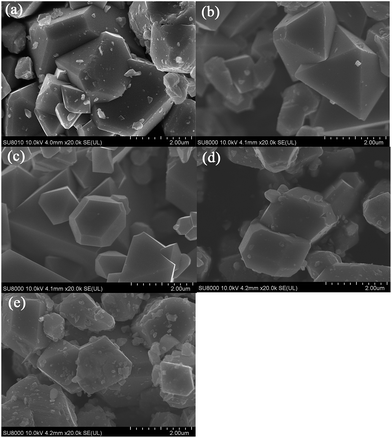 | ||
| Fig. 5 SEM images of the pure LNMO and the composites: (a) LNMO, (b) LNMO-100, (c) LNMO-50, (d) LNMO-20, (e) LNMO-10. | ||
STEM and EDS were conducted to investigate the distribution of the LLZO phase in the LNMO bulk phase. As seen in Fig. 6a, the STEM image of LNMO shows homogeneous bright particles. On the surface of pure LNMO, a lot of small white particles can be observed. These tiny particles can also be found in SEM images. EDS analysis was carried out at point P1 and the spectrum is shown in Fig. 7a. As expected, only the peaks of Ni, Mn and O are observed. For the LNMO-100, LNMO-50, LNMO-20, LNMO-10 composite materials, dark mottled substances are distributed on/in the LNMO particles, as observed from STEM. By comparing the dark regions of the composites and the white particles of pure LNMO, it is believed that the dark region contains a new phase. The higher the ratio of the LLZO phase is, the more the dark regions appear within the composite. In order to identify the dark region phase, EDS of LNMO-10 with the highest ratio of LLZO was measured. EDS of the bright point P2 on the LNMO-10 sample is depicted in Fig. 7b. The result is almost the same as Fig. 7a, only the peaks of Ni, Mn, O are observed, implying the bright region is the LNMO phase. By comparison, EDS of the dark point P3 on the LNMO-10 sample is presented in Fig. 7c. Clearly, besides the strong peaks of Ni, Mn and O, peaks relating to La and Zr are also observed, indicating that the dark region contains the LLZO phase.
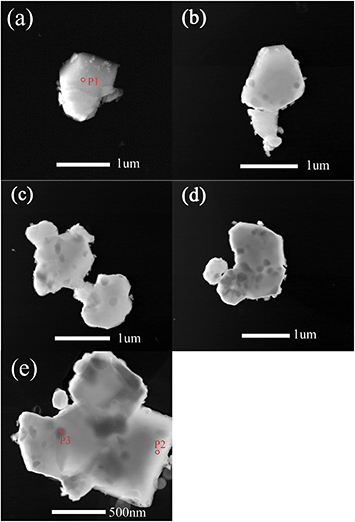 | ||
| Fig. 6 STEM images of the pure LNMO and the composites. (a) LNMO, (b) LNMO-100, (c) LNMO-50, (d) LNMO-20, (e) LNMO-10. | ||
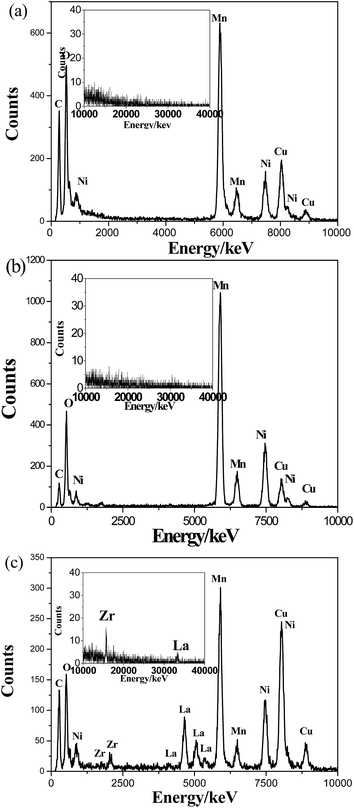 | ||
| Fig. 7 EDS spectra obtained from the red points in Fig. 6: (a) P1, (b) P2, (c) P3. | ||
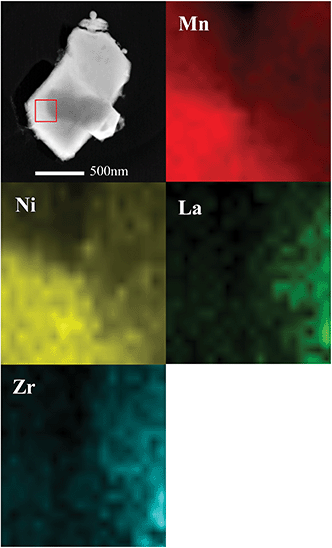
EDS line-scan results for the LNMO-10 sample are shown in Fig. 8. The scan path is along the red line marked in Fig. 8a. As shown in Fig. 8b, when scanning in the bright region, there is no visible signal of La and Zr elements. When scanning in the dark region, a significant increase of La and Zr occurs, accompanied by a decrease of Mn and Ni. EDS mapping analysis on the sample LNMO-10 was conducted to further study the elemental distribution in this sample. We selected a rectangular area in the STEM image that exhibits half of the dark region and half of the bright region (Fig. 9). In the bright region, Mn and Ni are the dominant elements, while only very small amounts of La and Zr are present. In contrast, in the dark region, the signals of La and Zr are much stronger than those of Mn and Ni. The elemental differences of the dark and bright regions, together with the XRD results, suggest that a small amount of La and Zr are doped into the lattice of LNMO, and meanwhile the LLZO phase is formed in LNMO.
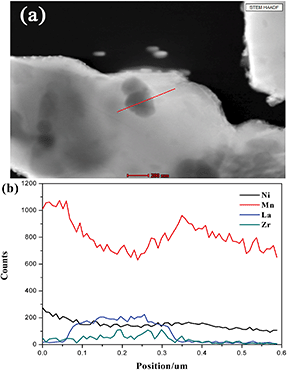 | ||
| Fig. 8 (a) STEM image of LNMO-10, where the red line indicates the EDS line scan location; (b) the elemental distribution of LNMO-10 obtained from EDS line-scan analysis. | ||
In order to compare the electrochemical behavior of the composites with different contents of the LLZO phase, cyclic voltammetry (CV) tests were conducted at a scan rate of 0.1 mV s−1 and the results are depicted in Fig. 10. It is generally accepted that LNMO active material with the P4332 space group only exhibits a single oxidation peak at 4.7 V, caused by the Ni2+/Ni4+ redox couple. On the other hand, for LNMO with the Fd3m space group, the oxidation peak at 4.7 V splits into the two separate peaks of the Ni2+/Ni3+ and Ni3+/Ni4+ redox couple. Simultaneously, a small peak of the Mn3+/Mn4+ redox couple appears at 4.0 V, caused by the trace Mn3+.40,41 The CV behavior clearly demonstrates that all these samples contain a dominant Fd3m space group. The magnified Mn4+/Mn3+ couple at around 4.0 V is shown inset. With the increase of LLZO in the composite, the redox couple at 4.0 V gets smaller. This is attributed to the decrease in Mn3+ and the increase in cation ordering. In addition, the pure LNMO exhibits two redox couples at 4.79 V/4.64 V and 4.84 V/4.67 V, which are attributed to Ni3+/Ni2+ and Ni4+/Ni3+, respectively. In contrast, the LNMO-50 shows more intense and sharper reduction/oxidation peaks at 4.77 V/4.68 V and 4.80 V/4.72 V. The smaller gap between the corresponding oxidation and reduction peaks and more obvious splitting degree of the oxidation peaks reveal that LNMO-50 has a much better electrochemical reversibility and faster lithium insertion/extraction kinetics, compared to LNMO. Oh et al. reported that doping with single Zr element doesn't considerably reduce the polarization of the electrode, due to the low intrinsic ionic conductivity of the electrode.18 This result illustrates that the incorporation of the LLZO superionic conductor through co-doping with dual-metal cations is effective for improving the electrochemical kinetics of the electrode.
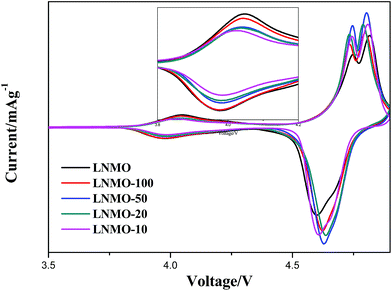 | ||
| Fig. 10 Cyclic voltammograms of the pure LNMO and the composites at different proportions, with a scan rate of 0.1 mV s−1 from 3.5 to 4.9 V. | ||
Fig. 11a exhibits the initial curves of the pure LNMO and the LNMO/LLZO composites at different proportions at the rate of 0.1C. From all these curves, two apparent plateaus at around 4.7 V are observed, which are ascribed to the Ni2+/Ni3+ and Ni3+/Ni4+ redox couples. Meanwhile, a small plateau at around 4.0 V, due to the Mn3+/Mn4+ redox couple is also observed. The specific discharge capacities of LNMO, LNMO-100, LNMO-50, LNMO-20 and LNMO-10 obtained are 118.8, 119.8, 126.5, 117.7, 109.9 mA h g−1, respectively. The capacities at the 4.0 V plateau are ca. 27.3, 22.1, 22.0, 18.2, 14.9 mA h g−1, corresponding to 22.9%, 18.4%, 17.4%, 15.5%, 13.6% of the capacity ratio between the 4.0 V and 4.7 V plateau for LNMO, LNMO-100, LNMO-50, LNMO-20 and LNMO-10, respectively. As the length of the plateau at 4 V is closely related to the amount of Mn3+ in the spinels,33 these results clearly illustrate that the Zr and La doping effectively reduces the amount of Mn3+ in the LNMO cathode.
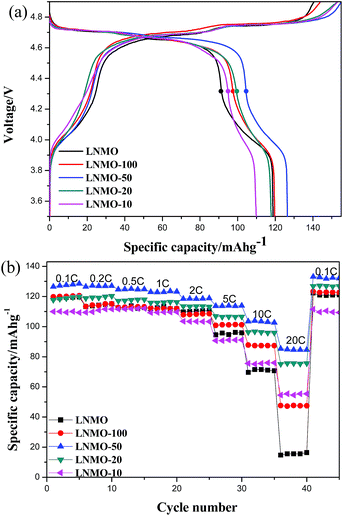 | ||
| Fig. 11 (a) The initial curves of the LNMO composites at the rate of 0.1C in the voltage range of 3.5–4.9 V. (b) The rate capability of the LNMO composites at different LNMO/LLZO proportions. | ||
The rate capabilities of the pristine and the LNMO/LLZO composite samples were assessed after 5 charge–discharge formation cycles and the results are shown in Fig. 11b. At the low discharge rates of below 2C, all samples are able to deliver most of their reversible capacities. At higher discharge rates of 5, 10 and 20C, remarkable differences in the capacity retention are observed. For instance, at 10C rate, the discharge capacities of 70.9, 87.4, 103.3, 96.2 and 75.7 mA h g−1 are obtained for LNMO, LNMO-100, LNMO-50, LNMO-20, and LNMO-10, respectively. Compared to the pure LNMO, all the composite materials exhibit improved rate performances. As expected, the LNMO-50 sample exhibits the best rate performance, due to its optimal crystalline structure and morphology, as discussed above. At the rate of 20C, the pristine LNMO cathode manifests an extremely low capacity of 10 mA h g−1, while LNMO-50 delivers a remarkable capacity of ca. 84 mA h g−1. The significant improvement of the rate capability is believed to be related to the incorporation of the LLZO superionic conductor.
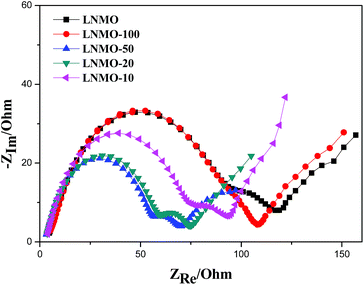
To further illustrate the differences in electrochemical and ohmic polarization of the pristine LNMO and LNMO/LLZO composite cathode, electrochemical impedance spectroscopy (EIS) was carried out at 40% SOC (state of charge) after the rate tests. Nyquist plots of all the electrodes, collected with an AC voltage of 5 mV amplitude in the frequency range of 10 mHz to 100 kHz, are presented in Fig. 12. The high frequency intercept with the abscissa refers to the ohmic resistance of the cell, which is very small compared to other contributions of resistance from the cathode. The first semicircle in the high-to-medium frequency region is ascribed to the lithium ion diffusion through the surface layer (Rs). The charge transfer resistance (Rct) at the electrode–electrolyte interface is reflected in the second semicircle in the medium-to-low frequency. The sloping line in the low frequency region is attributed to lithium ion diffusion in the bulk material. It should be noted that the resistances of the surface film and charge transfer come from both the cathode and Li foil in the half cell. However, the contribution of the Li foil can be assumed to be identical because the Li foil undergoes the same electrochemical history before the EIS measurements. Thus, the Rs and Rct can be taken as a relative measure of the resistances to compare the surface resistance and charge transfer resistance of the working electrode. Apparently, LNMO-50 shows a significantly decreased electrode resistance, which explains its high rate performance compared to the others. The results suggest that the slow charge/discharge kinetics of LNMO can be greatly improved by the incorporation of the LLZO superionic conductor.
To get a better understanding of the role of LLZO in the composites, the lithium ion diffusion coefficient was calculated through cyclic voltammograms at different scan rates. CV curves of the pristine LNMO and LNMO-50 at various scan rates from 0.1 to 1.2 mV s−1 are displayed in Fig. 13. Obviously, with the increase in scan rate, the peak current (ip) increases and the current peak is broadened for each redox couple as shown in Fig. 13a and b. Fig. 13c shows the ipversus the square root of the scan rate (v1/2) plots for the two samples. A good linear relationship is obtained, indicating that the intercalation reaction of the cathodes is controlled by the solid-state diffusion of lithium ions.42 The slopes of the two lines are obtained to be 0.0679 and 0.1144 for the LNMO and LNMO-50, respectively. The dependence of ip on v1/2 can be utilized to calculate the diffusion coefficient of Li+ (DLi) on the basis of the following equation:43
| ip = 2.69 × 10⁵n3/2ADLi1/2v1/2CLi | (1) |
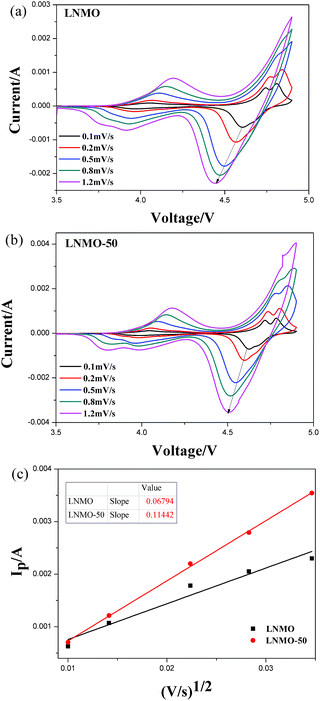 | ||
| Fig. 13 Cyclic voltammograms of (a) LNMO and (b) LNMO-50 at different scan rates. (c) The plots of peak current vs. square root of the scan rate. | ||
Fig. 14 presents the long-term cycling performance of all the samples charged at 0.5C and discharged at 1C for 300 cycles. The initial reversible capacities obtained at this cycling condition are 116.4, 117.4, 114.5, 106.1, and 105.4 mA h g−1 for LNMO, LNMO-100, LNMO-50, LNMO-20, and LNMO-10, respectively. The slight decrease in the initial reversible capacity at high LLZO content is associated with the electrochemical inactivity of the LLZO phase, which does not contribute to the reversible capacity of the electrode. It is noticed that LNMO-50 exhibits the highest capacity during the rate test, whereas the initial capacity of LNMO-100 is slightly higher than that of LNMO-50 during the cycling test. This is because of the different charging rates for the cycling and rate tests. The cycling test was charged at the rate of 0.5C, while the rate test was charged at 0.2C. It is the rapid charge rate that leads to the slightly higher capacity of LNMO-100 than LNMO-50, during the initial tens of cycles. Nonetheless, with the further increase in cycle number, the capacity of LNMO-50 becomes higher than that of LNMO-100, which is in accordance with the higher capacity of LNMO-50 during the rate test. After 300 electrochemical cycles, the capacity retentions for LNMO, LNMO-100, LNMO-50, LNMO-20, and LNMO-10 were 87.6%, 88.6%, 95.9%, 95.6%, and 95.1%, respectively. The coulombic efficiencies of LNMO were between 98.5% and 99.0%. The coulombic efficiency of LNMO-50 was around 99.5%, suggesting the improved charge/discharge reversibility through co-doping of La and Zr and incorporation of the LLZO phase. It is known that the Jahn–Teller effect and disproportionation reaction of Mn3+ are the main reasons for the capacity decay during long-term cycles. The significant enhancement in the cycling stability of the electrode can be attributed to the decrease of trace Mn3+.18 Of course, excessive amounts of Zr and La would spoil the growth of LNMO crystals and bring about a decrease in the electrochemical capacity. The optimized results were acquired for the LNMO-50 composite material in terms of reversible capacity, high rate performance, and long-term cycling stability.
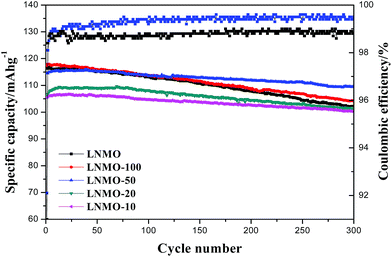 | ||
| Fig. 14 The capacity evolution of pure LNMO and the composites, and the coulombic efficiencies of LNMO and LNMO-50 during long-term cycling. | ||
4. Conclusions
In summary, a novel spinel LiNi0.5Mn1.5O4/superionic conductor Li7La3Zr2O12 composite cathode material was successfully synthesized using a spray drying method, by co-doping Zr and La elements. Doping with Zr element is effective at reducing the amount of Mn3+ and enhancing the cation ordering in the LNMO crystal. Meanwhile, LLZO can be produced by adding stoichiometric amounts of Li, La and Zr within the LNMO bulk phase. Incorporation of the LLZO superionic conductor in the LNMO bulk phase contributes to a considerable improvement in the intrinsic lithium diffusion within the crystal. This study demonstrates the bi-functional effects of both reducing the Mn3+ content and enhancing lithium diffusion by the careful design of the dual metal ion doping. As the result, a significant electrochemical improvement is obtained, in terms of reversible capacity, rate capability and long-term cycling stability. By comparison, the LNMO-50 exhibits the best overall electrochemical behavior, especially for the high rate performance and the long-term cycling stability. Lithium ion diffusion coefficients of the LNMO and LNMO-50 were calculated to be 1.83 × 10⁻¹⁰ and 6.43 × 10⁻¹¹ cm2 s−1 respectively. The significant increase of the intrinsic lithium migration kinetics within the electrode mainly resulted from the incorporation of the LLZO superionic conductor. The results have shown that the approach of synthesizing LNMO/superionic conductor composite material through co-doping with dual metal cations is promising for manufacturing electrodes with high rate and long-term cycling performance.Acknowledgements
The authors are greatly indebted to the funding of Natural Science Foundation of China (NSFC, contract no. 51272168 and 21473119).Notes and references
- G. Wang, W. C. Wen, S. H. Chen, R. Z. Yu, X. Y. Wang and X. K. Yang, Electrochim. Acta, 2016, 212, 791–799 CrossRef CAS
.
- J. Chong, J. P. Zhang, H. M. Xie, X. Y. Song, G. Liu, V. Battaglia, S. D. Xun and R. S. Wang, RSC Adv., 2016, 6, 19245–19251 RSC
.
- A. Manthiram, K. Chemelewski and E. Lee, Energy Environ. Sci., 2014, 7, 1339–1350 CAS
.
- X. W. Gao, Y. F. Deng, D. Wexler, G. H. Chen, S. L. Chou, H. K. Liu, Z. C. Shi and J. Z. Wang, J. Mater. Chem. A, 2015, 3, 404–411 CAS
.
- D. Liu, W. Zhu, J. Trottier, C. Gagnon, F. Barray, A. Guerfi, A. Mauger, H. Groult, C. M. Julien, J. B. Goodenough and K. Zaghi, RSC Adv., 2014, 4, 154–167 RSC
.
- P. Sun, Y. Ma, T. Y. Zhai and H. Q. Li, Electrochim. Acta, 2016, 191, 237–246 CrossRef CAS
.
- J. Wang, W. Q. Lin, B. H. Wu and J. B. Zhao, J. Mater. Chem. A, 2014, 2, 16434–16442 CAS
.
- M. Kunduraci, J. F. Al-Sharab and G. G. Amatucci, Chem. Mater., 2006, 18, 3585–3592 CrossRef CAS
.
- J. Wang, W. Q. Lin, B. H. Wu and J. B. Zhao, Electrochim. Acta, 2014, 145, 245–253 CrossRef CAS
.
- T. Y. Yang, N. Q. Zhang, Y. Lang and K. N. Sun, Electrochim. Acta, 2011, 56, 245–253 Search PubMed
.
- D. Kovacheva, B. Markovsky, G. Salitra, Y. Talyosef, M. Gorova, E. Levi, M. Riboch, H. J. Kim and D. Aurbach, Electrochim. Acta, 2005, 50, 553–5560 CrossRef
.
- A. Ito, D. C. Li, Y. S. Lee, K. Kobayakawa and Y. Sato, J. Power Sources, 2008, 185, 1429–1433 CrossRef CAS
.
- Y. Kobayashi, H. Miyashiro, K. Takei, H. Shigemura, M. Tabuchi, H. Kageyama and T. Iwahori, J. Electrochem. Soc., 2003, 150, A1577 CrossRef CAS
.
- J. Chong, S. Xun, X. Song, G. Liu and V. S. Battaglia, Nano Energy, 2013, 2, 283–293 CrossRef CAS
.
- F. Cheng, Y. Xin, Y. Huang, J. Chen, H. Zhou and X. Zhang, J. Power Sources, 2013, 239, 181–188 CrossRef CAS
.
- H. F. Deng, P. Nie, H. F. Luo, Y. Zhang, J. Wang and X. G. Zhang, J. Mater. Chem. A., 2014, 2, 18256–18262 CAS
.
- J. H. Kim, S. T. Myung, C. S. Yoon, I. H. Oh and Y. K. Sun, J. Electrochem. Soc., 2004, 151, A1911 CrossRef CAS
.
- S. H. Oh, K. Y. Chung, S. H. Jeon, C. S. Kim, W. I. Cho and B. W. Cho, J. Alloys Compd., 2009, 469, 244–250 CrossRef CAS
.
- H. G. Jung, M. W. Jang, J. Hassoun, Y. K. Sun and B. Scrosati, Nat. Commun., 2011, 2, 516–521 CrossRef PubMed
.
- H. L. Wang, H. Xia, M. O. Lai and L. Lu, Electrochem. Commun., 2009, 11, 1539–1542 CrossRef CAS
.
- S. Wang, P. Li, L. Shao, K. Wu, X. Lin, M. Shui, N. Long, D. Wang and J. Shu, Ceram. Int., 2015, 41, 1347–1353 CrossRef CAS
.
- O. Sha, Z. Qiao, S. Wang, Z. Tang, H. Wang, X. Zhang and Q. Xu, Mater. Res. Bull., 2013, 48, 1606–1611 CrossRef CAS
.
- T. F. Yi, Y. Xie, Y. R. Zhu, R. S. Zhu and M. F. Ye, J. Power Sources, 2012, 211, 59–65 CrossRef CAS
.
- G. B. Zhong, Y. Y. Wang, Z. C. Zhang and C. H. Chen, Electrochim. Acta, 2011, 56, 6554–6561 CrossRef CAS
.
- D. W. Shin and A. Manthiram, Electrochem. Commun., 2011, 13, 1213–1216 CrossRef CAS
.
- M. C. Kim, K. W. Nam, E. Hu, X. Q. Yang, H. Kim, K. Kang, V. Aravindan, W. S. Kim and Y. S. Lee, ChemSusChem, 2014, 7, 829–834 CrossRef CAS PubMed
.
- Z. Yang, Y. Jiang, J. H. Kim, Y. Wu, G. L. Li and Y. H. Huang, Electrochim. Acta, 2014, 117, 76–83 CrossRef CAS
.
- J. Liu and A. Manthiram, J. Phys. Chem. C, 2009, 113, 15073–15079 CAS
.
- J. J. Shiu, W. K. Pang and S. Wu, J. Power Sources, 2013, 244, 35–42 CrossRef CAS
.
- R. Murugan, V. Thangadurai and W. Weppner, Angew. Chem., Int. Ed., 2007, 46, 7778–7781 CrossRef CAS PubMed
.
- J. Awaka, N. Kijima, H. Hayakawa and J. Akimoto, J. Solid State Chem., 2009, 182, 2046–2052 CrossRef CAS
.
- H. Liu, G. Zhu, Z. Li, Q. Qu, M. Shen and H. Zheng, J. Power Sources, 2015, 274, 1180–1187 CrossRef CAS
.
- L. N. Wan, Y. F. Deng, C. X. Yang, H. Xu, X. S. Qin and G. H. Chen, RSC Adv., 2015, 5, 25988–25997 RSC
.
- Y. F. Deng, S. X. Zhao, Y. H. Xu and C. W. Nan, J. Mater. Chem. A, 2014, 2, 18889–18897 CAS
.
- D. W. Shin, C. A. Bridges, A. Huq, M. P. Paranthaman and A. Manthiram, Chem. Mater., 2012, 24, 3720–3731 CrossRef CAS
.
- J. Liu and A. Manthiram, J. Electrochem. Soc., 2009, 156, A66–A72 CrossRef CAS
.
- Z. Liu, Y. Jiang, X. Zeng, G. Xiao, H. Song and S. Liao, J. Power Sources, 2014, 247, 437–443 CrossRef CAS
.
- Z. Chen, R. Zhao, A. Li, H. Hu, G. Liang, W. Lan, Z. Cao and H. Chen, J. Power Sources, 2015, 274, 265–273 CrossRef CAS
.
- X. Tang, S. S. Jan, Y. Qian, H. Xia, J. Ni, S. V. Savilov and S. M. Aldoshin, Sci. Rep., 2015, 5, 11958 CrossRef PubMed
.
- G. B. Zhong, Y. Y. Wang, Y. Q. Yu and C. H. Chen, J. Power Sources, 2012, 205, 385–393 CrossRef CAS
.
- Z. Chen, S. Qiu, Y. Cao, X. Ai, K. Xie, X. Hong and H. Yang, J. Mater. Chem., 2012, 22, 17768–17772 RSC
.
- S. R. Das, S. B. Majumder and R. S. Katiyar, J. Power Sources, 2005, 139, 261–268 CrossRef CAS
.
- X. H. Rui, N. Ding, J. Liu, C. Li and C. H. Chen, Electrochim. Acta, 2010, 55, 2384–2390 CrossRef CAS
.
- J. Yang, X. Han, X. Zhang, F. Cheng and J. Chen, Nano Res., 2013, 6, 679–687 CrossRef CAS
.
- G. Liu, X. Kong, H. Sun, B. Wang, Z. Yi and Q. Wang, Electrochim. Acta, 2014, 141, 141–148 CrossRef CAS
.
| This journal is © The Royal Society of Chemistry 2017 |

