Self-assembly of urchin-like porphyrin/graphene microspheres for artificial photosynthetic production of formic acid from CO2†
Qi
Li‡
a,
Qi
Zeng‡
ab,
Lina
Gao
a,
Zaka
Ullah
a,
Hui
Li
c,
Yufen
Guo
a,
Weiwei
Li
a,
Ying
Shi
c,
Guanhong
Tao
*b and
Liwei
Liu
*a
aKey Laboratory of Nanodevices and Applications-CAS & Collaborative Innovation Center of Suzhou Nano Science and Technology, Suzhou Institute of Nano-Tech and Nano-Bionics, Chinese Academy of Sciences, Suzhou, Jiangsu 215123, China. E-mail: lwliu2007@sinano.ac.cn
bCollege of Chemistry, Chemical Engineering and Materials Science, Soochow University, Suzhou, Jiangsu 215123, China. E-mail: taogh@suda.edu.cn
cInstitute of Atomic and Molecular Physics, Jilin University, Changchun, 130012, China
First published on 15th November 2016
Abstract
Life runs on energy and natural resources of energy are being used quickly. Artificial photosynthesis, in which sunlight is used to produce valuable chemicals from abundant natural resources, is considered as one of the auspicious ways to meet the current energy requirements. Here we report a 5,10,15,20-tetrakis(4-aminophenyl)porphyrin/graphene (TkisAPP/G) based photocatalyst with a significant and sensible design and structure for the production of formic acid from CO2. The urchin-like TkisAPP/G microspheres show remarkable enhancement in sunlight absorption and improve the light-harvesting efficiency. An effective approach has been adopted for electronic coupling to develop covalent bonding between porphyrin and graphene which increases the rate of the photoinduced charge transfer. For the fabricated photocatalyst, a 0.5% solar-to-formic acid conversion efficiency has been attained which is greater than that of natural photosynthesis.
1 Introduction
The increasing concentration of carbon dioxide (CO2) in air is one of the most alarming environmental concerns of global warming and climate change. It is highly desirable to find a way for the conversion of CO2 to be used for sustainable energy production. Biomimetic artificial photosynthesis has recently attained profound attention as a promising and compelling approach for the reduction of CO2 to fuel using solar energy, which can solve problems regarding global energy and the environment simultaneously.1–9 Particularly, it is imperative to use visible light for solar energy conversion, since energetically 46% of the total solar light available on earth is in the visible range and only 4% is in the UV range.10,11Since artificial photosynthesis is an integrated system which consists of a light harvesting part and a catalytic conversion part, it is important to maximize the performance of each unit and to design a combined system with optimum efficiency, based on the interactions between the two parts. However, metal oxide semiconductor composites as photocatalytic materials, such as TiO2, can only be activated under UV irradiation and the poor separation of photogenerated carriers severely restricts the overall photocatalytic efficiency.12,13 To fully utilize the solar energy for chemical production, the design and fabrication of efficient photocatalytic materials are in high demand.14–17 These materials should be capable of robust light-harvesting capacities in the broad spectrum and effective coupling of the reaction center, which improves the photoinduced electron transfer.18,19
Photosynthetic materials in chloroplasts combine natural geometry with efficient photocatalytic materials such as porphyrins to improve the solar conversion efficiency.20 Porphyrins as electron-rich organic molecules are characterized by remarkably high extinction coefficients in the visible region.21 However, the development of an effective strategy to enhance the electron transfer rate still remains a challenge. Porphyrin fluorescence was recently found to suffer from strong quenching upon interaction with graphene.22,23 These two materials combine and create a donor (D)–acceptor (A) system based on the porphyrin structure and the charge on the surface of the graphene, which can be used for energy conversion applications.
Moreover, the nanostructure of the thylakoid membrane in the chloroplast with the electron transport chain is arranged side by side for efficient charge transfer. This specific arrangement of the photosynthetic constituents results in high light-harvesting efficiency.24,25 Therefore, engineering materials with nanostructures have been known to promote the light-harvesting capacity effectively through broadband light trapping.26,27 Until now, broadband light trapping by nanometer thick layers of micrometer dimensions remains an elusive technological challenge. Structures such as a carbon nanotube array or silicon nanowire pattern provide a highly effective scheme for light trapping.28–30 These structures enable the materials to achieve index matching to air, multiple scattering events, and record values of absorption.28 For nanometer-thick films of few-micrometer dimensions such as graphene, surface texturing (ordered and disordered) complemented by reflectors is used to randomize the angular scattering and enhance the effective path length for absorption.31,32
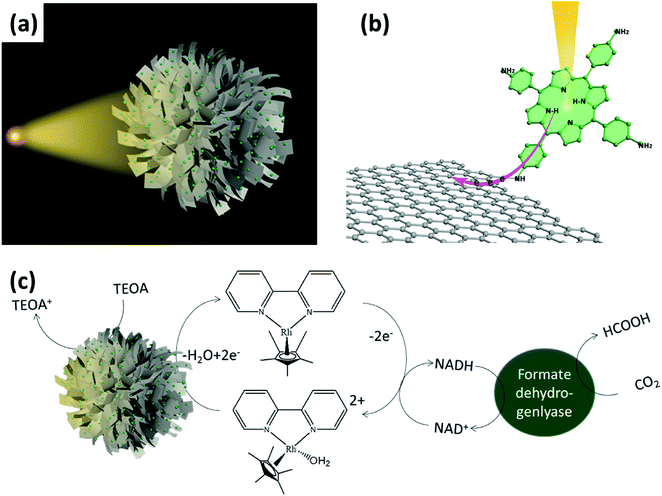
Herein, we present a novel strategy to fabricate a visible light active photocatalyst by designing an urchin-like architecture and covalently bonding the graphene with porphyrin (5,10,15,20-tetrakis(4-aminophenyl)porphyrin) (Fig. 1). The prepared photocatalyst with highly efficient light-harvesting and photocatalytic properties shows an efficient artificial photosynthetic production of formic acid from CO2. The designed urchin-like structure of porphyrin/graphene microspheres can maximize the absorption of sunlight to improve the light-harvesting efficiency. In addition, the porous structure increases the light scattering which results in increase of solar energy conversion. Moreover, the effective strategy to modify the electronic coupling is to introduce small covalent bonding (–CONH–) between the porphyrin and graphene, which can greatly shorten the electron transport distance at the donor–acceptor interfaces. The undesired charge recombination can be largely avoided in the subsequent photocatalytic CO2 reduction. Hence, the synergetic enhancement mechanism of the urchin-like 5,10,15,20-tetrakis(4-aminophenyl)porphyrin/graphene (TkisAPP/G) microspheres is proved by the reduction of CO2 to fuel using solar energy. This work can provide a new methodology for the synthesis of photocatalytic materials to promote artificial photosynthesis.
2 Experimental
2.1 Preparation of TkisAPP/G
Graphene oxide (GRF-GO-01, size = 30–80 μm) was used as received from Suzhou Graphene Nanotechnology Co., Ltd., China. GO (10 mg) and 5,10,15,20-tetrakis(4-aminophenyl)porphyrin (TkisAPP) (25 mg) were stirred in dimethylformamide (DMF) (8 mL), in the presence of a catalytic amount of triethylamine (0.2 mL) in a round bottom flask at 130 °C for 3 days in an argon atmosphere. The reaction mass was then washed with ethane and centrifuged (8500 rpm, 30 min) to precipitate the product. The product was filtered using a membrane filter paper. The excessive TkisAPP and other impurities were removed through multiple washing with water. Eventually, drying the product under vacuum yielded TkisAPP/G.2.2 Preparation of TkisAPP/G microspheres and rGO microspheres
Calculated amounts of TkisAPP/G were dispersed directly in deionized water using ultrasonication for ∼30 min. The suspension (1.0 mg mL−1) was added to a continuous phase (100 mL octanol oil) under energetic agitation at room temperature to produce TkisAPP/G/water micro-droplets in an oil/water emulsion. The resulting emulsion was then heated instantly in a microwave oven (800 W) for 30 s. The water in the micro-droplets was allowed to evaporate completely to assemble TkisAPP/G microspheres. The TkisAPP/G microspheres, which precipitated in the octanol, were collected, washed 3 times with acetone and water, and dried at 40 °C for 12 h.Graphene microspheres were also synthesized from the graphene oxide (GO)/water suspension via the same method and conditions. The GO suspension (1.0 mg mL−1) was added to the continuous phase (100 mL octanol oil) containing a 0.5 g citric acid under energetic agitation at room temperature to produce GO/water micro-droplets in an oil/water emulsion. The resulting emulsion was then heated instantly in a microwave oven (800 W) for 30 s. The GO microspheres, which precipitated in the octanol, were collected, washed 3 times with acetone and water, and dried at 40 °C for 12 h.
2.3 Measurements and observations
A Fourier transform infrared (FTIR) spectroscopic study was performed on a FTIR spectrophotometer (Nicolet In10, Thermo Fisher, USA) to identify the functional groups present in the samples. X-ray photoelectron spectroscopy (XPS) was conducted with an Axis Ultra DLD instrument (Kratos, Japan) system. The vacuum pressure of the chamber was 1 × 10⁻⁹ Torr. A monochromatic aluminum Kα source was used with a source power of 150 W (15 kV × 10 mA). Thermogravimetric analysis (TGA) was conducted under nitrogen gas from room temperature to 800 °C, at a heating rate of 10 °C min−1 using a Q50 thermal analyzer (TA Instruments, USA). The ultraviolet photoelectron spectroscopy (UPS) spectra were acquired at a constant pass energy of 2 eV using a He I radiation source (21.2 eV) operated at 1.5 kV and 100 mA with normal detection. The samples were biased at −8 V in order to resolve the secondary electron cutoff in the UPS spectra. The electrochemical impedance spectroscopy (EIS) measurements were carried out on a CHI660B potentiostat/galvanostat electrochemical analyzer using a three electrode configuration system. All measurements utilized a saturated calomel reference electrode (SCE) and a platinum wire counter electrode. The electrolyte was 1 mM K3[Fe(CN)6]/K4[Fe(CN)6] and 0.1 M KCl aqueous solution. The impedance spectra were recorded under a perturbation signal of 5 mV over a frequency range of 0.1–200 MHz.The microstructures and morphology of TkisAPP/G microspheres were examined using scanning electron microscopy (SEM) (Quanta 400 FEG, USA) and transmission electron microscopy (TEM) (Tecnai G2F20 S-TWIN). For TEM, 0.1 mg mL−1 TkisAPP/G microsphere dispersions were prepared in acetone and the dispersions were drop-cast on a fresh lacey carbon Cu-grid. Absorption spectra were measured using a U-2810 UV-vis spectrophotometer (Hitachi Inc., Japan), while the steady-state photoluminescence spectra were obtained using an F-4600 spectrofluorometer (Hitachi Inc., Japan). The concentration of the produced formic acid was assayed by using a Waters HPLC system (Waters 2695, Milford, MA) equipped with a photodiode array detector at 210 nm. Separations were made on an XBriage C18 analytical column (4.6 mm diameter × 150 mm; 5 μm particle size). The column was eluted at a flow rate of 0.6 mL min−1.
A femtosecond laser (Coherent Libra, USA) which delivers 4 mJ pulses was used as the light source. The fundamental output came from a Ti:sapphire femtosecond regenerative amplifier operating at 800 nm with 50 fs pulses and a repetition rate of 1 kHz. The fundamental beam was separated into two beams in the ratio 9![[thin space (1/6-em)]](https://www.rsc.org/images/entities/char_2009.gif) :
:![[thin space (1/6-em)]](https://www.rsc.org/images/entities/char_2009.gif) 1. A more intense beam was used for the generation of second harmonic (λex = 400 nm) of the fundamental laser by a 0.5 mm BBO (b-BaB2O4, Fujian Castech Crystals Inc. China), which was applied as the excitation pump pulse with an approximate power of 3 μJ. The other beam passed through a controlled delay line (ILS250CCL, France) and was focused onto a sapphire plate to generate a sub-picosecond white-light super-continuum. Spectrally tunable (450–750 nm) femtosecond pulses were used as the probe beam in the pump-probe experimental setup (Helios). Two laser beams were incident on the sample at a small angle (θ ≤ 5°). All of the above experimental measurements were performed at room temperature (295 K).
1. A more intense beam was used for the generation of second harmonic (λex = 400 nm) of the fundamental laser by a 0.5 mm BBO (b-BaB2O4, Fujian Castech Crystals Inc. China), which was applied as the excitation pump pulse with an approximate power of 3 μJ. The other beam passed through a controlled delay line (ILS250CCL, France) and was focused onto a sapphire plate to generate a sub-picosecond white-light super-continuum. Spectrally tunable (450–750 nm) femtosecond pulses were used as the probe beam in the pump-probe experimental setup (Helios). Two laser beams were incident on the sample at a small angle (θ ≤ 5°). All of the above experimental measurements were performed at room temperature (295 K).
3 Results and discussion
FTIR spectroscopy provided a clear evidence for the reduction of graphene and covalent coupling of TkisAPP (Fig. 2a and S1†). In TkisAPP/G and TkisAPP peak intensities, two new peaks were found at 1685 and 1405 cm−1 for TkisAPP/G (Fig. 2a). These peaks correspond to the C![[double bond, length as m-dash]](https://www.rsc.org/images/entities/char_e001.gif) O and C–N characteristic stretching bands of the amide group (–NHCO–). These reveal the formation of amide linkage –NHCO– between –NH2 and –COOH groups. In comparison with GO, the characteristic peak of the oxygen functional group at 1101 cm−1 (C–O, epoxy stretching) was significantly decreased in TkisAPP/G, suggesting the partial removal of the oxygen functional group from GO during covalent coupling occurred at a temperature of 130 °C.
O and C–N characteristic stretching bands of the amide group (–NHCO–). These reveal the formation of amide linkage –NHCO– between –NH2 and –COOH groups. In comparison with GO, the characteristic peak of the oxygen functional group at 1101 cm−1 (C–O, epoxy stretching) was significantly decreased in TkisAPP/G, suggesting the partial removal of the oxygen functional group from GO during covalent coupling occurred at a temperature of 130 °C.
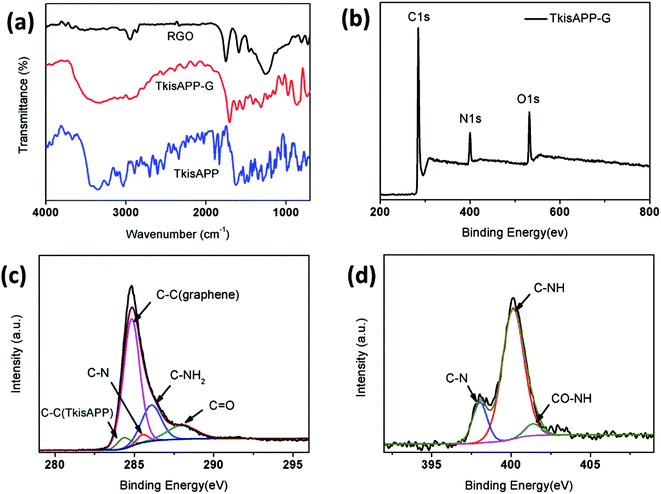 | ||
| Fig. 2 (a) FTIR spectra of rGO, TkisAPP/G and TkisAPP. (b) XPS spectrum of TkisAPP/G. Core level spectra of (c) C 1s and (d) N 1s. | ||
The XPS analysis of TkisAPP/G was performed to get a clear understanding of the chemical composition and attachment of functional groups to the TkisAPP/G (Fig. 2b–d). The peaks observed at 284, 400, and 531 eV are attributed to C 1s, N 1s, and O 1s, respectively. The high resolution C 1s peak can be deconvoluted into five components. The peaks at 284.3, 284.8 and 286.1 eV arose due to C–C (TkisAPP), C–C (graphene) and C–NH2, respectively. Additionally, the peaks at 285.5 and 288.0 eV were attributed to the C–N and C![[double bond, length as m-dash]](https://www.rsc.org/images/entities/char_e001.gif) O of the amide bond; the obtainment of a product from a nucleophilic reaction between amine and –COOH groups demonstrates the formation of covalent bonds between TkisAPP and graphene. Meanwhile, the result was also demonstrated on the N 1s of TkisAPP/G with peak-fit processing. The new peak at 401.4 eV was due to the C–N of the amide bond. These XPS results agree well with the FTIR results. In addition, the TkisAPP/G showed thermal stabilities similar to rGO (Fig. S2†), and the atomic concentration of nitrogen in TkisAPP/G was ∼10.95%, confirming the introduction of TkisAPP into graphene sheets.
O of the amide bond; the obtainment of a product from a nucleophilic reaction between amine and –COOH groups demonstrates the formation of covalent bonds between TkisAPP and graphene. Meanwhile, the result was also demonstrated on the N 1s of TkisAPP/G with peak-fit processing. The new peak at 401.4 eV was due to the C–N of the amide bond. These XPS results agree well with the FTIR results. In addition, the TkisAPP/G showed thermal stabilities similar to rGO (Fig. S2†), and the atomic concentration of nitrogen in TkisAPP/G was ∼10.95%, confirming the introduction of TkisAPP into graphene sheets.
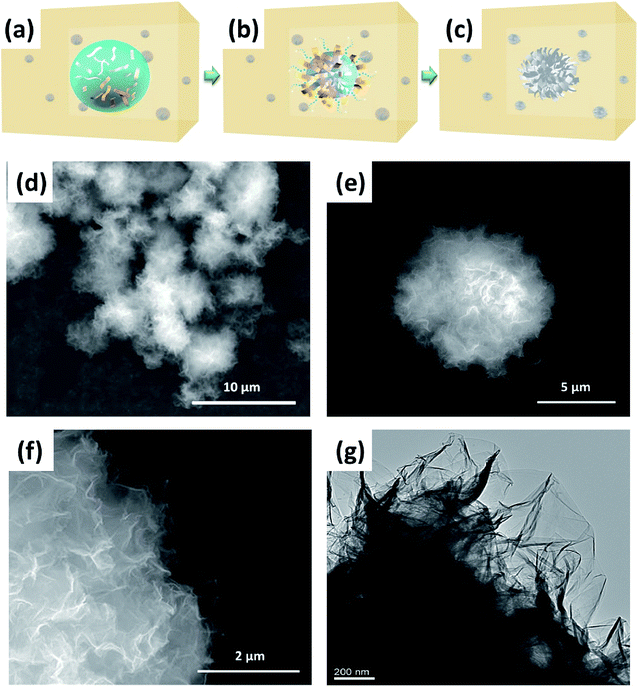
In a bid to develop a more suitable structure of TkisAPP/G for artificial photosynthesis, we propose a strategy for the in situ self-assembly of TkisAPP/G into a micron-sized urchin-like spherical structure. To fabricate urchin-like TkisAPP/G microspheres, we developed a novel evaporation-assisted self-assembly process that uses organic solvents at high temperature. The proposed fabrication process of urchin-like TkisAPP/G microspheres is illustrated in Fig. 3a–c. The desired TkisAPP/G/water spherical micro-droplets were obtained in octanol by producing a water/oil emulsion. Water was allowed to evaporate completely to form urchin-like TkisAPP/G microspheres in octanol. Fig. 3d–f show scanning electron microscopy (SEM) images of the synthesized urchin-like TkisAPP/G microspheres. It can be observed from the images that the crumpled 2D nanosheets acted as the basic building blocks and self-assembled into the spherical microstructures with a uniform size of ∼8 μm. The plane view of the transmission electron microscopy (TEM) image (Fig. 3g) and the SEM surface image (Fig. 3f) of the urchin-like TkisAPP/G microspheres show that the nanosheets at the surface of the microspheres are typically oriented in an outward direction. This corresponds well with the scheme shown in Fig. 3c. The structure of this microsphere formed by the unique arrangement of the individual 2D nanosheets is quite analogous to that of an urchin (sea urchin). The nanoporous channels in the urchin-like TkisAPP/G microspheres are indicated by arrows in Fig. 3f.
The self-assembled urchin-like microstructure formation can be attributed to the instant evaporation of aqueous microdroplets, as well as the immiscibility of the organic solvent and TkisAPP/G. The microdroplets are vaporized instantly due to high temperature, and the vapors tend to escape outward. The GO sheets are aligned along the water droplet evaporation direction, owing to their surfactant-like function in a water/oil emulsion. This causes the nanochannels to radiate outward between the assembled nanosheets. The immiscibility of the organic solvent and GO, and partial thermal reduction are required to self-assemble a spherical microstructure from GO building blocks with increased van der Waals interactions between adjacent graphene sheets.
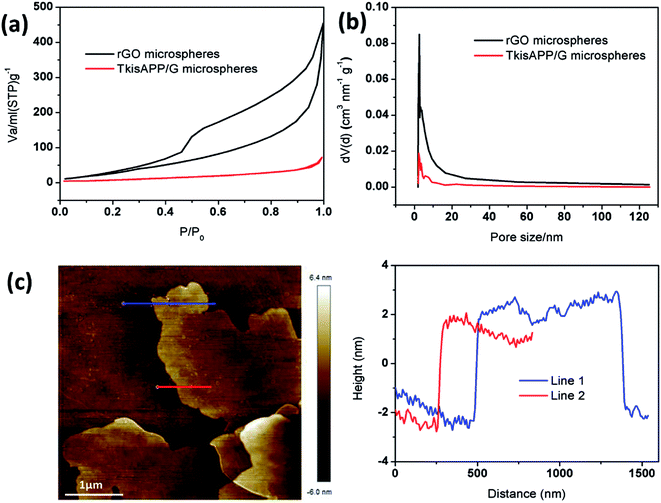
To study the nanoporous channels in rGO microspheres and TkisAPP/G microspheres, Brunauer–Emmett–Teller (BET) analysis was performed which showed that both rGO microspheres and TkisAPP/G microspheres exhibit Type III-isotherms, as shown in Fig. 4a. The isotherms indicate large sized open pores in the microspheres which is consistent with the SEM observations shown in Fig. 3d–f. An identifiable hysteresis loop for rGO in Fig. 4a also indicates the existence of mesopores. The sharp drop in the surface area value of TkisAPP/G microspheres was attributed to the presence of TkisAPP. The nitrogen adsorption isotherm analysis gives a specific surface area of 96.4294 m2 g−1 for rGO microspheres and 24.3151 m2 g−1 for TkisAPP/G microspheres. Further Fig. 4b provides detailed information about the pore size distribution. The curves show that most of the pores on rGO microspheres and TkisAPP/G microspheres lie in the mesoporous range.
Atomic force microscopy (AFM) analysis was performed to determine the thickness of 2D TkisAPP/G nanosheets. The thickness was measured along two lines, as shown in Fig. 4c. The results give the thickness of the nanosheets as ∼3.5 nm, thicker than the GO. These results are in good agreement with the BET outcomes. This can be attributed to the introduction of TkisAPP onto the rGO nanosheet.
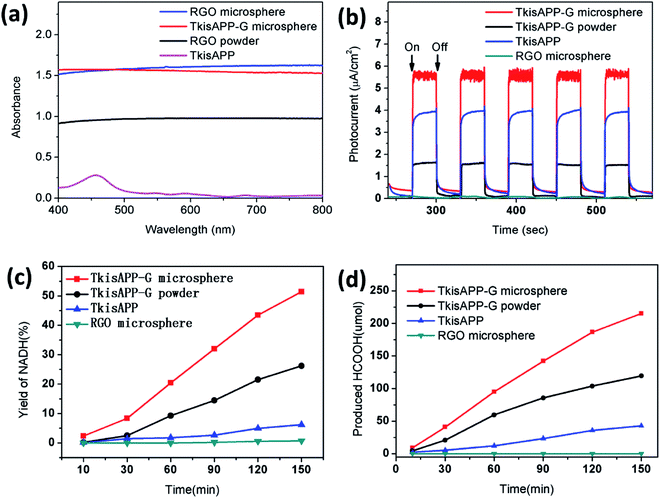
In order to investigate the light absorption by the urchin-like TkisAPP/G microspheres, the diffuse reflectance spectrum was obtained over a broad range of wavelengths (400–800 nm) which cover most of the spectrum useful for photosynthesis. Fig. 5a shows the UV-vis diffuse reflectance spectra of four samples, rGO microspheres, TkisAPP/G microspheres, rGO and TkisAPP, with the same thickness. Significantly, the absorption of the rGO microspheres and urchin-like TkisAPP/G microspheres were extremely high, up to 95% across the entire spectral range from 400 nm to 800 nm (Fig. 5a). It is much higher than rGO (75%), as well as TkisAPP (64%). The optical enhancement takes place uniformly across this broad range, elucidating the blackbody behavior of such a structure. We attribute the light-harvesting enhancements to the nanoporous channels of the urchin-like TkisAPP/G microspheres.
To realize the significant role of the structure and covalent bonding in enhancing the lifetime of electron transformation and promoting photocatalytic activity, the photoelectrochemical experiments are performed under visible light irradiation. Fig. 5b displays the photocurrent transient response of TkisAPP/G microspheres, TkisAPP/G, TkisAPP, and rGO microspheres. The measurements of photocurrent with the passage of time in an on/off cycle of simulated sunlight irradiation show that the transient photocurrent of the urchin-like TkisAPP/G microspheres far exceeds that of the other materials, and quickly achieves a stable response during light on. The results indicate that the transport of photogenerated electrons from TkisAPP to rGO in urchin-like TkisAPP/G microspheres is markedly effective. In contrast, the photocurrent density of other samples is lower. Significant photocurrent decay is also observed with the increased switch-on and off cycles.
A series of photocatalytic experiments have been performed to study the photocatalytic activities of TkisAPP/G microspheres for the visible light-driven photoregeneration of nicotinamide adenine dinucleotide (NADH). The concentration of photoregenerated NADH was measured by using a spectrophotometer. As shown in Fig. 5c, urchin-like TkisAPP/G microspheres are significantly effective for NADH photoregeneration, constantly accumulated up to 51.50% with a time linearity. However, rGO microspheres, TkisAPP, and TkisAPP/G have 0, 6.79%, and 25.50% NADH regeneration yields, respectively (Fig. 5c).
Additional experiments were performed to study the photocatalytic performance of the urchin-like TkisAPP/G microspheres for visible light-driven artificial photosynthetic production of formic acid from CO2. The amount of formic acid was detected by Liquid Chromatography (Waters HPLC system). Fig. 5d shows that the formic acid yield increases linearly with reaction time with the urchin-like TkisAPP/G microspheres as a photocatalyst. With the use of 0.32 mg mL−1 concentration of the urchin-like TkisAPP/G microspheres, the production of formic acid during 150 min was 215.28 μmol, while for 0.32 mg mL−1 TkisAPP/G and TkisAPP, the production of formic acid was 42.80 and 14.25 μmol, respectively. These investigations clearly reveal the superiority of the urchin-like TkisAPP/G microspheres over other photocatalytic materials, and evidence that the performance not only is an intrinsic property of materials, but also emerges from the appropriate structure. The influence of TkisAPP/G microsphere concentration on the production of formic acid from CO2 has been shown in Fig. S3,† which reveals that the production is increased rapidly with a small increase in TkisAPP/G microsphere concentration; however further increase in concentration shows a smaller increase in the production rate.
The electron-transfer mechanism could be estimated from ultraviolet photoelectron spectroscopy (UPS) analysis. Fig. 6a shows the UPS spectrum of TkisAPP/G in comparison with the spectrum of the TkisAPP around the Fermi edge. The highest occupied molecular orbital (HOMO) and the lowest unoccupied molecular orbital (LUMO) of TkisAPP/G are calculated to be 3.92 eV and 0.87 eV, respectively. This suggests that the photocatalysis of TkisAPP/G is feasible in the visible light region. Moreover, the work function of TkisAPP is 1.6 eV, much lower than that of graphene, suggesting the generation of photoexcited electrons in TkisAPP which can easily be transferred to graphene.
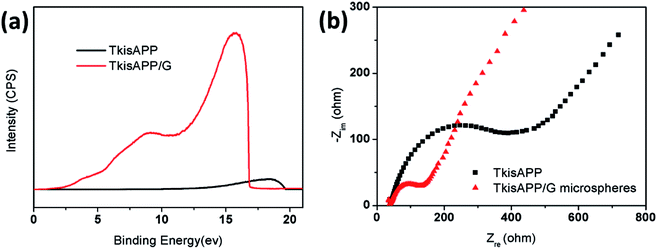 | ||
| Fig. 6 (a) UPS spectra of TkisAPP and TkisAPP/G. (b) EIS Nyquist plots of TkisAPP and TkisAPP/G microspheres. | ||
The electrochemical impedance spectroscopy (EIS) Nyquist plots were obtained for TkisAPP and TkisAPP/G microspheres to further study the resistance of charge transfer. The plot given in Fig. 6b shows that the semicircles of the samples become increasingly short with the incorporation of graphene into TkisAPP, signifying that the charge transfer resistance is decreased significantly on the surface. As graphene has excellent conductivity due to its two-dimensional planar structure, its covalent bonding with TkisAPP further increases the electron transport rate and an effective charge separation is subsequently accomplished.
To understand the ultrafast electron injection event at the TkisAPP/G interfaces from the molecular structure point of view, steady-state absorption, fluorescence spectra and femtosecond transient absorption (TA) were measured. The absorption spectra recorded for TkisAPP and TkisAPP/G indicate differences in the spectral features of both the ground and excited states (Fig. S4 and S5†).
For TkisAPP, the initial Soret band was recorded at 427 nm and in the case of TkisAPP/G, there was a drastic decrease of the Soret band intensity along with development of a new red-shifted Soret band at 441 nm. These spectral changes indicate a strong ground state interaction between TkisAPP and graphene, whereas such an interaction is completely missing in TkisAPP.
The strong fluorescence quenching detected for TkisAPP/G further confirmed that the covalent interaction between graphene and organic donor molecules TkisAPP can quench the emission quickly via photo-induced electron transfer. Hence, it can be suggested that the interaction triggered by covalent interaction between TkisAPP and graphene decreases the inter-molecular distance between TkisAPP and graphene. In such a situation, the charge transfer from TkisAPP to graphene takes place quickly. The TA provides detailed information about the excited state charge transfer and the spectra recorded after 400 nm excitation are shown in Fig. 7a and b.
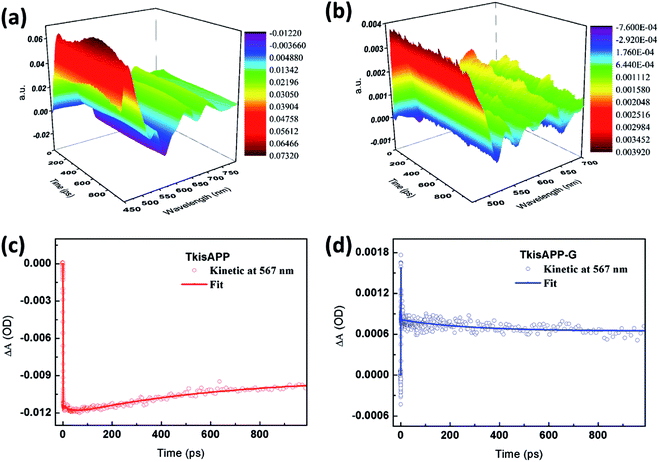 | ||
| Fig. 7 Femtosecond transient absorption spectra recorded after 400 nm excitation for (a) TkisAPP and (b) TkisAPP/G. Kinetic traces of (c) TkisAPP and (d) TkisAPP/G. | ||
By analyzing the TA data in a different time domain, TA spectrum of TkisAPP shows no change over a 500 ps time window, which is expected from the long lifetime of its singlet excited states.33,34 We can find clear differences by comparing the 3D image plots of transient absorption in Fig. 7a and b. The spectrum of free porphyrin shows an obvious negative emission band covering the 550–580 nm domain, with a peak around 567 nm. Simultaneously, several broad positive absorption bands located at 469 nm, 540 nm, 635 nm and 701 nm superimpose and extend over the entire spectral range. Under the same experimental conditions, the spectrum recorded for TkisAPP/G vanishes rapidly with a slight blue-shift, indicating fast excitation interactions. Moreover, as the TA of TkisAPP shows the characteristic spectral features of porphyrin, new positive spectral features are observed in the TkisAPP/G in the range of 550–600 nm, that stay up to the delay time of 1 ns. We assign this behavior to the TkisAPP cation radical formed upon electron transfer from TkisAPP to graphene through covalent bonding.35,36 The detection of the radical cation provides an indication of electron transfer from the TkisAPP to graphene.
To study the dynamics of the electron transfer process, we collected kinetic traces of the TkisAPP and TkisAPP/G as presented in Fig. 7c and d. The corresponding decay process can be well described by a two-exponential function with a small error (Table S1†). It is worth mentioning that kinetic traces are collected at the new spectral band, formed when TkisAPP/G shows fast dynamics compared with the excited state of TkisAPP. For TkisAPP, the curve shows an ultrafast falling edge, and the signal keeps rising slowly during the nanosecond time scale. In contrast, TkisAPP/G exhibits a notable short increase within 1 ps, and subsequently a very fast decay. Finally, it shows almost a flat line within hundreds of picoseconds. The fast dynamic indicates the interaction between TkisAPP and graphene.37
The experimental results clearly demonstrate huge enhancement in the sunlight conversion and formic acid production through the urchin-like TkisAPP/G microspheres as the photocatalyst. To investigate the observed behavior, we determined the energy conversion efficiency. The energy conversion efficiency ‘η’ of the solar-formic acid production was calculated based on the measured amount of evolved formic acid, using the following equation:38
4 Conclusions
In summary, we fabricated self-assembled urchin-like TkisAPP/G microspheres as a novel photocatalyst for artificial photosynthesis. The photocatalyst has been fully characterized through microscopy, thermal analysis, and spectroscopy. The urchin-like TkisAPP/G microspheres are capable of increasing the light-harvesting capacity and rate of reaction at which the reaction center receives excitation energy, which shows the highly active visible light photo-catalysis of the photocatalyst-enzyme coupled system for an efficient artificial photosynthetic production of formic acid from CO2. Under simulated sunlight, a 0.5% solar-to-formic acid conversion efficiency is achieved, which is much higher than that of natural photosynthesis. Photoelectrochemical studies have allowed the evaluation of photoelectron chemical properties and the origin of the photocatalytic activity of the photocatalyst. The present work demonstrates a new and promising photocatalyst-based artificial photosynthetic system for the ultimate goal of solar energy utilization in a tailor-made synthesis of fine chemicals and solar fuel from CO2.Acknowledgements
This work was supported by the National Natural Science Foundation of China (Grant No. 11474310 and 61605237), Natural Science Foundation of Jiangsu Province (Grant No. BK20150366, BK20150367, and BE2014061), Nanometer Project of Suzhou (ZXG201410 and SYG201623), and CAS-TWAS President's Fellowship for Z. Ullah (Student ID: 2013A8017808100). The authors are grateful for the technical support of Nano-X from Suzhou Institute of Nano-tech and Nano-Bionics, Chinese Academy of Sciences (SINANO).References
- G. S. Yfrach, P. A. Liddell, S. C. Hung, A. L. Moore, D. Gust and T. A. Moore, Nature, 1997, 385, 239 CrossRef.
- D. H. Kim, K. K. Sakimoto, D. C. Hong and P. D. Yang, Angew. Chem., Int. Ed., 2015, 54, 3259 CrossRef CAS PubMed.
- A. Listorti, J. Durrant and J. Barber, Nat. Mater., 2009, 8, 929 CrossRef CAS PubMed.
- K. K. Sakimoto, A. B. Wong and P. D. Yang, Science, 2016, 351, 74 CrossRef CAS PubMed.
- C. Liu, J. J. Gallagher, K. K. Sakimoto, E. M. Nichols, C. J. Chang, M. C. Y. Chang and P. Yang, Nano Lett., 2015, 15, 3634 CrossRef CAS PubMed.
- K. Maeda, R. Kuriki, M. Zhang, X. Wang and O. Ishitani, J. Mater. Chem. A, 2014, 2, 15146 CAS.
- J. Qin, S. Wang, H. Ren, Y. Hou and X. Wang, Appl. Catal., B, 2015, 179, 1 CrossRef CAS.
- Y. Zheng, L. Lin, B. Wang and X. Wang, Angew. Chem., Int. Ed., 2015, 54, 12868 CrossRef CAS PubMed.
- S. Wang and X. Wang, Angew. Chem., Int. Ed., 2016, 55, 2308 CrossRef CAS PubMed.
- O. Diwald, T. L. Tompson, T. Zubkov, E. G. Goralski, S. D. Walck and J. T. Yates, J. Phys. Chem. B, 2004, 108, 6004 CrossRef CAS.
- W.-J. Ong, L. K. Putri, L.-L. Tan, S.-P. Chai and S.-T. Yong, Appl. Catal., B, 2016, 180, 530 CrossRef CAS.
- W. G. Tu, Y. Zhou, Q. Liu, S. C. Yan, S. S. Bao, X. Y. Wang, M. Xiao and Z. G. Zou, Adv. Funct. Mater., 2013, 23, 1743 CrossRef CAS.
- W. J. Ong, L. L. Tan, S. P. Chai and S. T. Yong, Dalton Trans., 2015, 44, 1249 RSC.
- S. Wang, Y. Hou and X. Wang, ACS Appl. Mater. Interfaces, 2015, 7, 4327 CAS.
- C. Huang, C. Chen, M. Zhang, L. Lin, X. Ye, S. Lin, M. Antonietti and X. Wang, Nat. Commun., 2015, 6, 7698 CrossRef PubMed.
- W. J. Ong, L. L. Tan, Y. H. Ng, S. T. Yong and S. P. Chai, Chem. Rev., 2016, 116, 7159 CrossRef CAS PubMed.
- D. Zheng, C. Pang and X. Wang, Chem. Commun., 2015, 51, 17467 RSC.
- J. Lin, Z. Ding, Y. Hou and X. Wang, Sci. Rep., 2013, 3, 1056 Search PubMed.
- S. Wang, J. Lin and X. Wang, Phys. Chem. Chem. Phys., 2014, 16, 14656 RSC.
- J. G. Woller, J. K. Hannestad and B. Albinsson, J. Am. Chem. Soc., 2013, 135, 2759 CrossRef CAS PubMed.
- J. Otsuki, Coord. Chem. Rev., 2010, 254, 2311 CrossRef CAS.
- Y. Xu, L. Zhao, H. Bai, W. Hong, C. Li and G. Shi, J. Am. Chem. Soc., 2009, 131, 13490 CrossRef CAS PubMed.
- Y. Xu, Z. Liu, X. Zhang, Y. Wang, J. Tian, Y. Huang, Y. F. Ma, X. Y. Zhang and Y. S. Chen, Adv. Mater., 2009, 21, 1275 CrossRef CAS.
- D. G. Nocera, Acc. Chem. Res., 2012, 45, 767 CrossRef CAS PubMed.
- J. Lin, Z. Pan and X. Wang, ACS Sustainable Chem. Eng., 2014, 2, 353 CrossRef CAS.
- A. Polman and H. A. Atwater, Nat. Mater., 2012, 11, 174 CrossRef CAS PubMed.
- Z. Yu, A. Raman and S. Fan, Proc. Natl. Acad. Sci. U. S. A., 2010, 107, 17491 CrossRef CAS PubMed.
- Z.-P. Yang, L. Ci, J. A. Bur, S. Y. Lin and P. M. Ajayan, Nano Lett., 2008, 8, 446 CrossRef CAS PubMed.
- Z.-P. Yang, M.-L. Hsieh, J. A. Bur, L. Ci, L. M. Hanssen, B. Wilthan, P. M. Ajayan and S. Y. Lin, Appl. Opt., 2011, 50, 1850 CrossRef CAS PubMed.
- M. D. Kelzenberg, S. W. Boettcher, J. A. Petykiewicz, D. B. Turner-Evans, M. C. Putnam, E. L. Warren, J. M. Spurgeon, R. M. Briggs, N. S. Lewis and H. A. Atwater, Nat. Mater., 2010, 9, 239 CrossRef CAS PubMed.
- T. V. Teperik, F. J. García de Abajo, A. G. Borisov, M. Abdelsalam, P. N. Bartlett, Y. Sugawara and J. Baumberg, Nat. Photonics, 2008, 2, 299 CrossRef CAS.
- C. Battaglia, J. Escarré, K. Söderström, M. Charrière, M. Despeisse, F. J. Haug and C. Ballif, Nat. Photonics, 2011, 5, 535 CrossRef CAS.
- K. Kalyananasundram, J. Chem. Soc., Faraday Trans. 2, 1983, 79, 1365 RSC.
- K. Kalyanasundaram and M. Neumann-Spallart, J. Phys. Chem., 1982, 86, 5163 CrossRef CAS.
- M. E. El-Khouly, O. Ito, P. M. Smith and F. D'Souza, J. Photochem. Photobiol., C, 2004, 5, 79 CrossRef CAS.
- A. Wojcik and P. V. Kamat, ACS Nano, 2010, 4, 6697 CrossRef CAS PubMed.
- Z. Y. Liu, X. L. Li, F. W. Zhong, J. Li, L. J. Wang, Y. G. Shi and D. P. Zhong, J. Phys. Chem. Lett., 2014, 5, 69 CrossRef CAS PubMed.
- C. Liu, J. Y. Tang, H. M. Chen, B. Liu and P. D. Yang, Nano Lett., 2013, 13, 2989 CrossRef CAS PubMed.
- J. Barber, Chem. Soc. Rev., 2009, 38, 185 RSC.
- R. E. Blankenship, D. M. Tiede, J. Barber, G. W. Brudvig, G. Fleming, M. Ghirardi, M. R. Gunner, W. G. Junge, D. M. Kramer, A. Melis, T. A. Moore, C. C. Moser, D. G. Nocera, A. J. Nozik, D. R. Ort, W. W. Parson, R. C. Prince and R. T. Sayre, Science, 2011, 332, 805 CrossRef CAS PubMed.
Footnotes |
| † Electronic supplementary information (ESI) available. See DOI: 10.1039/c6ta07508h |
| ‡ These authors contributed equally. |
| This journal is © The Royal Society of Chemistry 2017 |

