Synthesis, structure and luminescence properties of novel NIR luminescent materials Li2ZnGe3O8:xMn2+†
Jinge
Cheng
,
Panlai
Li
*,
Zhijun
Wang
*,
Yuansheng
Sun
,
Qiongyu
Bai
,
Zhenling
Li
,
Miaomiao
Tian
,
Chao
Wang
and
Zhiping
Yang
College of Physics Science & Technology, Hebei Key Lab of Optic-Electronic Information and Materials, Hebei University, Baoding 071002, China. E-mail: li_panlai@126.com; wangzj1998@126.com
First published on 23rd November 2016
Abstract
A series of near-infrared (NIR) emitting Li2ZnGe3O8 (LZG):xMn2+ phosphors were synthesized via a conventional solid state reaction. They can be obtained by controlling the heating temperature (950 °C) or changing the doping concentration of Mn2+ (900 °C). In particular, due to the transition of the crystal from ZnO6 to ZnO4, the NIR phosphors perform with different spectral widths when the Zn/Mg ratio in LZG:xMn2+ is adjusted. The excitation spectrum is characterized by a broad band from 240 nm to 640 nm, centered at 475 nm and tailing on the low energy side. The emission spectrum presents a broad emission band from 650 to 900 nm with the main peak at 832 nm. Hence, the phosphors can convert visible and ultraviolet light to NIR emission. What's more, this kind of NIR phosphor is based on the mechanism of down-conversion, and it possesses excellent thermal effect properties.
1. Introduction
Up-conversion NIR phosphors have been used widely in traditional fields, including emergency signalling, image storage, and thermal sensors.1–4 These phosphors play an important role in monitoring physiological processes in living cells, organisms, and tissues because of their high resolution and high sensitivity.5–11 By comparison, down-conversion NIR phosphors are rarely investigated, but they also have profound development prospects.Phosphors doped with the transition metal ion Mn2+ show high luminescence efficiency and saturated color, and represent the group of phosphors whose properties have been most widely studied. In addition, Mn2+ activated luminescent materials show wide-ranging emission, depending on the crystal field and the coordination number (CN) of the host material.12–16 The emission consists of a 3d–3d broad band corresponding to the transition of Mn2+ from the excited 4T1g(4G) to the ground 6A1g(6S) state. The different crystal field strengths of Mn2+ can tune the emission color, which varies from green (strong crystal field) to orange/red (weak crystal field).17 In the field of phosphors, gallium germinates are usually selected as host materials to produce NIR phosphors.18–21
In our current work, a novel near-infrared (NIR) down-conversion has been demonstrated in LZG:xMn2+ phosphors. In particular, we found that the Mn2+-activated germinate could emit near-infrared light. The emission energies can be modulated through changing the composition and crystal structure of the host, therefore cationic substitution is a common route to tune the luminescence. In view of the above principle, a series of Li2Zn1−xMgxGe3O8:xMn2+ phosphors, with different spectral widths, were obtained by introducing the Mg2+ ion. For this phosphor, the excitation spectrum covers the visible and ultraviolet areas of the solar spectrum, and the emission spectrum corresponds to part of the NIR area of the solar spectrum. As we all know, solar energy could provide an abundant source of renewable energy. So it is significant to utilize solar energy efficiently. Commercial solar water heaters can absorb wide-ranging sunlight. However, it is easier to use NIR light to generate heat. This phosphor material could convert visible and ultraviolet light into NIR emission, and therefore it is significant for academic investigation.22
2. Experimental
2.1. Materials and synthesis
A series of phosphors with different compositions were synthesized by a conventional solid state reaction. The starting materials, including high purity GeO2 (99.999%), Li2CO3 (A.R.), ZnO (A.R.), MnCO3 (A.R.), and MgO (A.R.), were weighed in stoichiometric proportions, thoroughly mixed and ground using an agate mortar and pestle for more than 30 min until they were uniformly distributed. The samples of the LZG host were heated at 900, 925 and 950 °C for 3 h, the samples of LZG:xMn2+ (0 < x ≤ 0.2) were heated at 900 and 950 °C for 3 h, and Li2Zn1−xMgxGe3O8:3%Mn2+ was heated at 950 °C for 3 h. The obtained mixtures were naturally cooled to room temperature, and were then ground again to a powder, to finally obtain the test phosphors.2.2. Material characterization
The phase formation of the samples was examined by X-ray powder diffraction (XRD) performed on a Bruker D8 X-ray diffractometer with Ni-filtered Cu Kα radiation (λ = 0.15405 nm), operating at 40 mA and 40 kV. The step length and diffraction range were 0.05° and 10°–80°, respectively. Room-temperature photoluminescence spectra of the samples were recorded with a Hitachi F-4600 fluorescence spectrophotometer using a 450 W Xe lamp as the excitation source, with a scanning wavelength from 200 to 900 nm, scanning at 240 nm min−1. Furthermore, diffuse reflection spectra of the phosphors were recorded on a Hitachi U-4100 machine, in a scanning wavelength range of 200–800 nm. The thermoluminescence spectra of the samples were measured using a FJ-427A1 TL dosimeter with a fixed heating rate of 1 °C s−1 within the range of 25–300 °C. In addition, scanning electron micrograph (SEM) images were obtained using a Nova NanoSEM 650 instrument. All of the above measurements were performed at room temperature.3. Results and discussion
3.1. Crystal structure and spectral characteristics of the LZG host
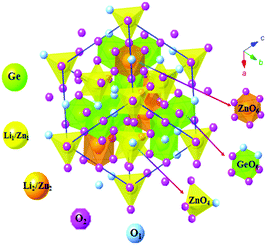
Fig. 1 shows the crystal structure of the LZG host. The initial structure model of LZG (JCPDS No. 24-0673) crystallizes in a cubic system (a = b = c) with the space group P4332. For the LZG crystal, there are two distinct Li+/Zn2+ sites, named Li1/Zn1 and Li2/Zn2. One is a tetrahedral site, which is occupied by Li1/Zn1 at 8c positions, and the other is an octahedral site, which is occupied by Li2/Zn2 at 4d positions. Herein, [ZnO4] and [ZnO6] represent the tetrahedral and octahedral coordination modes, respectively. The [ZnO4] and [ZnO6] are connected by O2− points, and they share edges or corners with [GeO4] octahedra to form a three-dimensional network, which can be observed clearly from Fig. 1.Fig. 2 presents the emission, excitation and diffuse reflection (DR) spectra of the LZG host, and the inset shows the [F(R) × hν]2 ∼ hν curve. The emission band ranges from 350 to 600 nm, and the main peak is located at 414 nm. DR shows a status of high reflection in the wavelength range from 400 to 800 nm, and the decrease in intensity from 200 to 400 nm can be attributed to the host absorption band. The Kubelka–Munk absorption coefficient F(R∞) relationship is often used to approximately determine the absorption edge from the obtained diffuse reflectance spectrum23–25
| [F(R∞)hν]n = A(hν − Eg) | (1) |
| F(R∞) = (1 − R)2/2R | (2) |
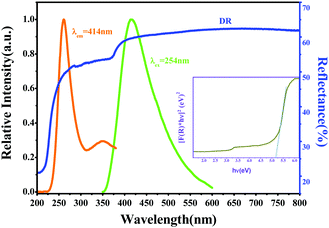 | ||
| Fig. 2 The emission, excitation, and diffuse reflection spectra of the LZG host. The inset shows the [F(R) × hν]2 ∼ hν curve of the host. | ||
3.2. Intensity-tunable LZG:xMn2+ phosphors
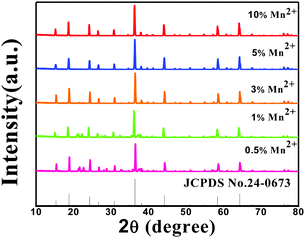
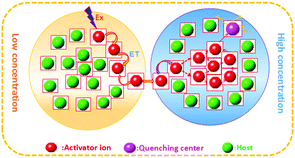
The composition and phase purity of the host were investigated by XRD. Fig. S1 (ESI†) shows the XRD patterns of the LZG host with different heating temperatures. It is evident that the impurity peaks disappear at 950 °C. Fig. 3 shows the XRD patterns of the LZG:xMn2+ (0 < x ≤ 0.1) samples heated at 900 °C for 3 h. In contrast to Fig. S2 (ESI†), we could see that the phosphors show impurity peaks when the concentration was controlled below 0.03. However, the XRD patterns matched well with standard JCPDS No. 24-0673 (cubic phase) when the value of x was greater than 0.03. As a result, we could also obtain pure NIR phosphors (900 °C) by controlling the Mn2+ ion doping concentration. Relying on the above results, it could be assumed that the low melting point of MnCO3, as a fusing agent, could effectively reduce the synthesis temperature in this kind of specific mixture.The PLE (photoluminescence excitation) and PL spectra of the LZG:xMn2+ (x = 0.005, 0.01, 0.03, 0.05, 0.07, 0.10, 0.15, 0.20) phosphors are presented in Fig. 4(a) and (b), respectively. As shown in Fig. 4(a), LZG:xMn2+ has a broad PLE spectrum band (monitored at 475 nm), and it covers the spectral region well from 240 to 640 nm. It can be seen that the excitation spectra consist of two distinct broad peaks at about 350 and 475 nm. Fig. 4(b) shows the PL spectra of LZG:xMn2+ (x = 0.05–0.2). Under blue light excitation (475 nm), the phosphor shows weak green emission corresponding to the 4T1(4G)–6A1(6S) transition of the Mn2+ ions. With an increase in Mn2+ concentration, the luminescence properties can be affected by the crystal field strongly within the 3d shell. Furthermore, it can be seen that the PL (λem = 832 nm) intensity rapidly increases with an increase in Mn2+ content from 0.005 to 0.03, and reaches a maximum at about 0.03. The intensity then decreases with x beyond the critical concentration. Above this maximum intensity, a concentration quenching phenomenon occurs, as shown in Fig. 4(d). Essentially, concentration quenching is a decline process of the emission intensity caused by quenching of impurities. The same activation ions of the phosphor are located in the same excitation energy state. When the concentration of the activator is increased, these energy states will be close enough together that energy transfer between the energy states can happen easily. The wide and quick energy transfer consequently makes the energy spread across to the centers of the quenching impurity, and vanish into the lattice through vibration of the host, which leads to a decrease of the luminescence intensity, as shown in Fig. 5. In addition, concentration quenching mainly originates from nonradiative energy transfer between Mn2+ ions within a certain distance. And three mechanisms may be responsible for the nonradiative energy transfer, which are exchange interaction, radiation reabsorption and multipolar interaction. According to the critical concentration, the critical distance (Rc) of Mn2+ ions is determined using the following formula given by Blasse:30
 | (3) |
 | (4) |
 | (5) |
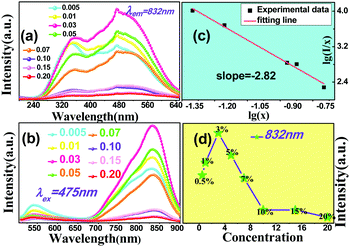 | ||
| Fig. 4 (a) PLE and (b) PL spectra of the LZG:xMn2+ samples (0 < x ≤ 0.2). (c) The fitting line of log(I/x) vs. log(x). (d) The change of intensity with different Mn2+ doping concentrations. | ||
For this section, the ratio of log(I/x) and log(x) is equal to the value of (−θ/3). According to Fig. 4(c), the slope is −2.82, which means that the value of θ is close to 8. Therefore the concentration quenching of Mn2+ ions in the LZG host should originate from quadrupole–quadrupole interactions.
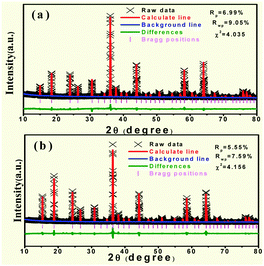
Fig. 6(a) and (b) show the Rietveld analysis patterns of the LZG host and LZG:3%Mn2+ by a General Structure Analysis System (GSAS) method, in which the red solid lines, black crosses, olive lines and wine red bars represent the calculated patterns, experimental patterns, differences and Bragg positions, respectively. The deviation between the calculated and experimental results is expressed by olive bars, which are shown between the background line (blue line) and the Bragg reflection line. The initial structure model of LZG (JCPDS No. 24-0673), which crystallizes in a cubic system with the space group P4332, was used to refine the above sample. The refined results indicate that all atom coordinates and fraction factors, as well as thermal vibration parameters were fitted well under the reflection conditions, Rp = 6.99%, 5.55%, Rwp = 9.05%, 7.59% and χ2 = 4.035, 4.156, respectively, which illustrates that there is no detectable impurity phase observed in these obtained samples. More detailed information regarding the refinement can be found in Table S1 (ESI†). In contrast to the host, the crystal cell parameters of LZG:3%Mn2+ were slightly bigger. In consideration of the Mn2+ (0.67 Å) and Zn2+ (0.60 Å) ion radius size, the results in the table are reasonable when Zn2+ was substituted by Mn2+.
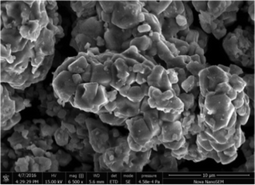
Similarly, the morphology of LZG:3%Mn2+ is presented in Fig. 7. The LZG:3%Mn2+ sample consists of neck-like particles, with a smooth surface, agglomerating with each other. The particles can be obtained at a relatively low temperature of 950 °C, attributed to the starting materials Li2CO3 and MnCO3, for which the fusion points are 723 °C and 350 °C respectively. They can play the role of flux, then melt and cover the other components to form these particles, and also result in the serious agglomeration. The observed “sintering necks” suggest that grain growth has occurred during the synthesis procedure.
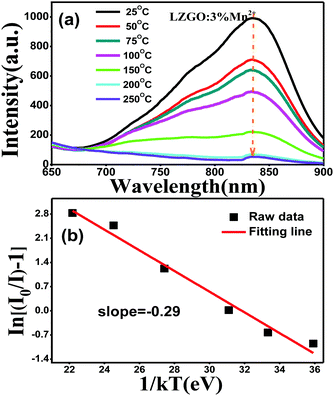
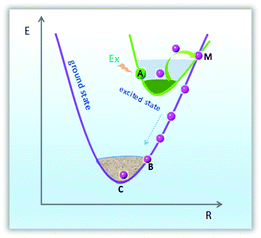
Thermal stability is a crucial technological parameter for a phosphor, and should be an indispensable parameter to be taken into account. The phosphor should maintain a stable emission efficiency for a long period of time. In order to assess the influence of temperature on luminescence and determine the activation energy for thermal quenching, the temperature-dependent photoluminescence emission (PL) spectra (25–250 °C) for the LZG:3%Mn2+ sample under 475 nm excitation were measured and plotted in Fig. 8(a). As is depicted, the relative PL emission intensity at 832 nm gradually decreases with a constantly increasing temperature from room temperature, 25 °C, to 250 °C. Generally, the decrease in emission intensity is ascribed to thermal quenching of the emission intensity via phonon interaction. The phonon energy will increase with an increase in temperature, therefore the transition probability and absorption intensity will decrease. In the process of field emission, the electrons in the excited state emit phonons; then the phonons relax to a lower energy level. Finally, the intensity of emission is decreased. Configuration coordinate charts can clearly illustrate the process, as shown in Fig. 9. Firstly, the luminescent center was excited to point A. Meanwhile, if the temperature is high, the A position is likely to get high phonon energy, leading the energy of the system to the M position. As the M position is also on the curve of the ground state, energy is likely to relax back to the C position along the M–B–C path. The system has non-radiatively decreased from the excited state to the balanced A position of the ground state, therefore the temperature quenching phenomenon must have happened.
To evaluate the activation energy (Ea) for thermal quenching and to further understand the thermal quenching phenomenon, activation energy graphs showing the relationship of ln[(I0/I) − 1] versus 1/kT for representative samples are plotted in Fig. 8(b) according to the following expression raised by Arrhenius:33–35
 | (6) |
Herein, I0 refers to the original emission intensity at room temperature (25 °C) and IT is the emission intensity at different operating temperatures. c represents a constant for an assigned host, ΔE is the activation energy of thermal quenching (which indicates the necessary energy to raise the electron from the relaxed excited energy level into the host lattice conduction band), and k refers to the Boltzmann constant (8.626 × 10⁻⁵ eV). According to the equation, a plot of ln[(I0/IT) − 1] vs. 1/kT yields a straight line, and the activation energy, ΔE, is obtained from the slope of the plot. As shown in Fig. 8(b), ΔE is calculated to be 0.29 eV. The relatively high activation energy results in good thermal stability for this phosphor.
3.3. Width-tunable Li2Zn1−xMgxGe3O8 (LZMG):3%Mn2+ phosphors
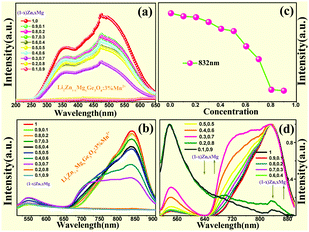
Fig. 10(b) and (d) show the tunable spectra width and intensity achieved by adjusting the Zn/Mg ratio in LZMG:3%Mn2+. The emission spectra exhibit an obvious broadening when the Mg2+ content is increased. For the LZG crystal, Zn2+ has two sites named Zn1 and Zn2. Zn1 connects with four oxygen atoms, and the average bond length is 1.995 Å. However, Zn2 connects with six oxygen atoms, and the Zn22+–O2+ bond length is 2.111 Å. It is easier to breach Zn22+–O2+ bonds when the much smaller Mg2+ ion substitutes for Zn2+ even though it is an isovalent Mg2+/Zn2+ substitution. In other words, the longer the bond length is, the more likely it is to be damaged. Finally, the Zn2 site has a bigger Mg–O distance, in contrast to the Zn1 site.36 Furthermore, the newly formed Mg2–O bonds would become more slack and the strain of the Mg2–O bonds would decrease when Mg2+ ions occupy the sites of Zn2 in contrast to Zn1. Thus, the bonds of Mg2–O are easily broken. As a result, it is easy for the [ZnO6] unit to become [MgO4] or [ZnO4] in the LZG crystal, which generates defects leading to the obvious broadening of the emission spectra. A schematic of the luminescence process illustrates the broadening of the emission spectra, as shown in Fig. 11. In addition, Fig. 12 represents part of the TL spectra of the LZMG:3%Mn2+ samples. One broad thermal peak formed by defects is observed, which further verifies our speculation. The [ZnO6] group's transition in the crystal is responsible for the improvement of defects, which further widens the spectral width. Fig. S3 (ESI†) shows part of the Rietveld analysis patterns of LZMG:3%Mn2+ by GSAS methods. According to the data in Table S2 (ESI†), we can see that the crystal cell parameters of the samples decrease gradually with an increase in Mg2+ ions (0.49 Å) in LZMG:3%Mn2+, which should be mainly ascribed to lattice contraction. Besides, with an increase in the Zn/Mg ratio, the excitation intensity also declines, as shown in Fig. 10(a). A possible explanation is that the substitution in LZMG:3%Mn2+ generates defects, resulting in the enhancement of the nonradiative transition of the host, and finally quenches the luminescence.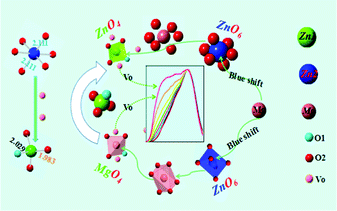 | ||
| Fig. 11 A schematic of the luminescence process illustrating the broadening of the emission spectra. | ||
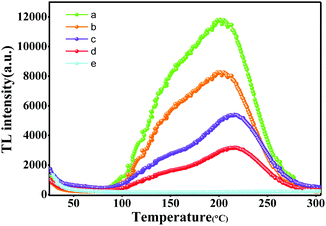 | ||
| Fig. 12 TL spectra of Li2Zn1−xMgxGe3O8:3%Mn2+: (a) Li2Zn0.1Mg0.9Ge3O8:3%Mn2+, (b) Li2Zn0.3Mg0.7Ge3O8:3%Mn2+, (c) Li2Zn0.5Mg0.5Ge3O8:3%Mn2+, (d) Li2Zn0.7Mg0.3Ge3O8:3%Mn2+, and (e) Li2ZnGe3O8:3%Mn2+. | ||
4. Potential application of the near-infrared phosphors
Fig. 13 shows the normalized PLE and PL spectra of the NIR phosphor. Herein, the blue background is the solar spectrum. We can see that the PLE spectrum consists of a blue excitation band around 475 nm, which agrees with the maximum photon flux region of the solar spectrum. Meanwhile, the excitation band covers the ultraviolet and visible light regions. Importantly, the phosphor shows NIR emission ranging from 650 to 900 nm, matched with NIR light from the solar spectrum. However, the light of near-infrared regions generates heat easily. Based on the above analysis, the phosphor may be used as a photo-thermal conversion material converting ultraviolet and visible light to NIR light. Then, NIR light could be used in commercial solar water heaters and improve their efficiency.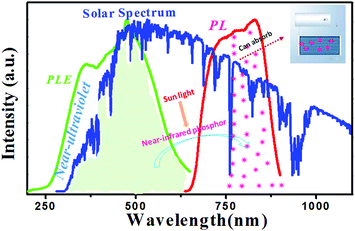 | ||
| Fig. 13 Normalized PLE spectrum (green line), PL spectrum (red line), and solar spectrum (blue line). | ||
5. Conclusion
In summary, a series of LZG:xMn2+ phosphors have been synthesized via a conventional solid state reaction. LZG:xMn2+ can be obtained by increasing the heating temperature or by changing the doping concentration of Mn2+. In addition, NIR phosphors with different spectral widths can be obtained by adjusting the Zn/Mg ratio in LZ1−xMxG:xMn2+. A possible explanation is that there are defects from the ZnO6 group’s transition to ZnO4 or MgO4, which is associated with their different ionic radii and the Zn–O bond length. The PL spectrum of LZG:xMn2+ presents a broad emission band from 650 to 900 nm, with a main peak at 832 nm. The excitation spectrum is characterized by a broad band from 240 nm to 640 nm, centered at 475 nm, tailing on the low energy side. The NIR phosphors have good thermal stability because of their relatively high activation energy. The LZG:xMn2+ phosphor, as a photo-thermal conversion material, has a potential application for academic investigation.Acknowledgements
The work is supported by the China Postdoctoral Science Foundation funded project (No. 2015M58131), the Funds for Distinguished Young Scientists of Hebei Province, China (No. A2015201129), the Natural Science Foundation of Hebei Province (No. A2014201035, E2014201037), the Education Office Research Foundation of Hebei Province, China (No. ZD2014036, QN2014085), and the National Natural Science Foundation of China (No. 50902042, 51672066).References
- T. Maldiney, G. Sraiki, B. Viana, D. Gourier, C. Richard, D. Scherman and P. F. Smet, Opt. Mater. Express, 2012, 2, 261–268 CrossRef CAS.
- P. F. Smet, D. Poelman and M. P. Hehlen, Opt. Mater. Express, 2012, 2, 452–454 CrossRef.
- A. Abdukayum, J. T. Chen, Q. Zhao and X. P. Yan, J. Mater. Chem. C, 2013, 135, 14125–14133 CAS.
- Z. Pan, Y. Y. Lu and F. Liu, Nat. Mater., 2012, 11, 58–63 CrossRef CAS PubMed.
- N. Bogdan, E. M. Rodríguez, F. Sanz-Rodríguez, M. C. I. de la Cruz, Á. Juarranz, D. Jaque and J. A. Capobianco, Nanoscale, 2012, 4, 3647–3650 RSC.
- L. Cheng, K. Yang, M. Shao, S. T. Lee and Z. Liu, J. Phys. Chem. C, 2011, 115, 2686–2692 CAS.
- D. K. Chatterjee, A. J. Rufaihah and Y. Zhang, Biomaterials, 2008, 29, 937–943 CrossRef CAS PubMed.
- H. G. Frey, S. Witt, K. Felderer and R. Guckenberger, Phys. Rev. Lett., 2004, 93, 200801 CrossRef PubMed.
- J. Pichaandi, J. C. Boyer, K. R. Delaney and F. C. van Veggel, J. Phys. Chem. C, 2011, 115, 19054–19064 CAS.
- G. Yi, H. Lu, S. Zhao, Y. Ge, W. Yang, D. Chen and L. H. Guo, Nano Lett., 2004, 4, 2191–2196 CrossRef CAS.
- J. Ryu, H. Y. Park, K. Kim, H. Kim, J. H. Yoo, M. Kang and R. Song, J. Phys. Chem. C, 2010, 114, 21077–21082 CAS.
- X. J. Wang, D. Jia and W. M. Yen, J. Lumin., 2003, 102, 34–37 CrossRef.
- C. J. Duan, A. C. A. Delsing and H. T. Hintzen, J. Mater. Chem. A, 2009, 21, 1010–1016 CrossRef CAS.
- K. Li, D. Geng, M. Shang, Y. Zhang, H. Lian and J. Lin, J. Phys. Chem. C, 2014, 118, 11026–11034 CAS.
- J. C. Zhang, L. Z. Zhao, Y. Z. Long, H. D. Zhang, B. Sun and W. P. Han, Chem. Mater., 2015, 27, 7481–7489 CrossRef CAS.
- E. Song, S. Ding and M. Wu, Adv. Opt. Mater., 2014, 2, 670–678 CrossRef CAS.
- L. Shi, Y. Huang and H. J. Seo, J. Phys. Chem. A, 2010, 114, 6927–6934 CrossRef CAS PubMed.
- D. Chen, Y. Chen, H. Lu and Z. Ji, Inorg. Chem., 2014, 53, 8638–8645 CrossRef CAS PubMed.
- X. S. Wang, W. S. Li, J. Q. Situ, X. Y. Ying, H. Chen, Y. Jin and Y. Z. Du, RSC Adv., 2015, 5, 12886–12889 RSC.
- X. Fu, C. Liu, J. Shi, H. Man, J. Xu and H. Zhang, Opt. Mater., 2014, 36, 1792–1797 CrossRef CAS.
- Y. Wu, Y. Li, X. Qin, R. Chen, D. Wu and S. Liu, J. Alloys Compd., 2015, 649, 62–66 CrossRef CAS.
- F. C. Palilla, A. K. Levine and M. R. Tomkus, J. Electrochem. Soc., 1968, 115, 642–644 CrossRef CAS.
- Z. Jiang, Y. Wang and L. Wang, J. Electrochem. Soc., 2010, 157, J155–J158 CrossRef CAS.
- X. Chen, Z. Xia and Q. Liu, J. Lumin., 2014, 130, 1818–1824 Search PubMed.
- C. H. Huang and T. M. Chen, Inorg. Chem., 2011, 50, 5725–5730 CrossRef CAS PubMed.
- N. Yamashita, J. Phys. Soc. Jpn., 1973, 35, 1089–1097 CrossRef CAS.
- X. Chen, Z. Xia and Q. Liu, Dalton Trans., 2014, 43, 13370–13376 RSC.
- Y. Jia, R. Pang, H. Li, W. Sun, J. Fu, L. Jiang and R. S. Liu, Dalton Trans., 2015, 44, 11399–11407 RSC.
- J. Hao and M. Cocivera, J. Phys. D: Appl. Phys., 2002, 35, 433 CrossRef CAS.
- G. P. R. L. Blasse, Appl. Phys. Lett., 1968, 28, 444–445 CrossRef CAS.
- S. Xin, Y. Wang, Z. Wang, F. Zhang, Y. Wen and G. Zhu, Electrochem. Solid-State Lett., 2011, 14, H438–H441 CrossRef CAS.
- D. L. Dexter and W. B. Fowler, J. Chem. Phys., 1967, 47, 1379–1384 CrossRef CAS.
- R. J. Xie, N. Hirosaki, N. Kimura, K. Sakuma and M. Mitomo, Appl. Phys. Lett., 2007, 90, 1101 Search PubMed.
- M. Shang, J. Wang, J. Fan, H. Lian, Y. Zhang and J. Lin, J. Mater. Chem. C, 2015, 3, 9306–9317 RSC.
- Z. Xia, X. Wang, Y. Wang, L. Liao and X. Jing, Inorg. Chem., 2011, 50, 10134–10142 CrossRef CAS PubMed.
- G. Li, Y. Tian, Y. Zhao and J. Lin, Chem. Soc. Rev., 2015, 44, 8688–8713 RSC.
Footnote |
| † Electronic supplementary information (ESI) available. See DOI: 10.1039/c6tc03416k |
| This journal is © The Royal Society of Chemistry 2017 |

