Intracellular investigation on the differential effects of 4 polyphenols on MCF-7 breast cancer cells by Raman imaging
A.
Mignolet
a,
B. R.
Wood
 b and
E.
Goormaghtigh
 *a
*a
aCenter for Structural Biology and Bioinformatics, Laboratory for the Structure and Function of Biological Membranes; Université Libre de Bruxelles, Campus Plaine, Bld du Triomphe 2, CP206/2, B1050 Brussels, Belgium
bCentre for Biospectroscopy, School of Chemistry, Monash University, Victoria 3800, Australia
First published on 1st December 2017
Abstract
The past decades have seen significant interest in the study of polyphenolic compounds as potential therapeutic agents in medicine because they display a vast array of cellular effects beneficial to treat or manage a plethora of chronic diseases including inflammatory diseases, cardiovascular abnormalities and several types of cancer. These compounds act at different stages of carcinogenesis but deciphering their mode of action is a complex task. Live MCF-7 breast cancer cells were investigated using Raman imaging to evaluate the perturbations induced after incubating cells with four different polyphenols: EGCG, gallic acid, resveratrol and tannic acid. First, clear spectral changes could be observed between the spectra of the cytoplasm and the nucleus of live MCF-7 cancer cells demonstrating a difference in their respective global chemical composition. The treatments induced significant modifications in the cells but no clear common pattern of modifications from the 4 drugs could be observed in the cell spectra in the 1800–600 cm−1 region. The high spatial resolution of Raman confocal microscopy enabled both the nucleus and cytoplasm to be independently targeted to study the impact of the polyphenols on the cell line. Positive spectral variations at 2851 cm−1 and 2920 cm−1 as well as in the 1460–1420 cm−1 and 1660–1650 cm−1 spectral regions inside cell cytoplasm reflected an increase of the lipid content after exposure to polyphenols. Lipid accumulation appears to be an early biomarker of drug-induced cell stress and subsequent apoptosis. Interestingly an increase of cytochrome c into the cytosol was also induced by EGCG. These multiple events are possibly associated with cell apoptosis. In conclusion, Raman micro-spectroscopy provides a complementary spectroscopic method to realize biological investigations on live cancer cells and to evaluate the effects of polyphenols at the subcellular level.
Introduction
Polyphenolic compounds constitute one of the largest groups of plant metabolites. They display a vast array of molecular structures and cellular effects. In the past few decades, significant advances enabled researchers to investigate the potential use of phytochemicals to treat or manage a plethora of chronic diseases including inflammatory diseases, cardiovascular abnormalities and various types of cancers.1 In fact, antitumor properties of some polyphenols such as curcumin have been shown to affect the different stages of carcinogenesis.2,3 To better understand the effects of polyphenolic treatments on breast cancer cells for improved targeted therapies, a study of the metabolic modifications induced by polyphenols at subcellular level is required.The range of cellular effects induced by a polyphenol can be very broad and therefore difficult to assess. In the last few years, vibrational spectroscopy, including Fourier transform infrared (FTIR) spectroscopy and Raman spectroscopy have been extensively applied to address various biomedical questions. Raman micro-spectroscopy (RMS) is a vibrational technique that enables molecular imaging of live cells at the cellular level. The Raman effect relies on the inelastic photon scattering of incoming monochromatic laser light (visible, near infrared or near-ultraviolet range laser) by the molecules of a sample. It combines high spatial resolution and non-destructive chemical analysis of biological samples.4,5
Almost all molecules are Raman active, so no external label is required and each biochemical constituent possesses a specific vibrational spectrum that can be used as potential biomarkers.6,7 Therefore the assessment of the global molecular composition of any biological sample, and even the detection of any disturbance of that composition, is possible. Moreover, because water is a weak Raman scatterer, the technique is ideally suited to investigating live cells. The main drawback of the technique is the low Raman scattering efficiency of biological macromolecules. This has been largely overcome by the emergence of high-quality lasers, very sensitive CCD cameras and high quality optical elements that allow the detection of Raman scattered light with much more efficiency.7
Early works on living cells using Raman spectroscopy were realized back into the 90s when Puppels and his team performed Raman spectroscopic measurements on chromosomes in a living Drosophila cell.7,8 The high spatial resolution enabled single cell analysis and provided information at the subcellular level.9,10 This paved the way for many investigations into various biological phenomena using RMS such as the identification of pathological states of cells, the monitoring of their differentiation, transformation and viability and providing insights into the metabolism and the intracellular chemical reactions.11
More recently, considerable advances enabled its use in various medical applications e.g. real-time in vivo cancer diagnosis (early detection of cancer),12,13 Alzheimer's disease early-diagnostics14 or even in-depth investigation of malaria15–17 at both the cellular and molecular level. As a potential clinical tool for cancer diagnosis, RMS combined with statistical methods enabled the discrimination of malignant and pre-malignant biochemical changes and the difference between normal and cancerous tissues and cells.18–21 Due to its high sensitivity and specificity to molecular and structural changes, RMS has become a cutting-edge tool to follow changes in bio-cellular processes. It is now well demonstrated that RMS is a well-suited tool to detect and monitor alterations in biochemical composition over time at the subcellular level.9,22
In the presence of polyphenols, breast cancer cells experience a large variety of biochemical modifications.23,24 By providing a unique fingerprint of the metabolic effects of drugs in vitro, this spectral technique could help obtain a more global and accurate insight into the multiple biochemical processes mediated by drugs. Understanding the biological events that are taking place at a cellular and subcellular level after exposure to a drug would contribute significantly to the development of more specific and personalized chemotherapies.25 Here a study at the subcellular level was performed on live MCF-7 breast cancer cells to evaluate the perturbations caused within the cells by four polyphenols: epigallocatechin gallate (EGCG), gallic acid, resveratrol and tannic acid. MCF-7 cancer cells were exposed to polyphenols at their respective IC50 during 24 hours before recording the Raman images.
Materials and methods
Cell culture
The human mammary breast cancer cell line MCF-7 was acquired from the American Type Culture Collection (ATCC, Manassas, VA) and was maintained according to the supplier's instructions. The cells were grown in a constant humidified atmosphere of 5% CO2 in air and were kept in exponential growth in α-MEM medium supplemented with 10% fetal bovine serum (FBS), 2% penicillin/streptomycin (an antibiotic solution) and 1% L-glutamine. Cell culture medium and antibiotics were purchased from Lonza Australia and the FBS from Life Technologies (Thermo Fisher Scientific Australia).Drug concentrations used throughout this work to treat the cancer cells are the IC50 concentrations defined as the drug concentration required for decreasing the global growth of a given cell population by 50% after 72 h of cell culture. This concentration was evaluated for each studied drug using an adenosine triphosphate (ATP) monitoring system in cultured mammalian cells based on firefly luciferase. This cell viability test is based on a luminescence assay measuring the ATP using the firefly luciferase–luciferin system (ATP kit, ATPlite, PerkinElmer; USA).26 Thus, ATP is a marker for cell viability and its concentration decreases quickly when cells undergo necrosis and apoptosis. MCF-7 breast cancer cells were seeded in 96-microwell plates with 4000 cells per well and incubated for 24 h to ensure adequate cell adhesion before treatment. Cells were then exposed to increasing concentrations of polyphenols from 10 nM up to 100 μM for 72 h and treated-cell population growth was compared to the control one (non-treated cells) by means of the ATP assay. The number of living cells left after 72 h of exposure to the various compounds (or in absence of any treatment) is directly proportional to the intensity of the light emitted caused by the reaction of ATP with added luciferase and luciferin. The measure of light emitted was performed using a Berthold luminometer. Each experiment was carried out in sextuplicate.
Raman spectroscopy
Raman images were recorded using a WITec Confocal Raman Microscope (WITec alpha300 R, Ulm, Germany) equipped with an air cooled solid state laser working at 532 nm. For sample preparation, 400![[thin space (1/6-em)]](https://www.rsc.org/images/entities/char_2009.gif) 000 cells were seeded onto Raman grade CaF2 windows, and incubated for 24 h to ensure adequate cell adhesion to the substrate before treatment. The Raman grade CaF2 windows were purchased from Crystran (Dorset, United Kingdom). The cells were counted using a Neubauer cell counter and the number of cells was determined to reach about 70% of confluence after 48 h of incubation. Once the cells were exposed to the drug for 24 hours, the CaF2 slide was retrieved and placed into two baths of PBS (5 to 10 seconds each) prior to measurements to remove residual culture media. The slide was then immersed in PBS to maintain cells under osmotic conditions for at least 3 hours while recording Raman images. From each slide, 2 maps of 60 μm × 60 μm were collected with an integration time of 1 second. The spectra were collected every 1 μm. The laser power was never set higher than 10 mW to avoid damaging the cells.
000 cells were seeded onto Raman grade CaF2 windows, and incubated for 24 h to ensure adequate cell adhesion to the substrate before treatment. The Raman grade CaF2 windows were purchased from Crystran (Dorset, United Kingdom). The cells were counted using a Neubauer cell counter and the number of cells was determined to reach about 70% of confluence after 48 h of incubation. Once the cells were exposed to the drug for 24 hours, the CaF2 slide was retrieved and placed into two baths of PBS (5 to 10 seconds each) prior to measurements to remove residual culture media. The slide was then immersed in PBS to maintain cells under osmotic conditions for at least 3 hours while recording Raman images. From each slide, 2 maps of 60 μm × 60 μm were collected with an integration time of 1 second. The spectra were collected every 1 μm. The laser power was never set higher than 10 mW to avoid damaging the cells.
Data analyses
Results
Determination of IC50 growth inhibitory concentrations for 4 polyphenolic compounds
The IC50 (concentration required to decrease cell growth by 50% after 72 hours) of the 4 polyphenols was evaluated for the MCF-7 breast cancer cell line using the ATP cell viability assay. This is a common method in pharmacology to normalize and compare the effects of various cytostatic/cytotoxic drugs. The IC50 values are summarized in Table 1 and vary between 10 and 60 μM.| Polyphenols | MCF-7 |
|---|---|
| IC50 (μM) | |
| Tannic acid | 17.7 ± 3.4 |
| Gallic acid | 54.9 ± 16.9 |
| Resveratrol | 9.6 ± 2.5 |
| EGCG | 34.6 ± 5.8 |
Raman images of untreated MCF-7 cells: nucleus versus cytoplasm compartment
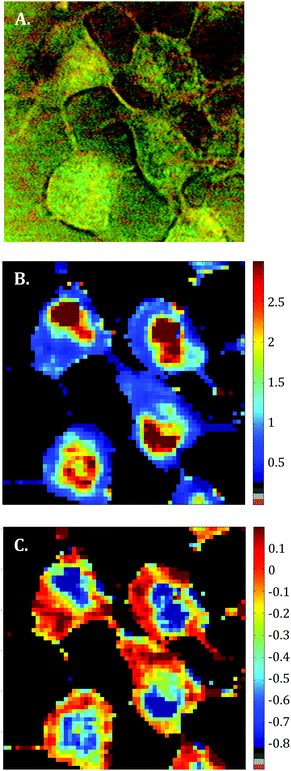
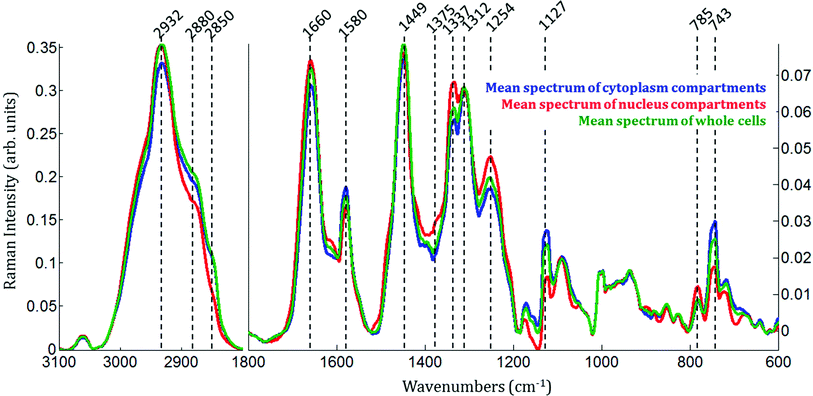
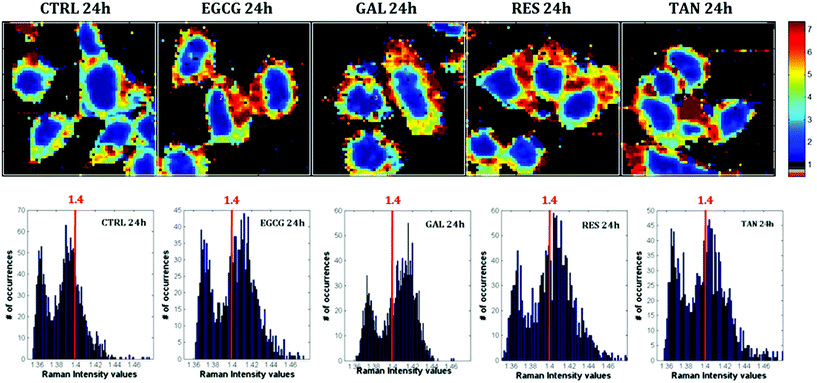
Raman images of live MCF-7 breast cancer cells were recorded. Following image processing, the cell spectra were extracted for subsequent analysis. First we extracted the spectra associated with whole cells and a mean spectrum from 4 or 5 cells was calculated for each image to provide a global view of the polyphenol effects on MCF-7 cells. Then we extracted the spectra associated only with the nucleus and cytoplasm separately. This was achieved by segmenting the Raman images by computing the 1235/2844 cm−1 intensity ratio (nucleic acids vs. lipids). Spectra associated with the nuclei of cells appear red-orange when the 1235/2844 cm−1 intensity ratio is larger than 2 (I1235/I2844 > 2) (see Fig. 1B). Even though the nucleus cannot be identified on the bright-light visible image (see Fig. 1A), its shape and size in the Raman image perfectly match the nuclei of MCF-7 cells fixed and stained (not shown). The rest of the cell was assigned to the cytoplasm. A similar result was obtained upon computing the 1150/2844 cm−1 intensity ratio (carbohydrates vs. lipids). Now the pixels associated with the cytoplasm of cells appear in red (I1150/I2844 > −0.2) (see Fig. 1C). The mean spectra from whole cells and from the different compartments are shown in Fig. 2.As expected, there are clear visible spectral variations between the mean spectra of the cytoplasm and nucleus compartments. When comparing the mean spectrum of the cytoplasm compartments (blue) with the mean spectrum of the nucleus compartment (red), more intense bands are observed near 743, 1127, 1580, 2850 and 2880 cm−1 and less intense bands near 785, 1254, 1337, 1375, 1660 and 2932 cm−1. The mean spectrum of whole cells (green) represents an average of the mean spectra of both compartments.
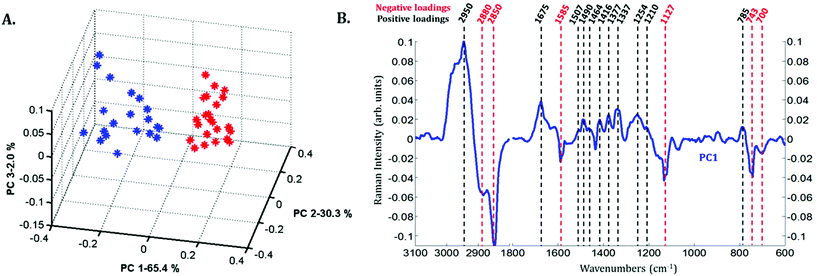
Principal component analysis (PCA) was performed on the extracted mean spectra from each Raman image for both the nucleus and cytoplasm. The PCA scores plot is presented in Fig. 3A. A clear discrimination along PC1 can be observed between the spectra of the cytoplasm (in blue) and the nucleus (in red) of MCF-7 cancer cells demonstrating differences in their chemical composition. The first principal component (PC1) shown in Fig. 3B is characterized by positive loadings near 785, 1210, 1254, 1337, 1377, 1416, 1464, 1490, 1507, 1675 and 2950 cm−1 and by negative loadings near 700, 743, 1127, 1585, 2850 and 2880 cm−1. The spectral variations observed in Fig. 2 are in agreement with the PC1 loadings plot, which explains the largest source of variance between the two sets of spectra.
Study of the effects of 4 polyphenols on live MCF-7 breast cancer cells
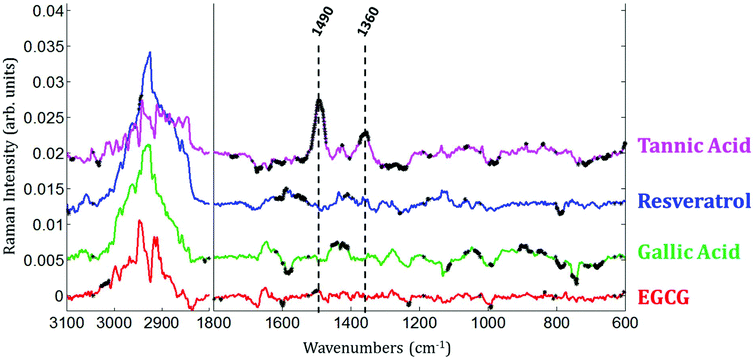
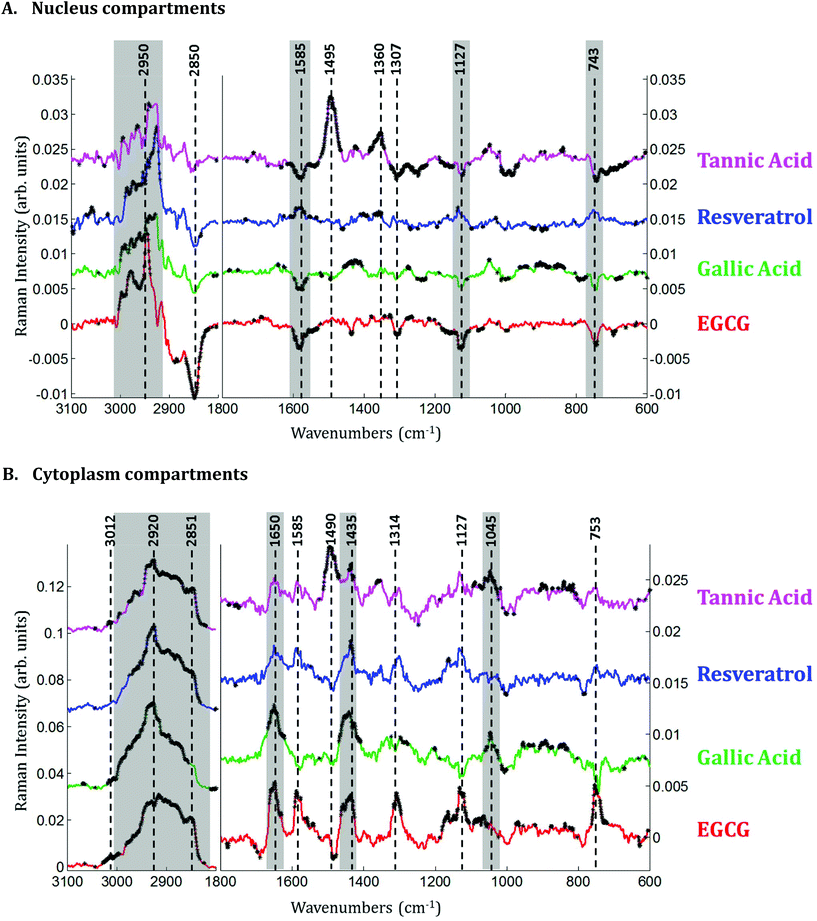
Raman images of live MCF-7 breast cancer cells exposed to EGCG, gallic acid, resveratrol and tannic acid at their respective IC50 values for 24 hours were recorded. At the same time, Raman images of the untreated MCF-7 breast cancer cells were also recorded as controls. Once the Raman images were completely pre-processed (background removal, baseline correction and vector normalization), the spectra of whole cells were extracted. To reveal the spectral variations induced by each of the four polyphenols, the mean spectrum of untreated cells (control) was subtracted from the mean spectrum of treated cells. The experiment was repeated three times for each treatment. A Student t-test was performed at every wavenumber value using a 5% significance level. Wavenumber values that show a significant difference are indicated by the thicker black lines on the difference spectra (polyphenol-treated minus untreated). Fig. 4 shows spectral variations between the mean spectrum of treated and untreated cells. These spectral variations are clearly not due to the spectral contribution of the polyphenol themselves which have quite distinct spectra (data not shown).The data set enables a statistical comparison between the spectra of live MCF-7 cells exposed to each of the polyphenols for 24 hours and control cells. The polyphenolic treatments induced significant modifications but no clear common pattern of modifications could be observed for the four polyphenols in the 1800–600 cm−1 spectral region. EGCG and resveratrol induced only a few spectral variations compared to gallic acid and tannic acid. The most significant variations can be found near the bands centered at 1360 cm−1 and 1490 cm−1 after tannic acid treatment but these changes were not observed when using the other compounds.
In the second step, the spectra associated with the nuclei and the cytoplasmic compartments, were analyzed individually. Difference spectra were calculated by subtracting the mean spectrum of untreated cells from the mean spectrum of treated cells for both compartments (nucleus and cytoplasm) and a Student t-test was performed to reveal any significant spectral variation due to the treatments.
Discussion
Untreated MCF-7 cells: nucleus versus cytoplasm
Spectra of the nucleus and cytoplasm show clear differences and several bands were identified as distinguishing features, which are marked (see Fig. 2). As expected, bands associated with DNA vibrations (784, 1337 and 1370 cm−1)34,35 and proteins modes (amide I and amide III bands located near 1675 and 1254 cm−1, respectively) correspond to positive loadings showing that the nuclei contain more of these constituents than the cytoplasm. The three bands at 743, 1127 and 1585 cm−1 have been assigned to the vibration of heme groups28 and associated with mitochondrial cytochrome c in the literature.29–33 These bands are enhanced due to the use of a 532 nm laser, which is in resonance with the electronic transition assigned to the Qv band. These observations are also in agreement with the PCA performed on the extracted mean spectra from each Raman image for both the nucleus and cytoplasm. The PC1 loadings reported in Fig. 3B, show major differences between the nucleus and cytoplasm.Polyphenol-treated MCF-7 cells: nucleus versus cytoplasm
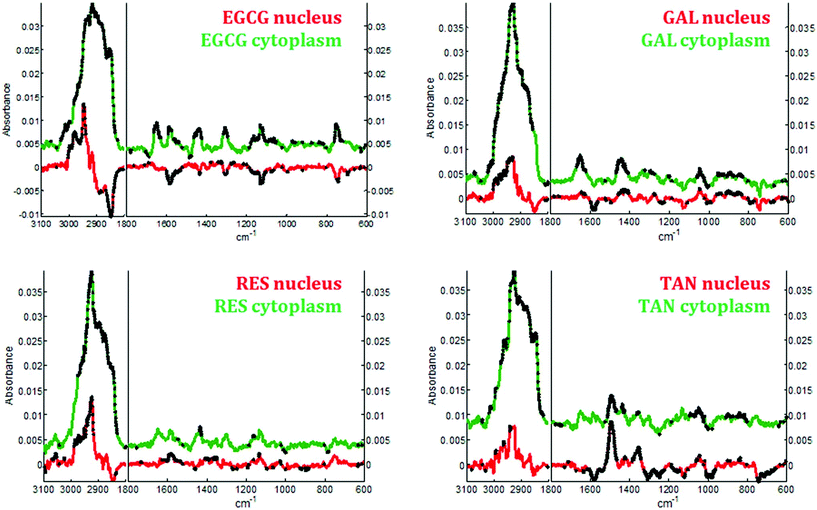
In the cytoplasm, differences in the lipid bands were observed. Significant positive loadings were observed at 2851 and 2920 cm−1 after cell exposure to EGCG, tannic acid and resveratrol. These bands are mainly assigned to C–H vibrations of lipids. Significant differences could also be observed in the 1460–1420 cm−1 and 1660–1650 cm−1 spectral regions of cell spectra after gallic acid and EGCG treatments. According to literature,10,28 these bands are tentatively assigned to saturated and unsaturated lipids, respectively (see Fig. 5B). These variations would reflect an increase in saturated and unsaturated lipid content within cell cytoplasm due to the polyphenol treatments.Similar positive variations near 1360 and 1490 cm−1 were observed in the spectra of the nucleus and cytoplasm after tannic acid treatment but no metabolic modifications could be assigned to these spectral variations and neither could they be related to the molecule itself (data not shown). Finally by comparing the difference spectra specific to the cytoplasm and the nucleus for each polyphenol, a majority of the significant spectral variations assigned to lipids are occurring in the cytoplasm (see Fig. 7). Interestingly, EGCG induces opposite spectral variations in the cytoplasm and in the nucleus. This might be the reason why the spectral signature associated with EGCG treatment of entire MCF-7 cells (see Fig. 4) does not present significant spectral variations while EGCG is efficient at slowing down cell growth. On the other hand, gallic acid and tannic acid show similar spectral signatures for both the nucleus and cytoplasm.
Cytochrome c can be found in either an oxidized or reduced state inside the cells. There is evidence that only oxidized cytochrome c can activate the caspases and trigger apoptosis43 but this has not been confirmed yet in living cells. It has also been shown that exogenous cytochrome c becomes reduced within 5 minutes when added to cytosolic cell extracts.44 Ripple and her team demonstrated that endogenous cyt c was not maintained in the oxidized form by cytochrome oxidase (CytOx) upon release into the cytosol and in fact became highly reduced.39 Using a 532 nm excitation laser to acquire Raman spectral images of live MCF-7 cells, it has been shown that the Raman scattering of oxidized cyt c will be a lot weaker compared to the reduced form allowing only an effective monitoring of reduced cyt c present in the cytoplasm.31,33
MCF-7 cancer cells have higher level of fatty acid synthase whose main function is to catalyze the synthesis of palmitic acid, a long-chain saturated fatty acid. Zeng showed that MCF-7 cancers cells are able to increase the basal levels of p21 and Bax, pro-apoptotic actors, in the presence of palmitic acid or myristic acid, two common long-chain saturated fatty acids.50 Moreover it has been demonstrated that increased fatty acids content is responsible for fatty acid-induced lipotoxicity and significantly induced apoptosis in hepatocellular carcinoma.48 A few publications have reported that unsaturated fatty acids are key players in the protection of cells against saturated fatty acids lipotoxicity.48,49,51
A relationship has been previously put forward by Hardy and his team correlating the increase in saturated fatty acids inside the cells and the release of cyt c into the cytosol. They correlated the increase in saturated fatty acids inside MDA-MB-231 breast cancer cells with decreased mitochondrial membrane potential triggering cytochrome c release into the cytosol.52
Conclusion
By applying Raman spectroscopy, we were able to monitor the global biological composition of live individual cells before and after exposure to polyphenols following 24 hours of incubation. Significant positive spectral variations due to polyphenols inside cell cytoplasm reflect an increase of the lipid content. Indeed, as reported elsewhere,53,54 lipid accumulation is an early biomarkers of drug-induced cell stress and subsequent apoptosis.Interestingly EGCG appears to induce opposite biochemical changes as reported by the Raman spectra of the cytoplasm and of the nucleus (see Fig. 7) that are not evidenced in the spectral signature obtained from entire cells. Furthermore an increase in cytochrome c concentration into the cytosol could also be induced by this polyphenol as evidenced by a significant increase of four specific bands assigned to the vibration of heme groups found in cytochrome c. This increase is a biological event that might be associated with cell apoptosis.
Raman imaging offers high sensitivity and specificity to molecular and structural changes. When compared with FTIR imaging, Raman imaging also offers higher spatial resolution images of living cells, approaching 1 micron. This high resolution makes Raman micro-spectroscopy a powerful tool to study single cells and even providing useful information at a subcellular level in response polyphenols. Raman imaging also offers the unique possibility to work with live cells in an aqueous environment, which is very difficult to obtain by FTIR imaging.55,56 We have shown that Raman microscopy is an ideal method to evaluate the effects of drugs on subcellular features in cancer cells.
Abbreviations
| ATP | Adenosine TriPhosphate |
| Apaf-1 | Apoptotic protease-activating factor-1 |
| CaF2 | Calcium fluoride |
| Cyt c | Cytochrome c |
| CytOx | Cytochrome oxidase |
| DNA | Deoxyribonucleic acid |
| EGCG | EpiGalloCatechin-3-Gallate |
| FTIR | Fourier transform infrared |
| GAL | Gallic acid |
| IC50 | Half maximal inhibitory concentration |
| PBS | Phosphate buffer saline |
| PCA | Principal component analysis |
| PC | Principal component |
| RES | Resveratrol |
| RMS | Raman MicroSpectroscopy |
| RNA | Ribonucleic acid |
| ROS | Reactive oxygen species |
| S/N | Signal to noise |
| TAG | Triacylglycerides |
| TAN | Tannic acid |
Conflicts of interest
There are no conflicts to declare.Acknowledgements
This research was supported by grants from the National Fund for Scientific Research (FRFC 2.4533.10 and 2.4527.10, 2.4526.12, and T.0155.13). E. G. is the Director of Research with the National Fund for Scientific Research (FNRS) (Belgium), and A. M. is a Research Fellow supported by the Fund for Research and Education within Industry and Agriculture (FRIA) from the FNRS (Belgium). The collaboration with the Center of Biospectroscopy of the Monash University (Melbourne, Australia) was supported by grants from the National Fund for Scientific Research (Scientific short stay abroad) and grants of international mobility from the International Relations and Cooperation Office of the Université Libre de Bruxelles (Brussels, Belgium).B. R. W. is supported by an Australian Research Council (ARC) Future Fellowship grant FT120100926. We acknowledge Mr Finlay Shanks for instrumental support.
Notes and references
- A. Y. Issa, S. R. Volate and M. J. Wargovich, The role of phytochemicals in inhibition of cancer and inflammation: New directions and perspectives, J. Food Compos. Anal., 2006, 19, 405–419 CrossRef CAS
.
- N. Dhillon,
et al., Phase II trial of curcumin in patients with advanced pancreatic cancer, Clin. Cancer Res., 2008, 14, 4491–4499 CrossRef CAS PubMed
.
- A. Shehzad, F. Wahid and Y. S. Lee, Curcumin in cancer chemoprevention: molecular targets, pharmacokinetics, bioavailability, and clinical trials, Arch. Pharm., 2010, 343, 489–499 CrossRef CAS PubMed
.
-
T. Weeks and T. Huser, in Biomedical Applications of Biophysics 237, Springer Science & Business Media, 2010 Search PubMed
.
- H. J. Butler,
et al., Using Raman spectroscopy to characterize biological materials, Nat. Protoc., 2016, 11, 664–687 CrossRef CAS PubMed
.
- Z. Movasaghi, S. Rehman and I. U. Rehman, Raman Spectroscopy of Biological Tissues, Appl. Spectrosc. Rev., 2007, 42, 493–541 CrossRef CAS
.
- A. F. Palonpon, M. Sodeoka and K. Fujita, Molecular imaging of live cells by Raman microscopy, Curr. Opin. Chem. Biol., 2013, 17, 708–715 CrossRef CAS PubMed
.
- G. J. Puppels,
et al., Studying single living cells and chromosomes by confocal Raman microspectroscopy, Nature, 1990, 347, 301–303 CrossRef CAS PubMed
.
- C. Matthäus,
et al., Infrared and Raman Microscopy in Cell Biology, Methods Cell Biol., 2008, 275–308, DOI:10.1016/S0091-679X(08)00610-9.Infrared
.
- M. C. Potcoava, G. L. Futia, J. Aughenbaugh, I. R. Schlaepfer and E. A. Gibson, Raman and coherent anti-Stokes Raman scattering microscopy studies of changes in lipid content and composition in hormone-treated breast and prostate cancer cells, J. Biomed. Opt., 2014, 19, 111605 CrossRef PubMed
.
- K. Galler, K. Bräutigam, C. Große, J. Popp and U. Neugebauer, Making a big thing of a small cell–recent advances in single cell analysis, Analyst, 2014, 139, 1237–1273 RSC
.
- W. Wang, J. Zhao, M. Short and H. Zeng, Real-time in vivo cancer diagnosis using raman spectroscopy, J. Biophotonics, 2015, 8, 527–545 CrossRef PubMed
.
- K. Kong, C. Kendall, N. Stone and I. Notingher, Raman spectroscopy for medical diagnostics—From in-vitro biofluid assays to in-vivo cancer detection, Adv. Drug Delivery Rev., 2015, 89, 121–134 CrossRef CAS PubMed
.
- E. Ryzhikova,
et al., Raman spectroscopy of blood serum for Alzheimer's disease diagnostics: specificity relative to other types of dementia, J. Biophotonics, 2015, 8, 584–596 CrossRef PubMed
.
- B. R. Wood,
et al., Resonance Raman spectroscopy reveals new insight into the electronic structure of beta-hematin and malaria pigment, J. Am. Chem. Soc., 2004, 126, 9233–9239 CrossRef CAS PubMed
.
- B. R. Wood and D. McNaughton, Resonance Raman spectroscopy in malaria research, Expert Rev. Proteomics, 2006, 3, 525–544 CrossRef CAS PubMed
.
- B. R. Wood,
et al., Tip-enhanced Raman scattering (TERS) from hemozoin crystals within a sectioned erythrocyte, Nano Lett., 2011, 11, 1868–1873 CrossRef CAS PubMed
.
- A. Taleb,
et al., Raman microscopy for the chemometric analysis of tumor cells, J. Phys. Chem. B, 2006, 110, 19625–19631 CrossRef CAS PubMed
.
- J. Surmacki,
et al., Raman imaging at biological interfaces: applications in breast cancer diagnosis, Mol. Cancer, 2013, 12, 48 CrossRef PubMed
.
- K. Guze,
et al., Pilot study: Raman spectroscopy in differentiating premalignant and malignant oral lesions from normal mucosa and benign lesions in humans, Head Neck, 2015, 37, 511–517 CrossRef PubMed
.
- M. Ishigaki,
et al., Diagnosis of early-stage esophageal cancer by Raman spectroscopy and chemometric techniques, Analyst, 2016, 141, 1027–1033 RSC
.
- H.-H. Lin,
et al., Single nuclei Raman spectroscopy for drug evaluation, Anal. Chem., 2012, 84, 113–120 CrossRef CAS PubMed
.
- S. Ramos, Effects of dietary flavonoids on apoptotic pathways related to cancer chemoprevention, J. Nutr. Biochem., 2007, 18, 427–442 CrossRef CAS PubMed
.
- D. Vauzour, A. Rodriguez-Mateos, G. Corona, M. J. Oruna-Concha and J. P. E. Spencer, Polyphenols and human health: prevention of disease and mechanisms of action, Nutrients, 2010, 2, 1106–1131 CrossRef CAS PubMed
.
- F. Draux,
et al., Raman spectral imaging of single cancer cells: probing the impact of sample fixation methods, Anal. Bioanal. Chem., 2010, 397, 2727–2737 CrossRef CAS PubMed
.
- R. D. Petty, L. A. Sutherland, E. M. Hunter and I. A. Cree, Comparison of MTT and ATP-based assays for the measurement of viable cell number, J. Biolumin. Chemilumin., 1995, 10, 29–34 CrossRef CAS PubMed
.
- K. Majzner,
et al., Raman Imaging Providing Insights into Chemical Composition of Lipid Droplets of Different Size and Origin: In Hepatocytes and Endothelium, Anal. Chem., 2014, 86, 6666–6674 CrossRef CAS PubMed
.
- K. Kochan,
et al., Raman spectroscopy analysis of lipid droplets content, distribution and saturation level in Non-Alcoholic Fatty Liver Disease in mice, J. Biophotonics, 2015, 8, 597–609 CrossRef CAS PubMed
.
- F. Adar and M. Erecinska, Spectral evidence for interactions between membrane-bound hemes: Resonance Raman spectra of mitochondrial cytochrome b–c1 complex as a function of redox potential, FEBS Lett., 1977, 80, 195–200 CrossRef CAS PubMed
.
- M. Okada,
et al., Label-free Raman observation of cytochrome c dynamics during apoptosis, Proc. Natl. Acad. Sci. U. S. A., 2012, 109, 28–32 CrossRef CAS PubMed
.
- N. A. Brazhe,
et al., Mapping of Redox State of Mitochondrial Cytochromes in Live Cardiomyocytes Using Raman Microspectroscopy, PLoS One, 2012, 7, e41990 CAS
.
- N. A. Brazhe, M. Treiman, B. Faricelli, J. H. Vestergaard and O. Sosnovtseva, In situ Raman study of redox state changes of mitochondrial cytochromes in a perfused rat heart, PLoS One, 2013, 8, e70488 CAS
.
- N. A. Brazhe,
et al., Probing cytochrome c in living mitochondria with surface-enhanced Raman spectroscopy, Sci. Rep., 2015, 5, 13793 CrossRef PubMed
.
- J. W. Chan,
et al., Micro-Raman spectroscopy detects individual neoplastic and normal hematopoietic cells, Biophys. J., 2006, 90, 648–656 CrossRef CAS PubMed
.
- S. Managò,
et al., A reliable Raman-spectroscopy-based approach for diagnosis, classification and follow-up of B-cell acute lymphoblastic leukemia, Sci. Rep., 2016, 6, 24821 CrossRef PubMed
.
- K. Hamada,
et al., Raman microscopy for dynamic molecular imaging of living cells, J. Biomed. Opt., 2008, 13, 44027 Search PubMed
.
- A. Renz,
et al., Rapid extracellular release of cytochrome c is specific for apoptosis and marks cell death in vivo, Blood, 2001, 98, 1542–1548 CrossRef CAS PubMed
.
- J. A. Sánchez-Alcázar, A. Khodjakov and E. Schneider, Anticancer drugs induce increased mitochondrial cytochrome c expression that precedes cell death, Cancer Res., 2001, 61, 1038–1044 Search PubMed
.
- M. O. Ripple, M. Abajian and R. Springett, Cytochrome c is rapidly reduced in the cytosol after mitochondrial outer membrane permeabilization, Apoptosis, 2010, 15, 563–573 CrossRef CAS PubMed
.
- B. N. Singh, S. Shankar and R. K. Srivastava, Green tea catechin, epigallocatechin-3-gallate (EGCG): mechanisms, perspectives and clinical applications, Biochem. Pharmacol., 2011, 82, 1807–1821 CrossRef CAS PubMed
.
- S. Qanungo, M. Das, S. Haldar and A. Basu, Epigallocatechin-3-gallate induces mitochondrial membrane depolarization and caspase-dependent apoptosis in pancreatic cancer cells, Carcinogenesis, 2005, 26, 958–967 CrossRef CAS PubMed
.
- A. M. Roy, M. S. Baliga and S. K. Katiyar, Epigallocatechin-3-gallate induces apoptosis in estrogen receptor-negative human breast carcinoma cells via modulation in protein expression of p53 and Bax and caspase-3 activation, Mol. Cancer Ther., 2005, 4, 81–90 CAS
.
- G. C. Brown and V. Borutaite, Regulation of apoptosis by the redox state of cytochrome c, Biochim. Biophys. Acta, Bioenerg., 2008, 1777, 877–881 CrossRef CAS PubMed
.
- M. B. Hampton, B. Zhivotovsky, A. F. Slater, D. H. Burgess and S. Orrenius, Importance of the redox state of cytochrome c during caspase activation in cytosolic extracts, Biochem. J., 1998, 95–99 CrossRef CAS
.
- J. Boren and K. M. Brindle, Apoptosis-induced mitochondrial dysfunction causes cytoplasmic lipid droplet formation, Cell Death Differ., 2012, 19, 1561–1570 CrossRef CAS PubMed
.
- C. Steuwe,
et al., CARS based label-free assay for assessment of drugs by monitoring lipid droplets in tumour cells, J. Biophotonics, 2014, 7, 906–913 CrossRef CAS PubMed
.
- Y. Guo, K. R. Cordes, R. V. Farese, T. C. Walther and T. C. Walther, Lipid droplets at a glance, J. Cell Sci., 2009, 122, 749–752 CrossRef CAS PubMed
.
- S. Mei,
et al., Differential roles of unsaturated and saturated fatty acids on autophagy and apoptosis in hepatocytes, J. Pharmacol. Exp. Ther., 2011, 339, 487–498 CrossRef CAS PubMed
.
- W. Gehrmann,
et al., Antagonism Between Saturated and Unsaturated Fatty Acids in ROS Mediated Lipotoxicity in Rat Insulin-Producing Cells, Cell. Physiol. Biochem., 2015, 36, 852–865 CrossRef CAS PubMed
.
- L. Zeng,
et al., Saturated Fatty Acids Modulate Cell Response to DNA Damage: Implication for Their Role in Tumorigenesis, PLoS One, 2008, 3, e2329 Search PubMed
.
- T. Plötz, M. Hartmann, S. Lenzen and M. Elsner, The role of lipid droplet formation in the protection of unsaturated fatty acids against palmitic acid induced lipotoxicity to rat insulin-producing cells, Nutr. Metab., 2016, 13, 16 Search PubMed
.
- S. Hardy,
et al., Saturated fatty acid-induced apoptosis in MDA-MB-231 breast cancer cells. A role for cardiolipin, J. Biol. Chem., 2003, 278, 31861–31870 CrossRef CAS PubMed
.
- C. Steuwe,
et al., CARS based label-free assay for assessment of drugs by monitoring lipid droplets in tumour cells, J. Biophotonics, 2014, 7, 906–913 CrossRef CAS PubMed
.
- K. Czamara,
et al., Unsaturated lipid bodies as a hallmark of inflammation studied by Raman 2D and 3D microscopy, Sci. Rep., 2017, 7, 40889 CrossRef CAS PubMed
.
- S. G. Kazarian and K. L. A. Chan, ATR-FTIR spectroscopic imaging: recent advances and applications to biological systems, Analyst, 2013, 138, 1940–1951 RSC
.
- E. C. Mattson, E. Aboualizadeh, M. E. Barabas, C. L. Stucky and C. J. Hirschmugl, Opportunities for live cell FT-infrared imaging: macromolecule identification with 2D and 3D localization, Int. J. Mol. Sci., 2013, 14, 22753–22781 CrossRef PubMed
.
| This journal is © The Royal Society of Chemistry 2018 |

