Highly sensitive and specific electrochemical biosensor for microRNA-21 detection by coupling catalytic hairpin assembly with rolling circle amplification†
Qing
Li‡
,
Fanpeng
Zeng‡
,
Nan
Lyu
 * and
Jun
Liang
*
Xuzhou Central Hospital, Xuzhou, Jiangsu 221004, China. E-mail: lyunan8833@sina.com; mwlj521@163.com
First published on 9th April 2018
Abstract
Background: MicroRNA plays a significant role in gene regulation and is usually regarded as an important biological marker. Electrochemical biosensors are excellent tools for microRNA detection. Methods: In this experiment, we take miRNA-21 as a target, combining catalytic hairpin assembly (CHA) and rolling circle amplification (RCA) as a dual signal amplification strategy for the detection of microRNA in an electrochemical biosensor. Results: This strategy has a good linear range of 0.5–12![[thin space (1/6-em)]](https://www.rsc.org/images/entities/char_2009.gif) 500 pmol of microRNA. The limit of detection (LOD) for miRNA is as low as 290 fmol, showing excellent performance. Finally, this method has been successfully applied to the detection of miRNA-21 from HeLa cells. Conclusion: This method can be applied not only for microRNA detection with high sensitivity and speed, but can also detect small molecules and proteins combined with aptamers.
500 pmol of microRNA. The limit of detection (LOD) for miRNA is as low as 290 fmol, showing excellent performance. Finally, this method has been successfully applied to the detection of miRNA-21 from HeLa cells. Conclusion: This method can be applied not only for microRNA detection with high sensitivity and speed, but can also detect small molecules and proteins combined with aptamers.
1. Introduction
MicroRNAs (miRNAs) are a type of small non-coding RNA molecule with fewer than 22 nucleotides.1–4 They are endogenous and conserved, and modulate gene expression by binding to target mRNAs, leading to translation blockades or target transcript degradation.5 Until now, over 2000 kinds of human miRNA have been found to regulate 30% of human genes.6 In particular, miRNA regulation is the dominant cause of deadenylation, which reduces the stability of mRNA, thereby affecting the translation efficiency and downstream protein products. This regulatory mechanism enables miRNA to be an important potential biomarker in mediating tumor metastasis, stem cell differentiation, and viral replication.7–9 Over the past few decades, miRNA has been reported in abnormal expression in various cancers, including gastric cancer, lung cancer, and breast cancer, etc., and other diseases such as cardiovascular diseases, degenerative diseases, and endocrine diseases, etc.10–12 Thus, it is necessary to develop a sensitive strategy to analyze miRNA expression for clinical diagnosis.At present, the detection of miRNAs is quite challenging due to their small size, vulnerability to degradation, highly homologous sequences, and relatively low expression levels in cells. Traditional techniques, such as northern blotting, real-time PCR, and microarrays, suffer from some disadvantages in practical applications.13–15 They require extremely precise instruments and have a relatively low sensitivity with time-consuming operation. To avoid these limitations, electrochemical biosensor techniques have become very powerful and attracted much attention.16,17 They have high sensitivity and selectivity, which is suitable for the detection of trace biomolecules. In addition, several other groups have also developed a variety of amplification strategies to continually improve the sensitivity of biosensors, such as rolling circle amplification (RCA), catalytic hairpin assembly (CHA), hybridization chain reaction (HCR), loop-mediated isothermal amplification (LAMP), etc.18–21 Among these strategies, CHA is the most popular amplification technique with a simple isothermal DNA amplification process.22 Moreover, it is an enzyme-free amplification method which overcomes the complex operation, specific reaction conditions, and the reaction time being dependent on enzyme activity.23–25 However, the nonspecific CHA products usually cause a large background signal, which severely limits the amplification efficiency. Therefore, other techniques can be used in combination to provide the amplification. RCA is a simple and rapid DNA reproduction method performed under normal laboratory conditions. In RCA amplification, thousands of detection sites can be generated from each template to achieve a large number of ssDNA molecules. Thus, it can be combined with CHA to increase the expansion efficiency by dual amplification.26,27
In this work, we have developed a novel dual amplification strategy for the analysis of microRNA-21.28–32 This amplification is based on the combination of CHA and RCA techniques to achieve high sensitivity, selectivity, and simple operation. The hairpin H1 is partially hybridized with miR-21 in CHA, so it can be opened to start the CHA reaction when miR-21 is present, and RCA can be used continually to amplify the response signal. This strategy has a good linear range of 0.5–12![[thin space (1/6-em)]](https://www.rsc.org/images/entities/char_2009.gif) 500 pmol of miR-21 with a low detection limit of 290 fmol. This method can be applied not only for microRNA detection with high sensitivity and speed, but can also detect small molecules and proteins combined with aptamers.
500 pmol of miR-21 with a low detection limit of 290 fmol. This method can be applied not only for microRNA detection with high sensitivity and speed, but can also detect small molecules and proteins combined with aptamers.
2. Experiments
2.1 Reagents
DNA oligonucleotides were designed and synthesized by Sangon Inc. (Shanghai, China) and TaKaRa Bio Inc. (Dalian, China). The detailed sequences are listed in Table 1. Bovine serum albumin (BSA), streptavidin-alkaline phosphatase (ST-ALP), α-naphthyl phosphate (α-NP), 6-mercapto-1-hexanol (MCH) and salmon sperm DNA were purchased from Sigma-Aldrich (USA). dNTP and agarose were purchased from Takara (Dalian, China). All other reagents were of analytical reagent grade. All of the consumable items were treated with 1% DEPC and sterilized three times. Piranha solution was used which contained 98% concentrated sulfuric acid and 30% hydrogen peroxide (75/25, v/v). The TNaK buffer was the hybridization buffer (pH 7.5), containing 20 mM Tris, 140 mM NaCl and 5.0 mM KCl. The Tris-HCl buffer was the washing buffer (pH 7.4), containing 20 mM Tris, 0.10 M NaCl, 5.0 mM MgCl2 and 0.05% Tween-20. Diethanolamine (DEA) buffer (pH 9.6) containing 0.1 M DEA, 1 M MgCl2 and 100 mM KCl. Millipore-Q water (≧18 MΩ cm−1) was used in all experiments.| Oligonucleotide | Sequence (5′–3′) |
|---|---|
| Capture probe | SH-(CH2)6-TTTTGAGTAGAGTCTGA |
| MicroRNA-21 | UAGCUUAUCAGACUGAUGUUGA |
| Hairpin probe 1 (H1) | Biotin-TTTTCAACATCAGTCTGATAAGCTACCATGTGTAGAT |
| AGCTTATCAGACTCTACTCA | |
| Hairpin probe 2 (H2) | TAAGCTATCTACACATGGTAGCTTATCAGACTCCATGTGTAGA |
| Primer-RCA | AAAAAAAAACACAGCTGAGGATAGGACAT |
| Circle template | P-CTCAGCTGTGTAACAACATGAAGATTGTAGGTCAGAACTC |
| ACCTGTTAGAAACTGTGAAGATCGCTTATTATGTCCTATC | |
| Detection probe | TCAGAACTCACCTGTTAGTTTTTT-biotin |
| Single-base-mismatched oligonucleotide | UAGCUUAUCAUACUGAUGUUGA |
| Two-base-mismatched oligonucleotide | UAGCUUAUCAUACUGACGUUGA |
| Non-complementary oligonucleotide | GCUAUCCGUCAGUGUAUAGCGC |
2.2 Apparatus
All electrochemical experiments were performed using the CHI660D electrochemical workstation (Shanghai Chenhua Instruments Co., Ltd, China) with a conventional three electrode system composed of platinum wire as the auxiliary, a Ag/AgCl electrode as the reference, a platinum electrode as the counter electrode and a 3 mm diameter gold electrode as the working electrode. A desktop low-temperature high-speed centrifuge (Heraeus, Germany), a HH-W420 electric-heated thermostatic water bath (Hengfeng, China), and KQ3200DB ultrasound equipment (Kunshan, China) were also used for the experiment.2.3 Preparation of the electrochemical biosensor
The bare gold electrode was polished by 50 nm alumina slurries and treated in ultrapure water using ultrasound for a few minutes, followed by filtration in a piranha solution for 10 min to eliminate other substances. The preprocessed gold electrode was rinsed with ultrapure water and allowed to dry at room temperature. 10 μL of the thiolated capture probe (0.2 μM) was dropped onto the pretreated gold electrode surface and incubated overnight at 4 °C. After washing with the Tris-HCl buffer, the electrode was blocked with 100 μL of 1 mM MCH for 1 h at 37 °C to achieve a well-aligned DNA monolayer which can occupy the remaining bare sites. The electrode was further rinsed with the washing buffer and treated with salmon sperm DNA and 1% BSA for 30 min to block the non-specific binding sites on its surface to avoid the nonspecific adsorption of other DNA or enzymes.The CHA system included miR-21, biotin-labeled hairpin probes (H1 and H2), the TNaK buffer, an RNAase inhibitor, and DEPC-treated water. The final concentration of the RNAase inhibitor was 1 U μL−1. After a 0.5 h amplification reaction, the products hybridized with the capture probes were immobilized on the gold electrode for 0.5 h at 37 °C. Then 10 μL of 1 nM streptavidin (SA) dissolved in PB buffer was added onto the gold electrode and reacted for 0.5 h at 37 °C, aiming to combine it with the biotin at the end of the CHA process. Finally, the gold electrode was washed with the washing solution.
Then the RCA was carried out. In the RCA experiment, 10 mM cyclic DNA template and 10 nM DNA primer labeled with biotin were dissolved in PB buffer to make the mixed system. Then 10 μL of this mixed system was added to the biosensor and reacted for 0.5 h at 37 °C. Therefore, the cyclic DNA template and DNA primer were combined to give the CHA product from the biotin and streptomycin affinity reactions. After the biosensor was thoroughly washed with the washing buffer, 10 μL RCA reaction buffer (33 mM, pH 7.9 Tris-HCl buffer) coupled with 0.4 U phi29 DNA polymerase were dropped onto the biosensor surface and incubated for 1 h at 37 °C. After the amplification, 10 μL 1 μM biotin-labeled probe was dropped onto the biosensor to react for 1 h at 37 °C, which made the probe combine with the RCA product.
Following washing with the DEA buffer containing 0.05% Tween-20, 10 μL of 0.5 μg mL−1 streptavidin-labeled ST-AP was dropped onto the electrochemical biosensor at 37 °C for 0.5 h, and washed thoroughly with the DEA buffer containing 0.05% Tween-20. The differential pulse voltammetry (DPV) measurement was performed in the DEA buffer containing 1 mg mL−1 of the α-NP substrate with an initial potential of 0, a terminal potential of 0.6 V, a potential increment of 0.005 V, an amplitude of 0.07 V, a pulse width of 0.06 s, a sample width of 0.016 s, and a standing time of 2 s.
3. Results and discussion
3.1 Design of the electrochemical biosensor
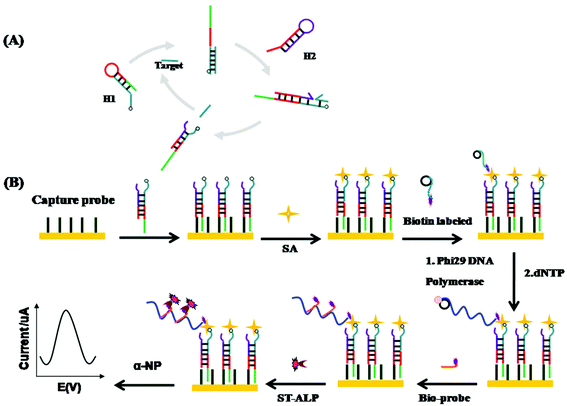
The strategy of the fabricated electrochemical biosensor platform for the detection of miRNA-21 is shown in Fig. 1. In this method, miRNA-21 has been amplified and detected through dual-amplification, involving CHA and RCA. MicroRNA-21 first experienced the CHA amplification. Before amplification, H1 was labeled with biotin. Then the biotin-labeled H1–H2 hybrid duplex was formed in the presence of miRNA-21. In addition, this biotin-labeled hybrid duplex was captured by probes on the gold electrode. The primer of RCA was also labeled with biotin and subsequently combined with the CHA product using streptavidin. Later on, dNTP and Phi29 DNA polymerase were added to start the rolling circle amplification. After amplification, the generated linear repeating sequences which are complementary to the template were associated with the biotin-labeled detection probes. Finally, these RCA products were linked to the streptavidin-labeled ST-AP to catalyze the α-NP and produce the electrochemical signals.3.2 Characterization of the electrode surface modification
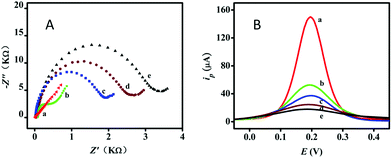
Electrochemical impedance spectroscopy (EIS) and square wave voltammetry (SWV) measurements were used to evaluate the modification of the electrochemical biosensor in each step. The experiments to obtain the EIS curves were performed in 0.4 M KCl containing 0.5 mM Fe(CN)63−/4− and the diameter of the semicircle was equal to the electron-transfer resistance (Ret) (Fig. 2A). In 0.4 M KCl containing 0.5 mM Fe(CN)63−/4−, the bare electrode gave an almost straight line (curve a) because of electron free transfer, which reflected the outstanding electrochemical conductivity. When the thiolated capture DNA was self-assembled onto the bare electrode through Au-thiol binding, the electron transfer was limited and the Ret increased (curve b). This was because the negatively charged phosphate backbone of the oligonucleotides produced an electrostatic repulsion force with [Fe(CN)6]3−/[Fe(CN)6]4−. However, after MCH and BSA were immobilized onto the electrode surface, the Ret obviously increased (curve c), on account of the biomacromolecules being able to obstruct the electron transfer. Afterwards, the remaining capture DNA hybridized with the H1–H2 complexes without the participation of the target miRNA, and the Ret slightly increased (curve d). With the participation of the target miRNA, the Ret increased significantly (curve e), which indicated that only a few H1 and H2 can initiate the reaction in the absence of the target, and in the presence of the target miRNA catalyst, a large number of H1–H2 complexes were obtained. These results were in good agreement with those obtained from SWV measurements (Fig. 2B), in which the peak currents varied upon the assembly and binding processes. The results from both EIS and SWV proved that the biosensor worked as described in Fig. 1.3.3 Optimization of experimental conditions
We have investigated different experiments to achieve the optimal sensing performance, considering the incubation time of CHA (Fig. 3A), the incubation time of RCA (Fig. 3B), the proportion of H1 and H2 (Fig. 3C) and the concentration of streptavidin. The signal-to-noise ratio has been used for the evaluation of the electrochemical biosensor performance. As can be seen in Fig. 3A, the signal-to-noise ratio went up with the increment of incubation time and reached the maximum at 30 min, demonstrating that the optimized reaction time of target miRNA during CHA amplification was 30 min. In addition, the proportion of H1 and H2 is another significant factor for the CHA amplification. As shown in Fig. 3B, the optimized proportion of H1 and H2 was 1![[thin space (1/6-em)]](https://www.rsc.org/images/entities/char_2009.gif) :
:![[thin space (1/6-em)]](https://www.rsc.org/images/entities/char_2009.gif) 1 (molar ratio), when the signal-to-noise ratio was 20. Besides CHA, the conditions for RCA have also been optimized. As shown in Fig. 3B, the signal-to-noise ratio increased outstandingly before 60 min, and reached a peak at 60 min. Therefore, the optimum incubation time of RCA was 60 min. Finally, the concentration of streptavidin was investigated and the signal-to-noise ratio reached the maximum when the concentration was 1 nM.
1 (molar ratio), when the signal-to-noise ratio was 20. Besides CHA, the conditions for RCA have also been optimized. As shown in Fig. 3B, the signal-to-noise ratio increased outstandingly before 60 min, and reached a peak at 60 min. Therefore, the optimum incubation time of RCA was 60 min. Finally, the concentration of streptavidin was investigated and the signal-to-noise ratio reached the maximum when the concentration was 1 nM.
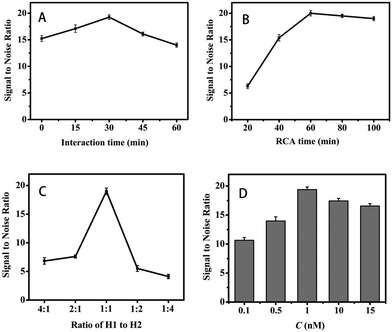 | ||
| Fig. 3 (A) Dependence of DPV peak currents on reaction time of CHA, (B) reaction time of RCA, (C) ratio of H1 to H2, and (D) streptavidin concentration. | ||
3.4 Analytical performance of miRNA detection
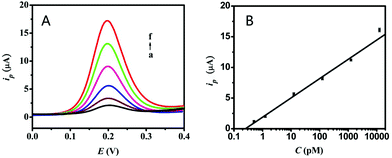
Under the optimum conditions of the experiment, the capability of the prepared electrochemical biosensor was explored using the measurement of DPV peak currents, such as the dynamic range and sensitivity. From Fig. 4A, the DPV peak current increased (from a to f) following the increase in the target miRNA-21 concentration. Additionally, it showed the excellent linearity between the peak currents and the logarithm of target miRNA-21 concentrations in the range of 0.5 pM to 12.5 nM. The limit of detection is 290 fM. The resulting linear equation was ip (μA) = 1.89 + 3.14![[thin space (1/6-em)]](https://www.rsc.org/images/entities/char_2009.gif) log
log![[thin space (1/6-em)]](https://www.rsc.org/images/entities/char_2009.gif) CmiRNA (the unit is pM) with a correlation coefficient of 0.9953. Compared to the traditional methods involving northern blotting, PT-PCR, and other reported electrochemical biosensors, the results above showed a wider linear range and higher sensitivity (shown in Table S1†). Moreover, two concentrations, 1.25 pM and 1.25 nM, have been used for the investigation of the repeatability. The results showed that both of them had good reproducibility with the coefficient of variation less than 5%.
CmiRNA (the unit is pM) with a correlation coefficient of 0.9953. Compared to the traditional methods involving northern blotting, PT-PCR, and other reported electrochemical biosensors, the results above showed a wider linear range and higher sensitivity (shown in Table S1†). Moreover, two concentrations, 1.25 pM and 1.25 nM, have been used for the investigation of the repeatability. The results showed that both of them had good reproducibility with the coefficient of variation less than 5%.
3.5 Specificity of the proposed sensor
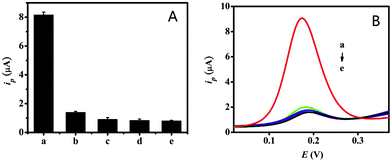
We evaluated the specificity of the proposed electrochemical biosensor by detecting a blank control and four different kinds of control oligonucleotide: a complete sequence complementary to the target miRNA-21, a single-base mismatched oligonucleotide, a double-base mismatched oligonucleotide, and a non-complementary oligonucleotide. The DPV currents and DPV signal curves of these oligonucleotides were measured with a concentration of 125 pM under the optimized detection conditions. As can be seen in Fig. 5, the signal responses of the single-base mismatched oligonucleotide, the double-base mismatched oligonucleotide, and the non-complementary oligonucleotide were all similar to that of the blank control, and these were less than 20% of the values for the full complementary sequence of target miRNA-21. Therefore, this electrochemical biosensor was a good probe for the effective detection of the target miRNA-21 with high specificity and has potential for practical analysis.3.6 Real sample analysis
After the characterization, our designed electrochemical biosensor was investigated for real sample analysis to demonstrate its capability. This miRNA assay was performed using human HeLa cell RNA. The RNA was extracted using the trizol method after cell counting. The sensitivity of our method was explored using a cell concentration from 102 to 107 cells. The sensitivity in the analysis of HeLa cell RNA reached a low concentration of 103 cells. The linearity was excellent with the R values greater than 0.99, which corresponded to the calibration curve of the standard miRNA-21 (Fig. 6). This result indicated that our designed electrochemical biosensor can serve as a promising tool for the detection of miRNA-21 in real bio-samples with great sensitivity, accuracy, and reliability.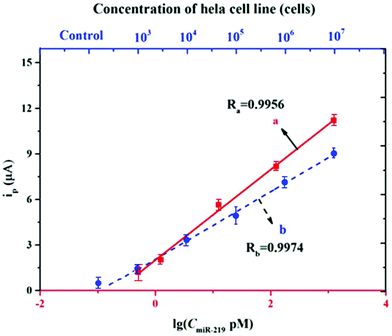 | ||
| Fig. 6 Application of the biosensor to the HeLa cell line and data analysis: curve a is for the concentration of miRNA and curve b is for the concentration of HeLa cells. | ||
4. Conclusions
In this work, we have designed a novel highly sensitive and specific method for the detection of microRNA-21, based on catalytic hairpin assembly coupled with rolling circle amplification. In this strategy, the CHA was combined with RCA using the biotin–streptavidin affinity reaction, which improved the sensitivity of the miRNA detection with a 290 fmol LOD and an excellent performance in real sample analysis with a good linear range of 0.5–12![[thin space (1/6-em)]](https://www.rsc.org/images/entities/char_2009.gif) 500 pmol. This method also indicated preferable specificity. Although there have been several related reports for the detection of miRNA, our strategy can achieve convenient high sensitivity just by combining the CHA and RCA methods.33–35 Therefore, this proposed electrochemical biosensor can detect miRNA in biomedical research and even early clinical diagnosis.
500 pmol. This method also indicated preferable specificity. Although there have been several related reports for the detection of miRNA, our strategy can achieve convenient high sensitivity just by combining the CHA and RCA methods.33–35 Therefore, this proposed electrochemical biosensor can detect miRNA in biomedical research and even early clinical diagnosis.
Conflicts of interest
The authors declare that they have no conflict of interest.Acknowledgements
We appreciate the support of the National Natural Science Foundation of China, No. 21505116. The work was also supported by the Scientific Research Funds of Talents from Xuzhou Medical University, No. D2015014.References
- K. Chaudhuri and R. Chatterjee, DNA Cell Biol., 2007, 26, 321–337 CrossRef CAS PubMed.
- C. Hilton and F. Karpe, Clin. Chem., 2013, 59, 729–731 CAS.
- H. Guo, N. T. Ingolia, J. S. Weissman and D. P. Bartel, Nature, 2010, 466, 835–840 CrossRef CAS PubMed.
- D. Baek, J. Villén, C. Shin, F. D. Camargo, S. P. Gygi and D. P. Bartel, Nature, 2008, 455, 64–71 CrossRef CAS PubMed.
- T. S. Elton, H. Selemon, S. M. Elton and N. L. Parinandi, Gene, 2013, 532, 1–12 CrossRef CAS PubMed.
- K. A. Cissell, S. Shrestha and S. K. Deo, Anal. Chem., 2007, 79, 4754–4761 CrossRef CAS.
- M. Planell-Saguer, M. C. Rodicio and Z. Mourelatos, Nat. Protoc., 2010, 5, 1061–1073 CrossRef PubMed.
- J. Koshiol, E. Wang, Y. Zhao, F. Marincola and M. T. Landi, Cancer Epidemiol., Biomarkers Prev., 2010, 19, 907–911 CrossRef CAS PubMed.
- I. Lee, S. S. Ajay, H. Chen, A. Maruyama, N. Wang, M. G. McInnis and B. D. Athey, Nucleic Acids Res., 2008, 36, e27 CrossRef PubMed.
- Z. Qiu, J. Shu and D. Tang, Anal. Chem., 2018, 90, 1021–1028 CrossRef CAS PubMed.
- J. Shu, Z. Qiu, S. lv, K. Zhang and D. Tang, Anal. Chem., 2018, 90, 2425–2429 CrossRef CAS PubMed.
- K. Zhang, S. Lv, Z. Lin, M. Li and D. Tang, Biosens. Bioelectron., 2018, 101, 159–166 CrossRef CAS PubMed.
- Q. Zhou, Y. Lin, K. Zhang, M. Li and D. Tang, Biosens. Bioelectron., 2018, 101, 146–152 CrossRef CAS PubMed.
- P. Mestdagh, T. Feys, N. Bernard, S. Guenther, C. Chen, F. Speleman and J. Vandesompele, Nucleic Acids Res., 2008, 36, e143 CrossRef PubMed.
- L. Yan, J. Zhou, Y. Zheng, A. S. Gamson, B. T. Roembke, S. Nakayama and H. O. Sintim, Mol. BioSyst., 2014, 10, 970–1003 RSC.
- R. A. McDonald, K. M. White, J. Wu, B. C. Cooley, K. E. Robertson, C. A. Halliday, J. D. McClure, S. Francis, R. Lu, S. Kennedy, S. J. George, S. Wan, E. van Rooij and A. H. Baker, Eur. Heart J., 2013, 22, 1636–1643 CrossRef PubMed.
- J. A. Chan, A. M. Krichevsky and K. S. Kosik, Cancer Res., 2005, 65, 6029–6033 CrossRef CAS PubMed.
- F. Meng, R. Henson, H. Wehbe-Janek, K. Ghoshal, S. T. Jacob and T. Patel, Gastroenterology, 2007, 133, 647–658 CrossRef CAS PubMed.
- F. Y. Zhou, Y. Yao, J. J. Luo, X. Zhang, Y. Zhang, D. Y. Yin, F. L. Gao and P. Wang, Anal. Chim. Acta, 2017, 969, 8–17 CrossRef CAS PubMed.
- F. L. Gao, Y. Qian, L. Zhang, S. Z. Dai, Y. F. Lan, Y. Zhang, L. Du and D. Q. Tang, Biosens. Bioelectron., 2015, 71, 158–163 CrossRef CAS PubMed.
- Y. Qian, C. Wang and F. L. Gao, Biosens. Bioelectron., 2015, 63, 425–431 CrossRef CAS PubMed.
- Y. Yu, C. Yu, T. Yin, S. Ou, X. Sun, X. Wen, L. Zhang, D. Q. Tang and X. X. Yin, Biosens. Bioelectron., 2017, 87, 278–284 CrossRef CAS PubMed.
- D. X. Nie, Z. Han, Y. Y. Yu and G. Y. Shi, Sens. Actuators, B, 2016, 224, 584–591 CrossRef CAS.
- T. Hou, W. Li, X. Liu and F. Li, Anal. Chem., 2015, 22, 11368–11374 CrossRef PubMed.
- X. Liu, W. Li, T. Hou, S. Dong, G. Yu and F. Li, Anal. Chem., 2015, 87, 4030–4036 CrossRef CAS PubMed.
- Y. Tan, X. Wei, Y. Zhang, P. Wang, B. Qiu, L. Guo, Z. Lin and H. Yang, Anal. Chem., 2015, 23, 11826–11831 CrossRef PubMed.
- W. Li, X. Liu, T. Hou, H. Li and F. Li, Biosens. Bioelectron., 2015, 71, 304–309 CrossRef PubMed.
- F. Xuan, X. Luo and I. Hsing, Biosens. Bioelectron., 2012, 1, 230–234 CrossRef PubMed.
- G. Wang, X. He, L. Chen, Y. Zhu, X. Zhang and L. Wang, Biosens. Bioelectron., 2013, 50, 210–216 CrossRef CAS PubMed.
- G. Xiang, D. Jiang, F. Luo, F. Liu, L. Liu and X. Pu, Sens. Actuators, B, 2014, 195, 515–519 CrossRef CAS.
- K. Ren, J. Wu, F. Yan and H. Ju, Sci. Rep., 2014, 4, 4360–4365 CrossRef PubMed.
- Y. He, X. Wang, J. Sun, S. Jiao, H. Chen, F. Gao and L. Wang, Anal. Chim. Acta, 2014, 810, 71–78 CrossRef CAS PubMed.
- R. Deng, K. Zhang and J. H. Li, Acc. Chem. Res., 2017, 50, 1059–1068 CrossRef CAS PubMed.
- Q. Tian, Y. Wang, R. Deng, L. Lin, Y. Liu and J. H. Li, Nanoscale, 2015, 7, 987–993 RSC.
- R. Deng, L. Tang, Q. Tian, Y. Wang, L. Lin and J. H. Li, Angew. Chem., Int. Ed., 2014, 53, 2389–2393 CrossRef CAS PubMed.
Footnotes |
| † Electronic supplementary information (ESI) available. See DOI: 10.1039/c8an00437d |
| ‡ These authors contributed equally to this work and should be considered co-first authors. |
| This journal is © The Royal Society of Chemistry 2018 |

