 Open Access Article
Online monitoring of a photocatalytic reaction by real-time high resolution FlowNMR spectroscopy†
Andrew M. R.
Hall
a,
Rachael
Broomfield-Tagg
b,
Matthew
Camilleri
a,
David R.
Carbery
*b,
Anna
Codina
c,
David T. E.
Whittaker
d,
Steven
Coombes
d,
John P.
Lowe
b and
Ulrich
Hintermair
 *a
*a
aCentre for Sustainable Chemical Technologies, University of Bath, Claverton Down, Bath, BA2 7AY, UK. E-mail: U.Hintermair@bath.ac.uk
bDepartment of Chemistry, University of Bath, Claverton Down, Bath BA2 7AY, UK. E-mail: D.Carbery@bath.ac.uk
cBruker UK Ltd., Banner Lane, Coventry CV4 9GH, UK
dAstraZeneca, Charter Way, Macclesfield SK10 2NA, UK
First published on 13th November 2017
Abstract
We demonstrate how FlowNMR spectroscopy can readily be applied to investigate photochemical reactions that require sustained input of light and air to yield mechanistic insight under realistic conditions. The Eosin Y mediated photo-oxidation of N-allylbenzylamine is shown to produce imines as primary reaction products from which undesired aldehydes form after longer reaction times. Facile variation of reaction conditions during the reaction in flow allows for probe experiments that give information about the mode of action of the photocatalyst.
Photochemical reactions are an important part of the modern synthetic chemist's repertoire due to the unique chemistry occurring in the excited state.1–5 Visible light photo(redox)catalysis is of particular current interest due to the potential for utilization of sunlight as a sustainable energy source in chemical synthesis.6–11 In order to gain an understanding of the mechanisms involved in these reactions it is necessary to have a means of producing high quality kinetic data under realistic conditions. Spectroscopic techniques such as Ultra-violet visible (UV-vis), Infrared (IR) and fluorescence spectroscopies have been widely used for monitoring photochemical reactions, however, these techniques are only able to provide limited structural information about reaction species and require calibration before use.1,12–15 Mass Spectrometry represents a complimentary technique with higher sensitivity and resolution, but structural information may still be limited for novel compounds where fragmentation patterns are unknown, and calibration is required before quantitative results may be attained.16,17 Although less sensitive, Nuclear Magnetic Resonance (NMR) spectroscopy provides a wealth of structural information over a wide detection range and does not require external calibration. However, conventional NMR techniques are incompatible with photochemical reactions due to the difficulties in irradiating the sample once it is inside the magnet.13,14
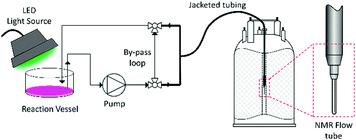
For this reason, most NMR monitoring of photochemical reactions is performed off-line, but the delays and sample work-up procedures between reaction and analysis often entail compositional changes. In situ approaches including setups where light is guided from an external source to the sample inside the spectrometer using mirrors or fibre-optic cables,18,19 special sample tubes with miniature LED light sources inside the spectrometer20,21 and modified NMR probes have been developed,13,14 but these require custom-made equipment and are the domain of specialists. In addition, these setups do not allow for mixing of the sample or changes in reaction conditions,22 and often deliver light at one point only.14,19–21 The lack of control of light intensity across the sample means that recreating realistic conditions is difficult, which may result in different rates and/or mechanisms for reactions that are limited by photon density. The use of NMR as an on-line monitoring technique has been known for some years, primarily as a detection method in HPLC-NMR coupled analysis,23,24 but has only recently gained interest as a method for real-time reaction monitoring. This has been spurred on by the recent commercialisation of a number of dedicated FlowNMR monitoring systems25–28 accompanied by several reports detailing considerations for their use.26,29,30 On-line FlowNMR techniques utilize an external reaction vessel, situated outside of the influence of the magnetic field, with the sample continuously pumped into the spectrometer through a dedicated NMR flow tube located within a standard NMR probe, before returning to the reaction vessel (Fig. 1).25,29 This setup permits full control over the reaction conditions during the analysis, including mixing, addition of reagents, temperature regulation, as well as irradiation of the sample.22 Advanced solvent suppression techniques allow the use of non-deuterated solvents without compromising data quality, reducing cost and avoiding unwanted isotope effects.31 Two recent papers have explored the possibility of utilizing on-line NMR reaction monitoring to study photochemical reactions, with one study investigating the photochemical degradation of environmental pollutants,13 and another using a low-field NMR spectrometer for analysis of products exiting from a photochemical flow reactor.32 To the best of our knowledge, no examples of high-resolution FlowNMR reaction monitoring for kinetic and mechanistic investigations of photochemical reactions have thus far been reported.
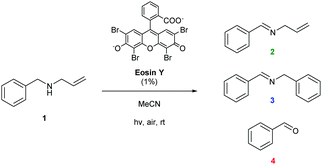
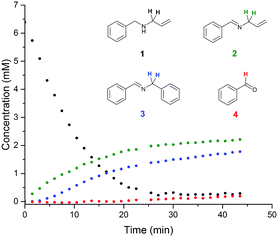
Examples of visible light photocatalysis are abundant in nature, forming the basis of many key biological processes.1,2,5 Flavins, based on a tricyclic isoalloxazine ring system, are an important class of natural photocatalysts.2,33–35 Synthetic fluorescent dyes mimicking the core structure of flavins have been developed as staining agents for biological systems, including compounds such as Fluorescein, Eosin and Rose Bengal. In the presence of visible light and air, Flavin and Eosin Y have been found to catalyse reactions of secondary amines to give a mixture of inter- and intramolecular oxidation products (Scheme 1).36 The reaction proceeds at room temperature in acetonitrile solution under white or green light irradiation in air (Scheme 1). Sampling off-line 1H NMR analysis of the reaction showed the major products to be oxidation product 2 and intermolecular coupling product 3 (Fig. 2). Small amounts of benzaldehyde were also observed throughout the reaction as an undesired by-product. Even with utmost care, data from off-line sampling was always scattered and difficult to reproduce due to slight variations between different samples and the need for work-up before the analysis (Fig. 2). Monitoring the reaction under the same conditions by online 1H FlowNMR spectroscopy however (Fig. 1) yielded smooth and highly reproducible concentration profiles of all components from a single experiment (Fig. 2). The ∼30 second time lapse between leaving the continuously illuminated vessel and reaching the NMR probe was sufficient to avoid adverse effects on NMR data acquisition due to photo-generated radicals, and the returning aliquot resumed turnover once returned to the illuminated vessel.‡ The data obtained revealed a steady consumption of the N-allylbenzylamine starting material, with a corresponding increase in concentration of products 2 and 3 in a 1![[thin space (1/6-em)]](https://www.rsc.org/images/entities/char_2009.gif) :
:![[thin space (1/6-em)]](https://www.rsc.org/images/entities/char_2009.gif) 1 ratio at virtually identical rates. The rate of the reaction was constant until about 65% conversion, indicating pseudo-zero order kinetics in 1 under the conditions applied. Interestingly, no benzaldehyde formation was observed by FlowNMR during the initial stages of the reaction; the associated peaks did not appear until about 2 hours into the reaction, corresponding to >80% substrate consumption. This clearly showed benzaldehyde to be a secondary reaction product formed from imines 2 and 3 rather than from amine 1, which appeared much more pronounced in the off-line reaction monitoring data due to degradation between sampling and data acquisition. Under the conditions applied, substrate conversion reached completion after ∼4 hours, after which the concentration of benzaldehyde continued to increase at the expense of both 2 and 3, although degradation of allylphenylimine 2 was slightly faster than the more stable benzylphenylimine 3.
1 ratio at virtually identical rates. The rate of the reaction was constant until about 65% conversion, indicating pseudo-zero order kinetics in 1 under the conditions applied. Interestingly, no benzaldehyde formation was observed by FlowNMR during the initial stages of the reaction; the associated peaks did not appear until about 2 hours into the reaction, corresponding to >80% substrate consumption. This clearly showed benzaldehyde to be a secondary reaction product formed from imines 2 and 3 rather than from amine 1, which appeared much more pronounced in the off-line reaction monitoring data due to degradation between sampling and data acquisition. Under the conditions applied, substrate conversion reached completion after ∼4 hours, after which the concentration of benzaldehyde continued to increase at the expense of both 2 and 3, although degradation of allylphenylimine 2 was slightly faster than the more stable benzylphenylimine 3.
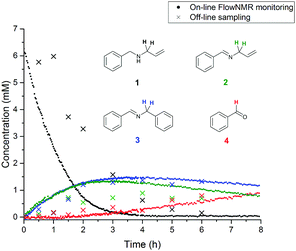 | ||
| Fig. 2 Off-line and on-line FlowNMR reaction profiles of N-allylbenzylamine (1) in MeCN (6.4 mM) at 20 °C in the presence of Eosin Y catalyst (1 mol%) under green LED illumination (633 μW) to form 2, 3 and 4 (On-line: 100 mL, 4 mL min−1 flowrate, WET solvent suppression, 1.64 s acquisition time, 3 s relaxation delay, 12 scans. Off-line: 300 mL, 3 s acquisition time, 1 s relaxation decay, 16 scans. 20 mL samples were periodically withdrawn from the reaction mixture and concentrated under reduced pressure before dissolving in CDCl3 for analysis). See the ESI† for details. | ||
Increasing the concentration of 1 seven-fold resulted in a lengthening of the reaction time, again with constant rates during the first 6 hours up to ∼65% conversion indicative of saturation kinetics (Fig. S2, ESI†). Over these longer reaction times a number of other (currently unidentified) by-products were observed to form at low concentration, as evidenced by the appearance of a variety of small peaks in the 1H spectra (Fig. S3, ESI†). Sum integration of the aromatic region remained constant over the course of the reaction, however, demonstrating that the reaction mass-balance was maintained (Fig. S4, ESI†).
Having access to the reaction vessel during FlowNMR experiments means that the mode and power of illumination may easily be changed while ensuring even light input across the sample, as a way of investigating whether the reaction is limited by the availability of photons. When using a more powerful light source (250 mW halogen lamp) the reaction became much faster, reaching completion in just 30 minutes at 0 °C (Fig. 3), with fewer by-products formed than with lower power LED light sources that required longer reaction times. Since the Eosin Y exhibits a sharp absorption peak at around 535 nm, with minimal absorption at other wavelengths emitted by the halogen lamp (Fig. S5, ESI†), this difference in reaction rate is attributed to the greater light intensity rather than the presence of higher energy UV photons. This was confirmed by performing the reaction using a UV filter, which yielded a virtually identical reaction rate (Fig. S6, ESI†). The formation of benzaldehyde was not significantly affected by light intensity, proceeding at roughly the same rate regardless of light source once appreciable amounts of 2 and 3 had formed in the reaction mixture.
Varying light intensity further revealed the reaction to be photon-limited under typical conditions, with higher lamp powers yielding increased initial reaction rates (Table S1 and Fig. S7, ESI†). While under photon-limited conditions, 2 and 3 appeared to form in parallel (Fig. 2), under high illumination conditions 2 formed as soon as the light was switched on, but formation of 3 occurred only after an induction period of 2–3 minutes (Fig. 3). This observation suggests the formation of 3 to proceed via the reaction of 2 with 1, activated by the excited photocatalyst system (most likely an α-aminoradical),36 leading to coupling and loss of two allylic groups. No allylic signals other than those from 1 were ever observed by NMR, but spiking a reaction mixture with allylamine showed it to rapidly disappear from the spectra as soon as the reaction was restarted by illumination (Fig. S8, ESI†), showing likely by-products of the formation of 3 and 4 to be undetectable under the conditions applied.
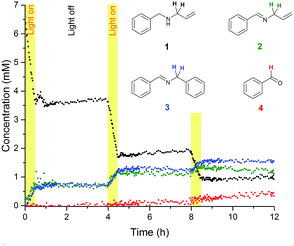
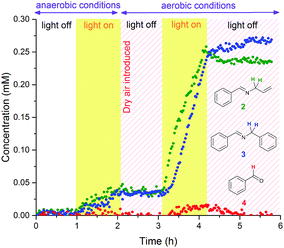
To investigate the nature of the photo-initiated radical reaction system, variations of atmosphere and illumination were undertaken during the reaction. A chopped illumination experiment performed in air (Fig. 4) revealed that no further reaction took place in the absence of light after initial irradiation, showing the photo-generated reactive species to have short lifetimes and only operate under sustained input of photons. Product distribution profiles were identical to experiments performed under continuous illumination. Altering reaction atmospheres during light variation showed that some product formed very slowly in an illuminated reaction mixture under dry argon, and no reaction took place when air was introduced but the light switched off (Fig. 5). Product formation only occurred when illuminated under aerobic conditions, and the reaction stalled immediately when the light was switched off again.
The formation of benzaldehyde 4 seemed to occur only under illumination in air (Fig. 5). Test reactions showed the imine products 2 and 3 to be resistant to hydrolysis in the absence of Eosin Y,37 and addition of water to an anhydrous photocatalytic FlowNMR experiment did not affect the amount of benzaldehyde formation (Fig. S9, ESI†). Thus, product degradation to the undesired aldehydes must be a parallel photo-initiated process rather than a simple hydrolysis reaction. This may proceed via the formation of the corresponding iminoradicals,36 or may be due to the presence of singlet oxygen formed upon excitation of Eosin Y.38 Combining all these observations leads to the proposed reaction network shown in Scheme 2.
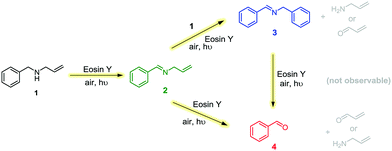 | ||
| Scheme 2 Reaction network based on experimentally observed product and by-product formation profiles, and conditions. | ||
We have shown how FlowNMR spectroscopy can be readily applied to investigate photochemical reactions under realistic conditions to provide valuable mechanistic insight. Substrate consumption profiles showed the reaction to operate under saturation kinetics (photon starvation), and product formation profiles revealed their relative order of formation. Variation of light intensities and reaction atmospheres in conjunction with chopped illumination experiments gave insight into the mode of action of the Eosin Y photocatalyst system, and showed aldehyde formation to occur from the imines via a parasitic photocatalytic pathway. This information, not easily accessible by alternative reaction monitoring techniques, will allow swift optimisation of reaction conditions and assist the design of improved photocatalytic systems in the future.
This work was supported by a Research Grant from the Royal Society (Y0603), the EPSRC Centre for Doctoral Training in Sustainable Chemical Technologies (EP/L016354/1), the Dynamic Reaction Monitoring Facility at the University of Bath (EP/P001475/1), Bruker UK Ltd, and AstraZeneca. U. H. acknowledges the Centre for Sustainable Chemical Technologies for a Whorrod Research Fellowship. The authors would like to thank Joshua Tibbets, Dr Catherine Lyall and Dr Emma Emanuelsson from the University of Bath for support and assistance with this project.
Conflicts of interest
A. C. is an employee of Bruker UK Ltd, manufacturer and supplier of NMR hard- and software solutions that have been used in this research. The other authors declare no competing financial interest.Notes and references
- B. König, Chemical Photocatalysis, De Gruyter, 2013 Search PubMed.
- P. F. Heelis, Chem. Soc. Rev., 1982, 11, 15–39 RSC.
- N. Hoffmann, Chem. Rev., 2008, 108, 1052–1103 CrossRef CAS PubMed.
- Y. Inoue, Chem. Rev., 1992, 92, 741–770 CrossRef CAS.
- K. Szacilowski, W. Macyk, A. Drzewiecka-Matuszek, M. Brindell and G. Stochel, Chem. Rev., 2005, 105, 2647–2694 CrossRef CAS PubMed.
- V. Balzani, A. Credi and M. Venturi, ChemSusChem, 2008, 1, 26–58 CrossRef CAS PubMed.
- J.-T. Li, J.-H. Yang, J.-F. Han and T.-S. Li, Green Chem., 2003, 5, 433 RSC.
- M. Oelgemöller, C. Jung and J. Mattay, Pure Appl. Chem., 2007, 79, 1939–1947 CrossRef.
- C. K. Prier, D. A. Rankic and D. W. C. MacMillan, Chem. Rev., 2013, 113, 5322–5363 CrossRef CAS PubMed.
- J. M. R. Narayanam and C. R. J. Stephenson, Chem. Soc. Rev., 2011, 40, 102–113 RSC.
- T. P. Yoon, M. A. Ischay and J. Du, Nat. Chem., 2010, 2, 527–532 CrossRef CAS PubMed.
- G. L. Closs and R. J. Miller, J. Am. Chem. Soc., 1981, 103, 3586–3588 CrossRef CAS.
- L. Bliumkin, R. Dutta Majumdar, R. Soong, A. Adamo, J. P. D. Abbatt, R. Zhao, E. Reiner and A. J. Simpson, Environ. Sci. Technol., 2016, 50, 5506–5516 CrossRef CAS PubMed.
- G. E. Ball, Spectroscopic Properties of Inorganic and Organometallic Compounds, RSC, 2010, vol. 41, pp. 262–287 Search PubMed.
- B. Roig, E. Touraud and O. Thomas, Spectrochim. Acta, Part A, 2002, 58, 2925–2930 CrossRef CAS.
- J. Luo, A. G. Oliver and J. S. McIndoe, Dalton Trans., 2013, 42, 11312–11318 RSC.
- R. Theron, Y. Wu, L. P. E. Yunker, A. V. Hesketh, I. Pernik, A. S. Weller and J. S. McIndoe, ACS Catal., 2016, 6, 6911–6917 CrossRef CAS.
- T. F. Page, Jr., Chem. Ind., 1969, 1462–1463 Search PubMed.
- A. Mills and C. O’Rourke, J. Org. Chem., 2015, 80, 10342–10345 CrossRef CAS PubMed.
- C. Feldmeier, H. Bartling, K. Magerl and R. M. Gschwind, Angew. Chem., Int. Ed., 2015, 54, 1347–1351 CrossRef CAS PubMed.
- C. Feldmeier, H. Bartling, E. Riedle and R. M. Gschwind, J. Magn. Reson., 2013, 232, 39–44 CrossRef CAS PubMed.
- D. A. Foley, A. L. Dunn and M. T. Zell, Magn. Reson. Chem., 2016, 54, 451–456 CrossRef CAS PubMed.
- K. Albert, On-Line LC-NMR And Related Techniques, John Wiley & Sons, Ltd, 2003, pp. 1–22 Search PubMed.
- K. Albert and E. Bayer, TrAC, Trends Anal. Chem., 1988, 7, 288–293 CrossRef CAS.
- D. A. Foley, E. Bez, A. Codina, K. L. Colson, M. Fey, R. Krull, D. Piroli, M. T. Zell and B. L. Marquez, Anal. Chem., 2014, 86, 12008–12013 CrossRef CAS PubMed.
- D. A. Foley, M. T. Zell, B. L. Marquez and A. Kaerner, Pharm. Technol., 2011, 11, S19 Search PubMed.
- M. Khajeh, M. A. Bernstein and G. A. Morris, Magn. Reson. Chem., 2010, 48, 516–522 CrossRef CAS PubMed.
- M. V. Silva Elipe and R. R. Milburn, Magn. Reson. Chem., 2016, 54, 437–443 CrossRef CAS PubMed.
- A. M. R. Hall, J. C. Chouler, A. Codina, P. T. Gierth, J. P. Lowe and U. Hintermair, Catal. Sci. Technol., 2016, 6, 8406–8417 CAS.
- N. Zientek, K. Meyer, S. Kern and M. Maiwald, Chem. Ing. Tech., 2016, 88, 698–709 CrossRef CAS.
- S. H. Smallcombe, S. L. Patt and P. A. Keifer, J. Magn. Reson., Ser. A, 1995, 117, 295–303 CrossRef CAS.
- N. Emmanuel, C. Mendoza, M. Winter, C. R. Horn, A. Vizza, L. Dreesen, B. Heinrichs and J.-C. M. Monbaliu, Org. Process Res. Dev., 2017, 21, 1435–1438 CrossRef CAS.
- D. P. Hari and B. König, Org. Lett., 2011, 13, 3852–3855 CrossRef CAS PubMed.
- Y. Pan, S. Wang, C. W. Kee, E. Dubuisson, Y. Yang, K. P. Loh and C.-H. Tan, Green Chem., 2011, 13, 3341–3344 RSC.
- N. A. Romero and D. A. Nicewicz, Chem. Rev., 2016, 116, 10075–10166 CrossRef CAS PubMed.
- A. T. Murray, M. J. Dowley, F. Pradaux-Caggiano, A. Baldansuren, A. J. Fielding, F. Tuna, C. H. Hendon, A. Walsh, G. C. Lloyd-Jones, M. P. John and D. R. Carbery, Angew. Chem., Int. Ed., 2015, 54, 8997–9000 CrossRef CAS PubMed.
- A. Murray, Doctor of Philosophy thesis, University of Bath, 2015.
- F. Amat-Guerri, M. M. C. López-González, R. Martínez-Utrilla and R. Sastre, J. Photochem. Photobiol., A, 1990, 53, 199–210 CrossRef CAS.
Footnotes |
| † Electronic supplementary information (ESI) available: Experimental details and additional figures. See DOI: 10.1039/c7cc07059d |
| ‡ Total volume of FlowNMR apparatus = 3.7 mL. For a 100 mL reaction volume the sample spends 4% of the reaction time outside the reaction vessel (on average). |
| This journal is © The Royal Society of Chemistry 2018 |

