 Open Access Article
Creative Commons Attribution 3.0 Unported Licence
Enhanced oxygen storage capacity of cation-ordered cerium–zirconium oxide induced by titanium substitution†
Yoshihiro
Goto
 *a,
Akira
Morikawa
 a,
Masaoki
Iwasaki
a,
Masahide
Miura
b and
Toshitaka
Tanabe
a
a,
Masaoki
Iwasaki
a,
Masahide
Miura
b and
Toshitaka
Tanabe
a
aToyota Central R&D Labs., Inc., 41-1 Nagakute, Aichi 480-1192, Japan. E-mail: yoshihiro-goto@mosk.tytlabs.co.jp
bToyota Motor Corporation, Toyota, Aichi 471-8571, Japan
First published on 15th March 2018
Abstract
Herein, we report on the synthesis of Ce0.5Zr0.5−xTixO2 oxygen storage materials prepared via a solution combustion method. Ce0.5Zr0.4Ti0.1O2 showed an outstanding oxygen storage capacity (1310 μmol-O per g) at 200 °C compared to conventional κ-Ce2Zr2O8 (650 μmol-O per g) due to its cation ordering and the formation of weakly bound oxygen atoms induced by Ti substitution.
Some metal oxides can reversibly store/release oxygen or control the oxygen concentration in the gas phase in response to changes in the temperature and oxygen partial pressure.1 Such oxides have been actively investigated for different applications in the fields of energy conversion and environmental protection such as solid oxide fuel cells (SOFCs),2 thermochemical water splitting,3 and water–gas shift reactions.4 Ceria (CeO2) is generally used as an oxygen storage material in automotive exhaust catalysis in order to maintain the high purification efficiency by precisely controlling the oxygen partial pressure.5,6
The oxygen storage/release capacity (OSC) of CeO2 corresponding to the redox reaction between Ce3+ and Ce4+ is greatly enhanced by Zr substitution, reaching its maximum for Ce0.5Zr0.5O2 (900 μmol-O per g at 500 °C).1a High-temperature reduction (in H2 or CO at 1200 °C) of Ce0.5Zr0.5O2 yields the Ce2Zr2O7 pyrochlore (Ce and Zr site ordered Ce0.5Zr0.5O1.75), which leads to cation-ordered Ce0.5Zr0.5O2 after a re-oxidation treatment.7–9 This cation-ordered Ce0.5Zr0.5O2 (referred to as κ-Ce2Zr2O8) shows an outstanding OSC of 1500 μmol-O per g at 500 °C, where almost all Ce atoms in κ-Ce2Zr2O8 (89%) contribute to the Ce3+ ↔ Ce4+ redox conversion.9,10 Such a high OSC value is derived from the topotactic transformation of the κ-Ce2Zr2O8 into Ce2Zr2O7 pyrochlore assessed by the first-principles calculation method.11
The cation ordering in complex oxides is often induced by cation size mismatches.12–14 Therefore, an increase in the cation size mismatch from 1.15 (Ce4+/Zr4+) to 1.58 (Ce3+/Zr4+) should stabilize the cation-ordered structure of the Ce2Zr2O7 pyrochlore. Thus, the substitution of Zr4+ (0.84 Å) with Ti4+ (0.74 Å) in Ce0.5Zr0.5O2 would result in cation-ordered Ce0.5Zr0.5−xTixO2 due to the expansion of the mismatch against Ce4+ (0.97 Å).15 However, conventional methods such as solid state reactions and co-precipitations are not able to achieve homogeneous Ti distribution.
In this study, we employed a solution combustion method that is characterized as a self-sustained exothermic reaction.16–18 Technically, the combustion of fuels (e.g. urea, glycine, etc.) with oxidants (typically metal nitrates) followed by a rapid quenching allowed us to obtain homogeneous compounds with desired compositions.19,20 Also, the Ti substitution in Ce0.5Zr0.5−xTixO2 (0 ≤ x ≤ 0.2) induced pyrochlore-type cation ordering between the Ce and Zr sites and greatly increased the OSC values. The OSC of Ce0.5Zr0.4Ti0.1O2 (1310 μmol-O per g) was found to be approximately twice that of κ-Ce2Zr2O8 (650 μmol-O per g) at a lower temperature (200 °C). Moreover, the origins of the cation ordering and enhanced OSC were investigated from the viewpoints of crystal structures and the strengths of the bonds between the oxygen atoms and the surrounding cations.
The Ce0.5Zr0.5−xTixO2 samples were prepared from aqueous solutions containing both glycine as a fuel and the respective metal nitrates as oxidants. The solutions with cation ratios of Ce![[thin space (1/6-em)]](https://www.rsc.org/images/entities/char_2009.gif) :
:![[thin space (1/6-em)]](https://www.rsc.org/images/entities/char_2009.gif) Zr
Zr![[thin space (1/6-em)]](https://www.rsc.org/images/entities/char_2009.gif) :
:![[thin space (1/6-em)]](https://www.rsc.org/images/entities/char_2009.gif) Ti = 0.5
Ti = 0.5![[thin space (1/6-em)]](https://www.rsc.org/images/entities/char_2009.gif) :
:![[thin space (1/6-em)]](https://www.rsc.org/images/entities/char_2009.gif) (0.5 − x)
(0.5 − x)![[thin space (1/6-em)]](https://www.rsc.org/images/entities/char_2009.gif) :
:![[thin space (1/6-em)]](https://www.rsc.org/images/entities/char_2009.gif) x (x = 0, 0.1, 0.2, 0.3, 0.4, and 0.5) were burned by heating up to 400 °C, resulting in light-yellow powders (experimental details are provided in the ESI†). The specific surface areas (SSAs) of the Ti-containing samples (x = 0.1
x (x = 0, 0.1, 0.2, 0.3, 0.4, and 0.5) were burned by heating up to 400 °C, resulting in light-yellow powders (experimental details are provided in the ESI†). The specific surface areas (SSAs) of the Ti-containing samples (x = 0.1![[thin space (1/6-em)]](https://www.rsc.org/images/entities/char_2009.gif) :
:![[thin space (1/6-em)]](https://www.rsc.org/images/entities/char_2009.gif) 8.29 m2 g−1, x = 0.2
8.29 m2 g−1, x = 0.2![[thin space (1/6-em)]](https://www.rsc.org/images/entities/char_2009.gif) :
:![[thin space (1/6-em)]](https://www.rsc.org/images/entities/char_2009.gif) 7.48 m2 g−1) were less than half of the amount of x = 0 (17.08 m2 g−1). However, these SSAs were much higher than that of κ-Ce2Zr2O8 (0.35 m2 g−1), which was obtained by a high-temperature reduction of Ce0.5Zr0.5O2 at 1200 °C followed by oxidation at 500 °C (Table 1).
7.48 m2 g−1) were less than half of the amount of x = 0 (17.08 m2 g−1). However, these SSAs were much higher than that of κ-Ce2Zr2O8 (0.35 m2 g−1), which was obtained by a high-temperature reduction of Ce0.5Zr0.5O2 at 1200 °C followed by oxidation at 500 °C (Table 1).
| Compound | SSAa (m2 g−1) | Space group | Cell volumeb (Å) | Cation ratioc (mol%) | OSCd (μmol-O per g) | ||||
|---|---|---|---|---|---|---|---|---|---|
| Ce | Zr | Ti | 200 °C | 400 °C | 600 °C | ||||
| a Measured by BET analysis. b Calculated from the lattice parameters based on the unit cell of Ce0.5Zr0.5O2 (Z = 4). c Measured by ICP-OES. d Estimated from the weight losses in the TGA curves. e Prepared by the reduction of Ce0.5Zr0.5O2 at 1200 °C followed by oxidation at 500 °C.9 f Feed ratio in the synthesis. | |||||||||
| Ce0.5Zr0.5O2 | 17.08 |
Fm![[3 with combining macron]](https://www.rsc.org/images/entities/char_0033_0304.gif) m m |
146.167(5) | 50.2 | 49.8 | — | 910 | 1070 | 1120 |
| Ce0.5Zr0.4Ti0.1O2 | 8.29 |
F![[4 with combining macron]](https://www.rsc.org/images/entities/char_0034_0304.gif) 3m 3m |
144.729(3) | 50.3 | 40.0 | 9.7 | 1310 | 1530 | 1530 |
| Ce0.5Zr0.3Ti0.2O2 | 7.48 |
F![[4 with combining macron]](https://www.rsc.org/images/entities/char_0034_0304.gif) 3m 3m |
143.598(4) | 50.2 | 30.1 | 19.7 | 1370 | 1550 | 1590 |
| κ-Ce2Zr2O8e | 0.35 | P213 | 145.758(5) | (50)f | (50)f | — | 650 | 1530 | 1560 |
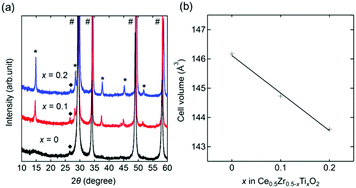
A cubic phase was observed in the X-ray diffraction (XRD) patterns of x = 0, 0.1, and 0.2 (Fig. 1a). An unknown impurity with a reflection at around 2θ = 26.7° was found, but its intensity was less than 1% of the main cubic phase. Additional phases (CeO2 and unknown) were found in the patterns of x = 0.3, 0.4, and 0.5 (Fig. S1, ESI†). The main phase of x = 0 was characterized by a cubic fluorite structure (Fm![[3 with combining macron]](https://www.rsc.org/images/entities/char_0033_0304.gif) m) with a = 5.2682(2) Å, which was in agreement with the reported space group (Fm
m) with a = 5.2682(2) Å, which was in agreement with the reported space group (Fm![[3 with combining macron]](https://www.rsc.org/images/entities/char_0033_0304.gif) m) and lattice parameter (a = 5.269) of Ce0.5Zr0.5O2.21 In contrast, the main phases of x = 0.1 and 0.2 showed additional peaks originating from their superstructures assigned to a 2 × 2 × 2 supercell based on Ce0.5Zr0.5O2. The cell volumes calculated from the lattice parameters showed a linear decrease with an increase in the value of x (Fig. 1b and Table 1). The volume reduction indicated the formation of Ce0.5Zr0.5−xTixO2 solid solutions (0 ≤ x ≤ 0.2) because the ionic radius of tetravalent Ti (0.74 Å) is smaller than that of Zr (0.84 Å).15 Elemental analysis using inductively coupled plasma-optical emission spectrometry (ICP-OES) supported the formation of the solid solution since the measured compositions of the obtained Ce0.5Zr0.5−xTixO2 samples were equal to the feed ratios of Ce
m) and lattice parameter (a = 5.269) of Ce0.5Zr0.5O2.21 In contrast, the main phases of x = 0.1 and 0.2 showed additional peaks originating from their superstructures assigned to a 2 × 2 × 2 supercell based on Ce0.5Zr0.5O2. The cell volumes calculated from the lattice parameters showed a linear decrease with an increase in the value of x (Fig. 1b and Table 1). The volume reduction indicated the formation of Ce0.5Zr0.5−xTixO2 solid solutions (0 ≤ x ≤ 0.2) because the ionic radius of tetravalent Ti (0.74 Å) is smaller than that of Zr (0.84 Å).15 Elemental analysis using inductively coupled plasma-optical emission spectrometry (ICP-OES) supported the formation of the solid solution since the measured compositions of the obtained Ce0.5Zr0.5−xTixO2 samples were equal to the feed ratios of Ce![[thin space (1/6-em)]](https://www.rsc.org/images/entities/char_2009.gif) :
:![[thin space (1/6-em)]](https://www.rsc.org/images/entities/char_2009.gif) Zr
Zr![[thin space (1/6-em)]](https://www.rsc.org/images/entities/char_2009.gif) :
:![[thin space (1/6-em)]](https://www.rsc.org/images/entities/char_2009.gif) Ti = 5
Ti = 5![[thin space (1/6-em)]](https://www.rsc.org/images/entities/char_2009.gif) :
:![[thin space (1/6-em)]](https://www.rsc.org/images/entities/char_2009.gif) 5
5![[thin space (1/6-em)]](https://www.rsc.org/images/entities/char_2009.gif) :
:![[thin space (1/6-em)]](https://www.rsc.org/images/entities/char_2009.gif) 0, 5
0, 5![[thin space (1/6-em)]](https://www.rsc.org/images/entities/char_2009.gif) :
:![[thin space (1/6-em)]](https://www.rsc.org/images/entities/char_2009.gif) 4
4![[thin space (1/6-em)]](https://www.rsc.org/images/entities/char_2009.gif) :
:![[thin space (1/6-em)]](https://www.rsc.org/images/entities/char_2009.gif) 1, and 5
1, and 5![[thin space (1/6-em)]](https://www.rsc.org/images/entities/char_2009.gif) :
:![[thin space (1/6-em)]](https://www.rsc.org/images/entities/char_2009.gif) 3
3![[thin space (1/6-em)]](https://www.rsc.org/images/entities/char_2009.gif) :
:![[thin space (1/6-em)]](https://www.rsc.org/images/entities/char_2009.gif) 2 for x = 0, 0.1, and 0.2, respectively (Table 1).
2 for x = 0, 0.1, and 0.2, respectively (Table 1).
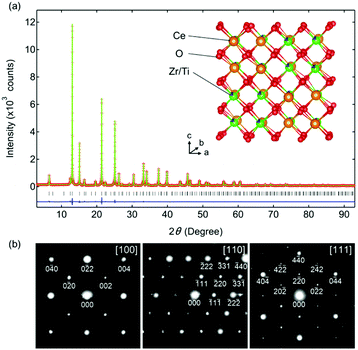
Rietveld refinement of the synchrotron XRD pattern of Ce0.5Zr0.4Ti0.1O2 was performed using a F![[4 with combining macron]](https://www.rsc.org/images/entities/char_0034_0304.gif) 3m model in which Ce and Zr(Ti) atoms were ordered along the 〈110〉 direction (Fig. 2a). The high reliability of the refined data (Rwp = 6.46%, goodness of fit = 0.80, Table S1, ESI†) suggested that the predicted model for Ce0.5Zr0.4Ti0.1O2 was reasonable. The crystal structure is shown in Fig. 2a. The electron diffraction (ED) patterns of the [100], [110], and [111] zone axes for Ce0.5Zr0.4Ti0.1O2 (x = 0.1) were indexed to the space group F
3m model in which Ce and Zr(Ti) atoms were ordered along the 〈110〉 direction (Fig. 2a). The high reliability of the refined data (Rwp = 6.46%, goodness of fit = 0.80, Table S1, ESI†) suggested that the predicted model for Ce0.5Zr0.4Ti0.1O2 was reasonable. The crystal structure is shown in Fig. 2a. The electron diffraction (ED) patterns of the [100], [110], and [111] zone axes for Ce0.5Zr0.4Ti0.1O2 (x = 0.1) were indexed to the space group F![[4 with combining macron]](https://www.rsc.org/images/entities/char_0034_0304.gif) 3m (Fig. 2b), which was consistent with the structural model used in the Rietveld refinement. Moreover, the absence of 110, 211, and 330 reflections excluded the space group P213, which could be derived from the slight displacements of some O sites from the ideal positions as observed in κ-Ce2Zr2O8.10 This indicates that the structure of Ce0.5Zr0.4Ti0.1O2 was less distorted than that of κ-Ce2Zr2O8.
3m (Fig. 2b), which was consistent with the structural model used in the Rietveld refinement. Moreover, the absence of 110, 211, and 330 reflections excluded the space group P213, which could be derived from the slight displacements of some O sites from the ideal positions as observed in κ-Ce2Zr2O8.10 This indicates that the structure of Ce0.5Zr0.4Ti0.1O2 was less distorted than that of κ-Ce2Zr2O8.
The results from the XRD and ED measurements suggested that pyrochlore-type cation ordering in the Ce0.5Zr0.5−xTixO2 fluorite was observed above a cation size mismatch (rCe4+/rZr4+(Ti4+)) of 1.18, where rZr4+(Ti4+) denotes the weighted average of ionic radii for Zr4+ and Ti4+. In contrast, cation ordering in the A0.5B0.5O1.75 defect fluorite (e.g. Gd0.5Zr0.5−xCexO1.75 and Y0.5Ti0.5−xZrxO1.75) is generally observed above 1.23,12,13 which is slightly larger than the value for the Ce0.5Zr0.5−xTixO2 fluorite (1.18). This difference suggests that the absence of oxygen defect enabled cation ordering in the A0.5B0.5O2 fluorite with a smaller cation size mismatch.
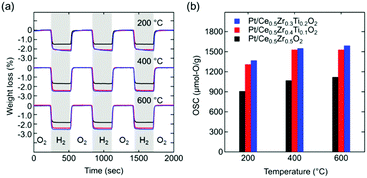
The OSC values of Ce0.5Zr0.5−xTixO2 (0 ≤ x ≤ 0.2) were estimated from the weight losses recorded using thermogravimetric analysis (TGA) during the atmosphere switching between 5% O2/N2 and 5% H2/N2 every 5 min (Fig. 3a).
The weight losses and gains of the samples corresponded to the following reactions:
| Ce0.5Zr0.5−xTixO2 + δH2 → Ce0.5Zr0.5−xTixO2−δ + δH2O | (1) |
| Ce0.5Zr0.5−xTixO2−δ + δ/2O2 → Ce0.5Zr0.5−xTixO2 | (2) |
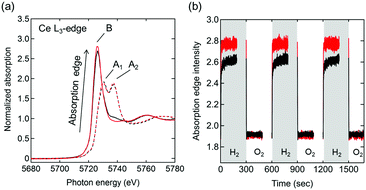
Ce L3-edge X-ray absorption near edge structure (XANES) spectra of Pt/Ce0.5Zr0.5O2 and Pt/Ce0.5Zr0.4Ti0.1O2 at 600 °C in 3% O2/He (Fig. 4a) showed two absorption peaks, at 5730 and 5737 eV (marked as A1 and A2), which were assigned to the Ce4+ species. These results were in agreement with the CeO2 (Ce4+) reference spectrum (Fig. S2, ESI†).23 In 3% H2/He, only one absorption peak, at 5726 eV (marked as B), assigned to the Ce3+ species (shown in the Ce(NO3)3·6H2O (Ce3+) reference) was observed, which indicated the reduction of Ce4+ species to Ce3+. Moreover, in 3% H2/He the absorption of Pt/Ce0.5Zr0.4Ti0.1O2 at B was higher than that of Pt/Ce0.5Zr0.5O2, while in 3% O2/He both samples showed almost the same absorption intensities. This result indicated that the fraction of reducible Ce4+ in Pt/Ce0.5Zr0.4Ti0.1O2 was higher than that in Pt/Ce0.5Zr0.5O2, which was in agreement with the TGA results (Fig. 3b). The transient response of the peak height of the absorption edge during the switching between 3% H2/He and 3% O2/He (Fig. 4b and Fig. S3, ESI†) suggested that the Ce4+ reduction rate in Pt/Ce0.5Zr0.4Ti0.1O2 was higher than that in Pt/Ce0.5Zr0.5O2. For both samples, the intensities that increased in 3% H2/He immediately returned to the original intensities when the atmosphere was changed to 3% O2/He. This demonstrates that the reduced Ce3+ species were reversely re-oxidized to Ce4+ with high reproducibility.
The high OSCs of Pt/Ce0.5Zr0.4Ti0.1O2 could have originated from the topotactic transformation of the Ce0.5Zr0.4Ti0.1O2 into Ce0.5Zr0.4Ti0.1O1.75 pyrochlore. Bond valence sums (BVSs)24,25 are often used to estimate the bond strengths of specific anion sites in crystals.26,27 The respective BVSs of all the oxygen sites in Ce0.5Zr0.4Ti0.1O2 (marked as O1–O6; Fig. S4, ESI†) were obtained, and the OZr(Ti)4 tetrahedron sites (O3 site: −1.61, O4 site: −1.37) were found to have larger values than the other O sites (from −1.82 to −2.46; Table S2, ESI†). The larger BVS values of the O3 and O4 sites suggested that the oxygen atoms at these sites were easily released, which caused the topotactic transformation of the Ce0.5Zr0.4Ti0.1O2 (Ce4+) into Ce0.5Zr0.4Ti0.1O1.75 (Ce3+) pyrochlore. These conclusions were in agreement with the results from κ-Ce2Zr2O8 (Ce4+), which was topotactically reduced to the Ce2Zr2O7 (Ce3+) pyrochlore with the release of oxygen atoms at the O3 and O4 sites (Fig. S4, ESI†).28
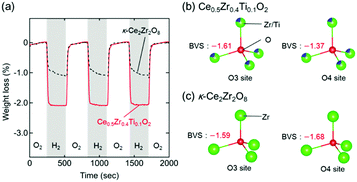
Interestingly, the OSC value of Pt/Ce0.5Zr0.4Ti0.1O2 (1310 μmol-O per g) at a lower temperature (200 °C) was approximately twice that of Pt/κ-Ce2Zr2O8 (650 μmol-O per g, Fig. 5a). In contrast, the OSC values of both compounds above 400 °C were almost the same (1530–1560 μmol-O per g; Table 1 and Fig. S5, ESI†). Prolonging the reduction period (120 min) for Pt/κ-Ce2Zr2O8 at 200 °C gave an OSC value of 740 μmol-O per g (Fig. S6, ESI†), which is still smaller than that of Pt/Ce0.5Zr0.4Ti0.1O2. This suggests that another factor other than SSA would determine the high OSC of Pt/Ce0.5Zr0.4Ti0.1O2. As shown in Fig. 5b and c, the BVS value of the O4 site in Ce0.5Zr0.4Ti0.1O2 (−1.37) was larger than that in κ-Ce2Zr2O8 (−1.68), while the O3 sites in both had similar BVS values (−1.61 for Ce0.5Zr0.4Ti0.1O2 and −1.59 for κ-Ce2Zr2O8). The larger BVS value of the O4 site in Ce0.5Zr0.4Ti0.1O2 indicates that the oxygen atoms at this site were more weakly bound to the surrounding cations. The presence of such weakly bound oxygen atoms in Ce0.5Zr0.4Ti0.1O2 would decrease the oxygen vacancy formation energy, leading to a high OSC even at a lower temperature (200 °C).
In conclusion, Ce0.5Zr0.5−xTixO2 (0 ≤ x ≤ 0.2) were successfully synthesized via the solution combustion method. The substitution of Ti in Ce0.5Zr0.5O2 induced pyrochlore-type cation ordering due to the increased cation size mismatch between the Ce and Zr sites, which caused a significant enhancement of the OSC. The most remarkable observation for the cation-ordered Ce0.5Zr0.4Ti0.1O2 was its high OSC (1310 μmol-O per g) even at a lower temperature (200 °C), which was twice that of conventional κ-Ce2Zr2O8 (650 μmol-O per g). The high OSC at low temperature was explained by the formation of weakly bound oxygen atoms. This study demonstrated that an appropriate compositional control of Ce0.5Zr0.5O2 allows for the induction of pyrochlore-type cation ordering without a high-temperature reduction. Future investigations of the various applications and catalytic activity of these cation-ordered materials synthesized via the solution combustion strategy would be of high interest.
The authors would like to thank Mr Shimotsu (Hitachi Power Solutions Co., Ltd, Ibaraki, Japan) for the support with the ED measurements and Dr Towata (Aichi Synchrotron Radiation Center, Aichi, Japan) for the support with the synchrotron XRD measurements.
Conflicts of interest
There are no conflicts of interest to declare.Notes and references
- (a) M. Yashima, Catal. Today, 2015, 253, 3 CrossRef CAS; (b) M. Karppinen, H. Yamauchi, S. Otani, T. Fujita, T. Motohashi, Y.-H. Huang, M. Valkeapää and H. Fjellvåg, Chem. Mater., 2006, 18, 490 CrossRef CAS; (c) S. Remsen and B. Dabrowski, Chem. Mater., 2011, 23, 3818 CrossRef CAS; (d) T. Motohashi, Y. Hirano, Y. Masubuchi, K. Oshima, T. Setoyama and S. Kikkawa, Chem. Mater., 2013, 25, 372 CrossRef CAS; (e) A. Demizu, K. Beppu, S. Hosokawa, K. Kato, H. Asakura, K. Teramura and T. Tanaka, J. Phys. Chem. C, 2017, 121, 19358 CrossRef CAS.
- Z. Xu, Z. Qi and A. Kaufman, Power Sources, 2003, 115, 40 CrossRef CAS.
- W. C. Chueh, C. Falter, M. Abbott, D. Scipio, P. Furler, S. M. Haile and A. Steinfeld, Science, 2010, 330, 1797 CrossRef CAS PubMed.
- C. M. Kalamaras, D. D. Dionysiou and A. M. Efstathiou, ACS Catal., 2012, 2, 2729 CrossRef CAS.
- A. F. Diwell, R. R. Rajaram, H. A. Shaw and T. J. Truex, Stud. Surf. Sci. Catal., 1991, 71, 139 CrossRef CAS.
- J. Kašpar and P. Fornasiero, J. Solid State Chem., 2003, 171, 19 CrossRef.
- S. Otsuka-Yao-Matsuo, T. Omata, N. Izu and H. Kishimoto, J. Solid State Chem., 1998, 138, 47 CrossRef CAS.
- A. Suda, Y. Ukyo, H. Sobukawa and M. Sugiura, J. Ceram. Soc. Jpn., 2002, 110, 126 CrossRef CAS.
- Y. Nagai, T. Yamamoto, T. Tanaka, S. Yoshida, T. Nonaka, T. Okamoto, A. Suda and M. Sugiura, Catal. Today, 2002, 74, 225 CrossRef CAS.
- H. Kishimoto, T. Omata, S. Otsuka-Yao-Matsuo, K. Ueda, H. Hosono and H. Kawazoe, J. Alloys Compd., 2000, 312, 94 CrossRef CAS.
- H.-F. Wang, Y.-L. Guo, G.-Z. Lu and P. Hu, Angew. Chem., Int. Ed., 2009, 48, 8289 CrossRef CAS PubMed.
- D. P. Reid, M. C. Stennett and N. C. Hyatt, J. Solid State Chem., 2012, 191, 2 CrossRef CAS.
- C. Heremans, B. J. Wuensch, J. K. Stalick and E. Prince, J. Solid State Chem., 1995, 117, 108 CrossRef CAS.
- G. King and P. M. Woodward, J. Mater. Chem., 2010, 20, 5785 RSC.
- R. D. Shannon, Acta Crystallogr., Sect. A: Cryst. Phys., Diffr., Theor. Gen. Crystallogr., 1976, 32, 751 CrossRef.
- B. D. Mukri, U. V. Waghmare and M. S. Hegde, Chem. Mater., 2013, 25, 3822 CrossRef CAS.
- B. Murugan, A. V. Ramaswamy, D. Srinivas and C. S. Gopinath, Chem. Mater., 2005, 17, 3983 CrossRef CAS.
- A. A. Saad, W. Khan, P. Dhiman, A. H. Naqvi and M. Singh, Electron. Mater. Lett., 2013, 9, 77 CrossRef CAS.
- M. S. Hegde, G. Madras and K. C. Patil, Acc. Chem. Res., 2009, 42, 704 CrossRef CAS PubMed.
- A. Varma, A. S. Mukasyan, A. S. Rogachev and K. V. Manukyan, Chem. Rev., 2016, 116, 14493 CrossRef CAS PubMed.
- S. F. Pal'guev, S. I. Alyamovskii and Z. S. Volchenkova, Russ. J. Inorg. Chem., 1959, 4, 1185 Search PubMed.
- B. Xu, H. Y. Sohn, Y. Mohassab and Y. Lan, RSC Adv., 2016, 6, 79706 RSC.
- J. El Fallah, S. Boujana, H. Dexpert, A. Kiennemann, J. Majerus, O. Touret, F. Villain and F. Le Normand, J. Phys. Chem., 1994, 98, 5522 CrossRef CAS.
- I. D. Brown and D. Altermatt, Acta Crystallogr., Sect. B: Struct. Sci., 1985, 41, 244 CrossRef.
- N. E. Brese and M. O’Keeffe, Acta Crystallogr., Sect. B: Struct. Sci., 1991, 47, 192 CrossRef.
- A. Gupta, A. Kumar, U. V. Waghmare and M. S. Hegde, J. Phys. Chem. C, 2017, 121, 1803 CAS.
- N. Wakiya, K. Shinozaki, N. Mizutani and N. Ishizawa, J. Am. Ceram. Soc., 1997, 80, 3217 CrossRef CAS.
- S. N. Achary, S. K. Sali, N. K. Kulkarni, P. S. R. Krishna, A. B. Shinde and A. K. Tyagi, Chem. Mater., 2009, 21, 5848 CrossRef CAS.
Footnote |
| † Electronic supplementary information (ESI) available: Experimental details, XRD patterns, XANES spectra, crystal structures, TGA curves, crystallographic information, and BVS parameters. See DOI: 10.1039/c8cc01308j |
| This journal is © The Royal Society of Chemistry 2018 |

