
Structure-dependent luminescence of tetra-(4-pyridylphenyl)ethylene: a first-principles study†
Ziye
Wu
a,
Guozhen
Zhang
a,
Edward
Sharman
b,
Peng
Cui
a and
Jun
Jiang
 *a
*a
aSchool of Chemistry and Materials Science, Hefei National Laboratory for Physical Sciences at the Microscale, University of Science and Technology of China (USTC), Hefei, 230026, China. E-mail: jiangj1@ustc.edu.cn
bDepartment of Neurology, University of California, Irvine, California 92697, USA
First published on 28th November 2017
Abstract
Luminescent materials with tunable wavelengths have been attracting much attention due to their many promising applications. In the present work, the recently reported supramolecular coordination complexes of tetra-(4-pyridylphenyl)ethylene (TPPE) that produce variable-wavelength light emissions were investigated by time-dependent density functional theory (TDDFT) calculations. We discovered that variations in the luminescent wavelength of TPPE mainly depend on the structural deviations from molecular planarity, which affect the molecular orbital wavefunction distribution. An interesting trigonometric-functional relationship between the emission wavelength (the emission energy) and the dihedral angle defining deviations from molecular planarity was uncovered. The solvent effect was also considered to reveal the mechanism of the solvent-dependent fluorescence color. These findings may be helpful to rational molecular design for high-performance luminescent materials with tunable color.
Fluorescent materials are widely used in many fields, such as fluorescent probes and sensors, bioimaging, light emitting diodes (LED) and so on.1–4 Materials exhibiting wavelength tunability attract much attention5 because of the greater design versatility enabled by their more flexible fluorescence properties. As a consequence of Kasha's rule6—that fluorescence emission always occurs only from the lowest excited state to the ground state—the emission wavelength is independent of the excitation wavelength.7 This constraint greatly increases the difficulty of designing color-tunable luminescent materials. Shifting the fluorescence emission peak has been realized mainly by modifying the structure of chromophores,8–10 requiring the independent synthesis of many molecules, each with a different emission wavelength. Recently, systems of solvatochromic luminogens exhibiting aggregation-induced emission (AIE) have been reported; by changing the solvents, the emission peak of these systems is tunable over a wide range.11,12
Tetraphenylethylene (TPE) and its derivatives are well-known AIE fluorogens. These molecules are non-fluorescent in solution because the fast rotation of the phenyl rings and the twisting of the ethylenic C![[double bond, length as m-dash]](https://www.rsc.org/images/entities/char_e001.gif) C bond always quench the fluorescence.13 In contrast, they are strongly emissive upon aggregation due to restricted intramolecular rotation.14–16 It has also been found that TPE can emit light when used as a ligand in metal–organic frameworks,17,18 and some of its derivatives exhibit both solvatochromism and AIE properties.11,19 Yan et al. found that a TPE-based ligand—tetra-(4-pyridylphenyl)ethylene (TPPE) used in coordination metallacages—exhibits solvent-dependent tunable emissions.19 They attributed these results to two factors: first, the solvent induces the formation of aggregates and further restricts the conformational flexibility of the fluorophores.20 Second, the solvent polarity affects metal-to-ligand charge transfer (MLCT) and consequently shifts the emission color.21 However, detailed information on the solvent-induced aggregation and MLCT is still lacking, and so no mechanism has been established regarding how to predictively tune the emission wavelength of TPPE. Therefore, we started this theoretical research from the simplest molecular structure and identified an approach for tuning the luminescent wavelength characteristics.
C bond always quench the fluorescence.13 In contrast, they are strongly emissive upon aggregation due to restricted intramolecular rotation.14–16 It has also been found that TPE can emit light when used as a ligand in metal–organic frameworks,17,18 and some of its derivatives exhibit both solvatochromism and AIE properties.11,19 Yan et al. found that a TPE-based ligand—tetra-(4-pyridylphenyl)ethylene (TPPE) used in coordination metallacages—exhibits solvent-dependent tunable emissions.19 They attributed these results to two factors: first, the solvent induces the formation of aggregates and further restricts the conformational flexibility of the fluorophores.20 Second, the solvent polarity affects metal-to-ligand charge transfer (MLCT) and consequently shifts the emission color.21 However, detailed information on the solvent-induced aggregation and MLCT is still lacking, and so no mechanism has been established regarding how to predictively tune the emission wavelength of TPPE. Therefore, we started this theoretical research from the simplest molecular structure and identified an approach for tuning the luminescent wavelength characteristics.
In this work, we computed the structure, absorption and emission properties of TPPE, with its molecular planarity varied by changing the dihedral angles at two locations. The emission wavelength of TPPE shifted over a wide range with the variation of molecular planarity. The relationships between emission wavelength (the emission energy) and molecular planarity were explained by a trigonometric function. It was found that the molecular orbital wavefunction distributions affect the emission energy directly. Simulations of TPPE in different solvents showed that solvents could directly change the molecular structure in a small range, but this is expected to constrain the molecular configurations in the excited state by affecting the molecular aggregation behavior. Combining the relationships that we have found and reasonable assumptions about molecular configuration, we can successfully estimate the fluorescence wavelength range of TPPE in experiments.
All calculations were carried out with the Gaussian09 program.22 The ground state (S0) equilibrium structures were optimized by density function theory (DFT)23 at the B3LYP/6-31G(d) level.24–26 Solvent effects were approximated using the polarizable continuum model (PCM),27 and CH2Cl2 is the solvent unless mentioned otherwise. Time-dependent density functional theory (TDDFT) calculations at the same level of theory were carried out to simulate the electronic excited states.28,29 The absorption spectra were generated by Doppler broadening based on the electronic structure. The emission wavelength (or the vertical emission energy of S1) was calculated on the basis of the optimized structure of the lowest excited state (S1). To ensure the adequacy of B3LYP, we also carried out parallel calculations using the PBE030 functional (Fig. S7, ESI†). The partitions of the HOMO (highest occupied molecular orbital) and LUMO (lowest unoccupied molecular orbital) of different organic groups were carried out according to the Mulliken population analysis scheme,31,32 where the off-diagonal terms between the two atomic basis functions were equally divided.
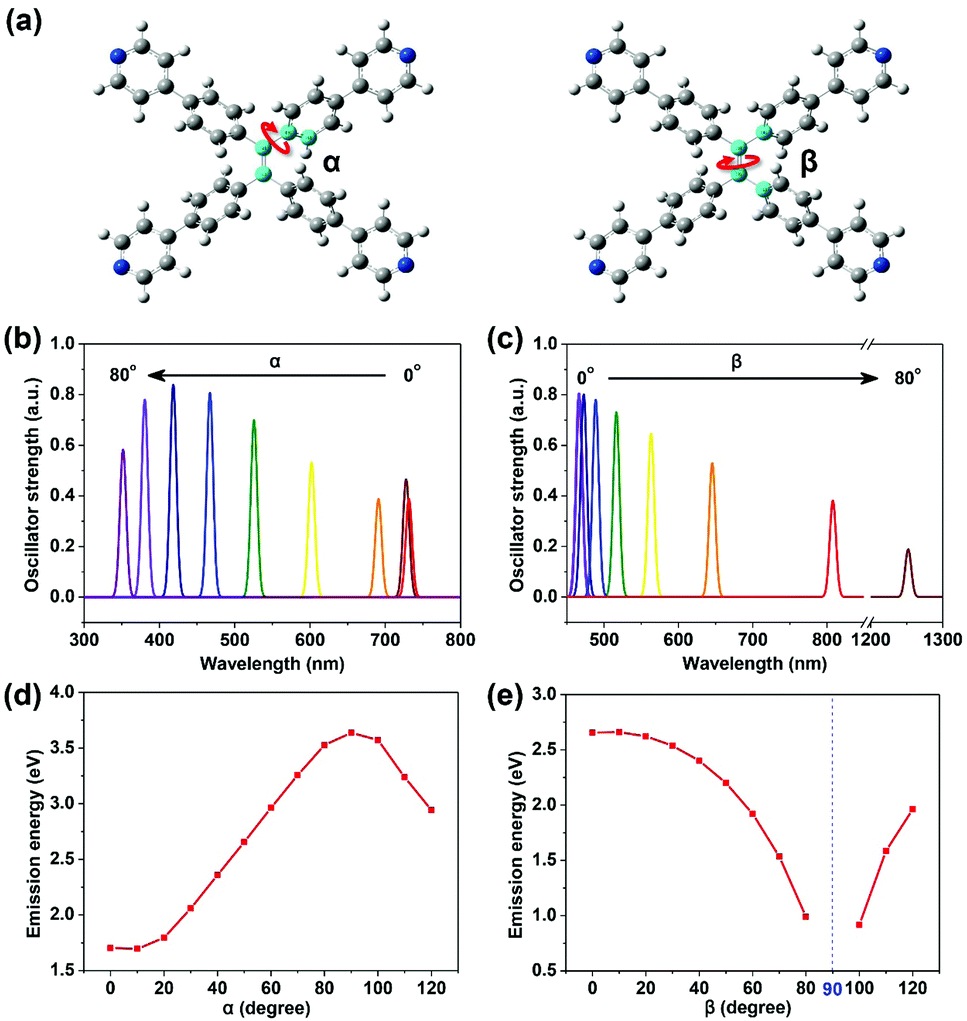
Adjustments in molecular planarity were realized by changing the magnitude of the dihedral angle at two locations (α and β, Fig. 2), corresponding to rotation about the central C–C bonds and the ethylenic CC bond, respectively. Optimization of geometry by adjusting each specified dihedral angle was computed using the keyword “Opt=ModRedundant”. During optimization, the dihedral angles between the phenyl rings and the ethylenic CC bond were frozen, while the other degrees of freedom were allowed to relax.
The optimized geometry of TPPE at the ground state (S0) is very well consistent with experiments (Table S1, ESI†). The simulated absorption spectrum is shown in Fig. 1b. There are three absorption peaks located at 395 nm, 339 nm and 292 nm. The peak at 395 nm corresponds to the lowest excited state (S1), with an excited energy of 3.14 eV. The equilibrium geometry of the S1 energy surface was obtained by TDDFT optimization. With TPPE in this geometry, the energy difference between S1 and S0 is 1.54 eV, which corresponds to a fluorescence wavelength of 803 nm. Energy this low means that the fluorescence of TPPE is likely to be very weak due to strong nonradiative relaxation. Moreover, the equilibrium geometry of S1 is quite different from that of the ground state, such that in S1 the phenyl rings have rotated 26° (corresponding to the α in Fig. 2a), and the ethylenic CC bond has twisted about 45° with respect to S0 (corresponding to the β in Fig. 2a). The active intramolecular rotations of these bonds consume the energy of the excited state through nonradiative decay and result in fluorescence quenching, as confirmed by experiments.14,19
 | ||
| Fig. 1 The molecular structure of TPPE (a) and its simulated absorption spectrum in CH2Cl2 (b), and the transition orbital energies with wavefunctions of the lowest excited state S1 based on the equilibrium geometries of the ground state S0 (c) and S1 (d), respectively. Here HOMO (LUMO) represents the highest occupied molecular orbital (lowest unoccupied molecular orbital). | ||
 | ||
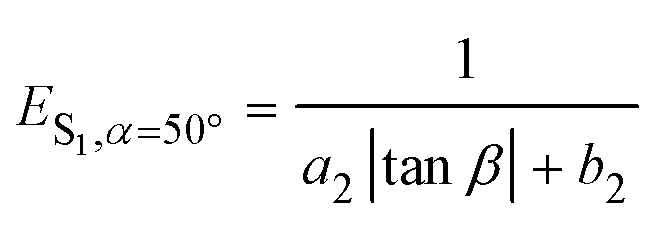
| Fig. 2 Two dihedral angles: α and β (a), defined by the four atoms in the center colored blue (red arrow indicates the rotation of the corresponding bond). Emission ability (reflected by transition oscillator strength) versus wavelength for TPPE with α (b) and β (c) varying from 0° to 80° respectively (the detailed data are shown in Table S2, ESI†). Plots of emission energy from the lowest excited state (S1) of TPPE versus α (d) and β (e) varying from 0° to 120°. | ||
The planarity of TPPE was abrogated by adjusting either of two dihedral angles: α or β (Fig. 2a). The angle α represents any of the four dihedral angles which reflect rotation of a given phenyl ring; these dihedral angles are almost equal due to the nearly perfect molecular symmetry. The angle β reflects the rotation of the ethylenic CC bond. In the optimized structure of S0, α is 50.0° and β is 12.8°. As we varied α from 0° to 80° with β at its optimized value in S0, then optimized the geometries at S1 with fixed α and β, the α-dependent fluorescent properties were investigated, and the β-dependent fluorescent properties were obtained in an analogous way. As shown in Fig. 2b and c, the emission wavelength blue-shifts from 730 nm to 350 nm with increasing α, while it red-shifts from 450 nm to 1250 nm with increasing β. Thus the deviations from planarity of TPPE determine its peak fluorescence wavelength as we predicted. Importantly, the range in emission wavelength is wide, exceeding the whole range of visible light. Thus there is great potential to exploit further the fluorescence properties of this molecule.
To further determine the relationship between emission properties and deviations from molecular planarity, we carried out calculations for a greater range of angles. According to the above discussions, the emission energy from S1 increases as α increases from 0° to 80°. However, when α increases beyond 90°, the energy begins to decrease (see Fig. 2d). So the emission energy from S1 was fitted to sin2![[thin space (1/6-em)]](https://www.rsc.org/images/entities/char_2009.gif) α, achieving an R-square as high as 0.992 (see Fig. S2, ESI†). The function obtained is
α, achieving an R-square as high as 0.992 (see Fig. S2, ESI†). The function obtained is
| ES1,β=12.8° = a1sin2α + b1 | (1) |
 | (2) |
Combining eqn (1) with eqn (2), the emission energy from S1 can be written as
 | (3) |
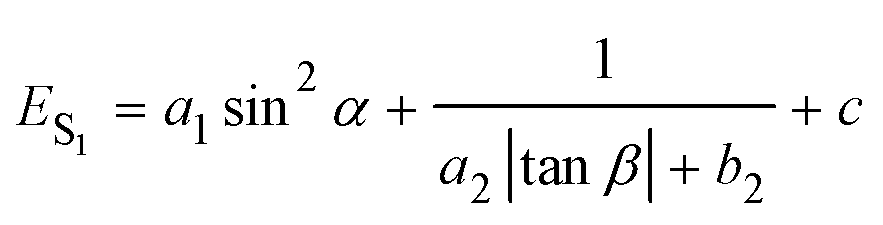
The property of TPPE that intramolecular rotations change fluorescence performances is similar to the twisted intramolecular charge transfer (TICT) phenomenon.33–35 In the case of β, the emission wavelength red-shifts and the intensity (reflected by transition oscillator strength) is weakened with the twisting of the CC bond (the increasing β) (Fig. 2c), which looks like the TICT phenomenon. However, TPPE does not exhibit an appreciable intramolecular charge transfer property in both S0 and S1, even in an extremely twisted configuration (Fig. S5, ESI†), indicating that its mechanism is completely different from TICT. Moreover, the phenomenon of α is inconsistent with TICT. Therefore, the TICT mechanism may not be applicable to TPPE, and we will clarify the mechanism through the electron wavefunction distribution. The molecule TPPE can be divided into two regions: a central group—including the ethylenic CC double bond—and a circumjacent group—including the four pyridylphenyls. The HOMO electronic wavefunction distribution shifts in opposite directions depending on whether α (Fig. 3a) or β (Fig. 4a) is varied. The wavefunction shifts outward from the central to the circumjacent region with increasing α (Fig. 3c) but becomes more centralized as β is increased (Fig. 4c). Shifts in the LUMO distribution behave similarly (Fig. 3c and 4c). These trends are in line with the excitation energy of S1. It can be concluded that a more-centralized wavefunction lowers the excitation energy (in nm), as a result both of the increase in HOMO energy and the decrease in LUMO energy associated with the more centralized charge at smaller α (Fig. S6, ESI†). This phenomenon can be attributed to the interaction between groups. As α increases, the adjacent two phenyls approach a “face to face” configuration, which strengthens the π–π interactions between them. Conversely, molecular orbitals delocalized on the circumjacent groups become merged into the central group as β increases, weakening the π–π interactions between circumjacent groups.
 | ||
| Fig. 3 The percentage contributions to the HOMO (a) and LUMO (b) of TPPE made by the central ethylenic CC group (red) and the other circumjacent groups (blue) as a function of α, and the spatial distribution of the HOMO and LUMO wavefunctions when α takes the values of 0°, 30°, 60° and 80° (c). | ||
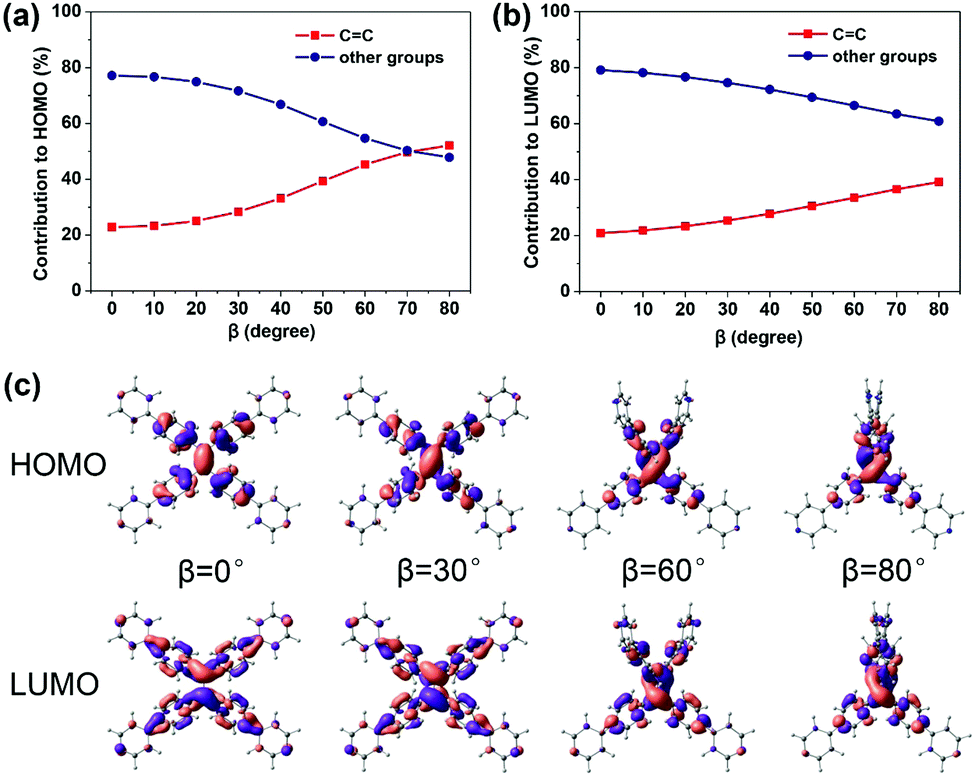 | ||
| Fig. 4 The percentage contributions to the HOMO (a) and LUMO (b) of TPPE made by the central ethylenic CC group (red) and the other circumjacent region groups (blue) as a function of β, and the spatial distribution of the HOMO and LUMO wavefunctions when β takes the values of 0°, 30°, 60° and 80° (c). | ||
To reveal the solvent effects, we simulated the absorption spectra of TPPE in various solvents. As shown in Fig. 5a, the absorption of TPPE in different solvents occur at similar wavelengths (change from 393.7 nm to 396.9 nm), as well as the molecular structures at S0 (Table S4, ESI†). As shown in Fig. 5b, the absorption of TPPE in different solvents occurs at similar wavelengths (change from 393.7 nm to 396.9 nm), as well as the molecular structures at S0 (Table S4, ESI†). As shown in Fig. 5b, the size of β at S1 increases with increasing solvent dielectric constant, and α is changed very little (less than 0.5°, Table S5, ESI†). More importantly, emission wavelength varies with dielectric constant in nearly the same way as β (Fig. 5b). Therefore, a polar environment tends to reduce molecular planarity and red-shifts the emission wavelength for monomer TPPE. Nevertheless, the molecular planarity and emission wavelength of TPPE are affected by solvents to a small degree (α changes from 24.0° to 23.6°, β changes from 55.0° to 57.8°, emission wavelength change from 763.5 nm to 802.7 nm). This indicates that the influence of solvent on a TPPE monomer is not prominent. However, it should be noted that the configurational change is significant from S0 to S1 for monomer TPPE (Tables S4 and S5, ESI†). In the case of CH2Cl2, α changes from 49.9° to 23.6° and β changes from 12.8° to 57.5°. An external physical confinement (such as aggregation) will restrict the intramolecular rotations, thus the configuration change from S0 to S1 will not be comparable with that in the monomer. Owing to these restrained factors on structures, the emission wavelength of TPPE is estimated to range from 450 nm to 800 nm (450 nm is calculated by eqn (3) substituting the values of α and β in the S0 configuration; 800 nm is the emission wavelength of monomer TPPE as shown in Fig. 1d), and this range can be further narrowed to 450–640 nm considering that β is difficult to change in the aggregated state (640 nm is calculated by eqn (3) assuming that α is 23.6° and β keeps the S0 value of 12.8°). The estimated emission wavelength range covers all of the experimental values (∼530 nm when TPPE is coordinated with Hg2+ and HSO4−,14 450–560 nm when it is incorporated into Pt(II) metallacages,19 and ∼465 nm when it is in a poor solvent36) and validates our assumption. Similarly, one can predict the fluorescence wavelength range of TPPE in experiments more accurately if there is more specific structural information. In general, the stronger physical confinement results in the excited configuration being closer to the S0 configuration and shorter emission wavelength. Consequently, the wide range of emission wavelength of TPPE in different solvents19 is fundamentally due to the deviations from molecular planarity in the excited state, as a consequence of solvent-induced specific aggregation behaviors which lead to different physical confinements. However, how the solvent affects the molecular aggregation behavior is still unknown and it is difficult to describe by quantum chemical calculations because it is computationally enormous. We will make efforts in this direction in future research.
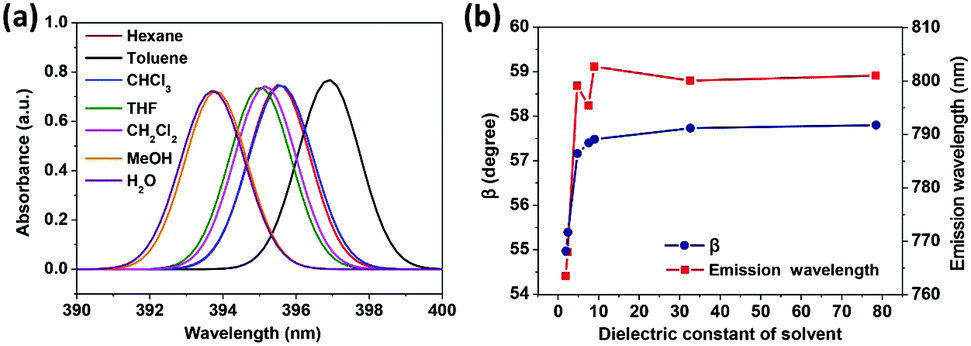 | ||
| Fig. 5 (a) Computed absorption spectra of TPPE in various solvents. (b) Plots of β and the emission wavelength versus dielectric constant of the solvent (the detailed data and α are shown in Table S5, ESI†). | ||
In summary, we have revealed the primary cause of the variable-wavelength emission of TPPE—the deviations from molecular planarity which affects group interactions and leads to molecular orbital wavefunction redistribution, with a more-centralized wavefunction resulting in a lower emission energy. Mathematical expressions were presented to describe the relationship between emission wavelength (the emission energy) and molecular configuration, which can be applied to other TPE derivatives, providing a simple and convenient way to predict the emission wavelength. In addition, we expect that solvent-induced aggregation can affect the physical confinement on molecular planarity in the excited state and cause different emission colors, which will be the direction in our future research.
Conflicts of interest
There are no conflicts of interest to declare.Acknowledgements
This work was financially supported by the National Basic Research Program of China (973 Program, No. 2014CB848900), the National Natural Science Foundation of China (No. 21633006, 21473166), and the CAS Strategic Priority Research Program B (No. XDB01020000).References
- S. H. Alamudi, R. Satapathy, J. Kim, D. Su, H. Ren, R. Das, L. Hu, E. Alvarado-Martínez, J. Y. Lee, C. Hoppmann, E. Peña-Cabrera, H.-H. Ha, H.-S. Park, L. Wang and Y.-T. Chang, Nat. Commun., 2016, 7, 11964 CrossRef CAS PubMed.
- L. Xue, E. Prifti and K. Johnsson, J. Am. Chem. Soc., 2016, 138, 5258–5261 CrossRef CAS PubMed.
- A. Dutta, D. Dutta, P. Sanpui and A. Chattopadhyay, Chem. Commun., 2017, 53, 1277–1280 RSC.
- X. Dai, Z. Zhang, Y. Jin, Y. Niu, H. Cao, X. Liang, L. Chen, J. Wang and X. Peng, Nature, 2014, 515, 96–99 CrossRef CAS PubMed.
- Q.-W. Zhang, D. Li, X. Li, P. B. White, J. Mecinović, X. Ma, H. Ågren, R. J. M. Nolte and H. Tian, J. Am. Chem. Soc., 2016, 138, 13541–13550 CrossRef CAS PubMed.
- M. Kasha, Discuss. Faraday Soc., 1950, 9, 14–19 RSC.
- S. Tretiak and S. Mukamel, Chem. Rev., 2002, 102, 3171–3212 CrossRef CAS PubMed.
- Y. Hong, J. W. Lam and B. Z. Tang, Chem. Commun., 2009, 4332–4353 RSC.
- B. Yang, Q. Zhang, J. Zhong, S. Huang and H.-X. Zhang, Synth. Met., 2012, 162, 670–676 CrossRef CAS.
- B.-B. Xie, X.-Y. Liu, Q. Fang, W.-H. Fang and G. Cui, J. Phys. Chem. Lett., 2017, 8, 1019–1024 CrossRef CAS PubMed.
- Y.-J. Cho, S.-Y. Kim, M. Cho, W.-S. Han, H.-J. Son, D.-W. Cho and S. O. Kang, Phys. Chem. Chem. Phys., 2016, 18, 9702–9708 RSC.
- Y. Zhang, D. Li, Y. Li and J. Yu, Chem. Sci., 2014, 5, 2710–2716 RSC.
- Z. Zhao, J. W. Y. Lam and B. Z. Tang, J. Mater. Chem., 2012, 22, 23726–23740 RSC.
- G. Huang, G. Zhang and D. Zhang, Chem. Commun., 2012, 48, 7504–7506 RSC.
- J. Mei, N. L. C. Leung, R. T. K. Kwok, J. W. Y. Lam and B. Z. Tang, Chem. Rev., 2015, 115, 11718–11940 CrossRef CAS PubMed.
- W. Yang, C. Li, M. Zhang, W. Zhou, R. Xue, H. Liu and Y. Li, Phys. Chem. Chem. Phys., 2016, 18, 28052–28060 RSC.
- M. Zhang, G. Feng, Z. Song, Y.-P. Zhou, H.-Y. Chao, D. Yuan, T. T. Tan, Z. Guo, Z. Hu and B. Z. Tang, J. Am. Chem. Soc., 2014, 136, 7241–7244 CrossRef CAS PubMed.
- N. B. Shustova, B. D. McCarthy and M. Dinca, J. Am. Chem. Soc., 2011, 133, 20126–20129 CrossRef CAS PubMed.
- X. Yan, T. R. Cook, P. Wang, F. Huang and P. J. Stang, Nat. Chem., 2015, 7, 342–348 CrossRef CAS PubMed.
- D. Robinson, N. A. Besley, P. O’Shea and J. D. Hirst, J. Phys. Chem. B, 2011, 115, 4160–4167 CrossRef CAS PubMed.
- R. Hu, E. Lager, A. Aguilar-Aguilar, J. Liu, J. W. Lam, H. H. Sung, I. D. Williams, Y. Zhong, K. S. Wong and E. Pena-Cabrera, J. Phys. Chem. C, 2009, 113, 15845–15853 CAS.
- M. J. Frisch, G. W. Trucks, H. B. Schlegel, G. E. Scuseria, M. A. Robb, J. R. Cheeseman, G. Scalmani, V. Barone, B. Mennucci, G. A. Petersson, H. Nakatsuji, M. Caricato, X. Li, H. P. Hratchian, A. F. Izmaylov, J. Bloino, G. Zheng, J. L. Sonnenberg, M. Hada, M. Ehara, K. Toyota, R. Fukuda, J. Hasegawa, M. Ishida, T. Nakajima, Y. Honda, O. Kitao, H. Nakai, T. Vreven, J. A. Montgomery Jr., J. E. Peralta, F. Ogliaro, M. J. Bearpark, J. Heyd, E. N. Brothers, K. N. Kudin, V. N. Staroverov, R. Kobayashi, J. Normand, K. Raghavachari, A. P. Rendell, J. C. Burant, S. S. Iyengar, J. Tomasi, M. Cossi, N. Rega, N. J. Millam, M. Klene, J. E. Knox, J. B. Cross, V. Bakken, C. Adamo, J. Jaramillo, R. Gomperts, R. E. Stratmann, O. Yazyev, A. J. Austin, R. Cammi, C. Pomelli, J. W. Ochterski, R. L. Martin, K. Morokuma, V. G. Zakrzewski, G. A. Voth, P. Salvador, J. J. Dannenberg, S. Dapprich, A. D. Daniels, Ö. Farkas, J. B. Foresman, J. V. Ortiz, J. Cioslowski and D. J. Fox, Gaussian 09, Revision D.01, Gaussian, Inc., Wallingford, CT, USA, 2016 Search PubMed.
- R. O. Jones, Rev. Mod. Phys., 2015, 87, 897–923 CrossRef.
- A. D. Becke, J. Chem. Phys., 1993, 98, 5648–5652 CrossRef CAS.
- A. D. Becke, Phys. Rev. A: At., Mol., Opt. Phys., 1988, 38, 3098 CrossRef CAS.
- C. Lee, W. Yang and R. Parr, Phys. Rev. A: At., Mol., Opt. Phys., 1988, 38, 3098 CrossRef.
- B. Mennucci, J. Tomasi, R. Cammi, J. R. Cheeseman, M. J. Frisch, F. J. Devlin, S. Gabriel and P. J. Stephens, J. Phys. Chem. A, 2002, 106, 6102–6113 CrossRef CAS.
- C. Adamo and D. Jacquemin, Chem. Soc. Rev., 2013, 42, 845–856 RSC.
- G. Vignale, Phys. Rev. A: At., Mol., Opt. Phys., 2008, 77, 062511 CrossRef.
- C. Adamo and V. Barone, J. Chem. Phys., 1999, 110, 6158–6169 CrossRef CAS.
- R. S. Mulliken, J. Chem. Phys., 1955, 23, 1833–1840 CrossRef CAS.
- B. Nebgen and O. V. Prezhdo, J. Phys. Chem. A, 2016, 120, 7205–7212 CrossRef CAS PubMed.
- Z. R. Grabowski and K. Rotkiewicz, Chem. Rev., 2003, 103, 3899–4032 CrossRef PubMed.
- M. Segado, Y. Mercier, I. Gómez and M. Reguero, Phys. Chem. Chem. Phys., 2016, 18, 6875–6884 RSC.
- D. Escudero, Acc. Chem. Res., 2016, 49, 1816–1824 CrossRef CAS PubMed.
- P. P. Kapadia, J. C. Widen, M. A. Magnus, D. C. Swenson and F. C. Pigge, Tetrahedron Lett., 2011, 52, 2519–2522 CrossRef CAS.
Footnote |
| † Electronic supplementary information (ESI) available. See DOI: 10.1039/c7cp06643k |
| This journal is © the Owner Societies 2018 |