Support effect of Mn-based catalysts for gaseous elemental mercury oxidation and adsorption
Yinghong
Wu
ab,
Wenqing
Xu
 *ac,
Yang
Yang
ab,
Jian
Wang
a and
Tingyu
Zhu
*ac
aBeijing Engineering Research Centre of Process Pollution Control, Institute of Process Engineering, Chinese Academy of Sciences, Beijing 100190, PR China. E-mail: wqxu@ipe.ac.cn; Fax: +86 10 82544822; Tel: +86 10 82544823
bUniversity of Chinese Academy of Sciences, Beijing 100049, PR China
cCenter for Excellence in Regional Atmospheric Environment, Institute of Urban Environment, Chinese Academy of Sciences, Xiamen 361021, China
First published on 20th November 2017
Abstract
Mn-Based catalysts with a Mn loading of 4 wt% were prepared using an impregnation method. Their Hg0 removal efficiencies were in the following order: 4% Mn/MK10 (montmorillonite K 10) > 4% Mn/SiO2 > 4% Mn/TiO2 > 4% Mn/Al2O3. Results from various characterization techniques, such as BET, XRD, STEM, H2-TPR, Hg0-TPD and XPS, suggested that the species, morphologies, and distributions of MnOx led to the different performances in Hg0 removal. The support effect on Hg0 adsorption and oxidation was studied. For 4% Mn/Al2O3 and 4% Mn/SiO2, physical adsorption dominates Hg0 removal at low temperature (150 °C), while chemical adsorption is more important at high temperature (350 °C). At both low and high temperatures, chemical adsorption and oxidation play leading roles in 4% Mn/TiO2 and 4% Mn/MK10, respectively. The effect of MnOx species and their morphologies on Hg0 oxidation was investigated. Amorphous MnO2 benefits Hg0 oxidation at both low and high temperatures, while amorphous Mn2O3 only facilitates Hg0 oxidation at high temperature. Hg0 oxidation on Mn-based catalysts follows a Mars–Maessen mechanism where the lattice oxygen of MnOx reacts with the absorbed Hg0.
1. Introduction
Mercury emission from coal-fired flue gas is a hazardous atmospheric pollutant. Elemental mercury (Hg0), the primary mercury component in the gaseous phase, is especially hard to remove due to its high vapor pressure and low water solubility.1,2 Numerous efforts have been made to remove gaseous Hg0, with adsorption and catalytic oxidation methods being considered the most effective ones.3,4 Many previous studies focused more on Hg0 removal than Hg0 oxidation, principally because most of the used materials were adsorbents rather than catalysts.5–10 Nevertheless, some shortcomings, such as the limited adsorption capacity and high energy consumption for regeneration, limit the development of adsorbents. In contrast, catalysts are much more selective and recyclable than adsorbents, and therefore, catalytic oxidation is a more promising method to remove Hg0.There have been some reports on Hg0 oxidation in recent years.11–18 Among the most promising materials, transition metal oxides have been extensively studied.13–18 Manganese oxide (MnOx), which has multiple oxidation states and can participate in various redox reactions, is particularly conducive to Hg0 oxidation.16–18 Yang et al.19 reported that the Mn4+ active sites played an important role in Hg0 oxidation over Fe–Mn spinel catalysts. Li et al.20 found that the dominance of Mn4+ on the Mn–Ce/Ti catalyst was mainly responsible for its excellent catalytic performance. Moreover, several studies have shown that it is the amorphous or poorly crystalline Mn4+ that is beneficial to Hg0 oxidation.21–23 That is, the species and morphologies of MnOx can significantly influence the Hg0 oxidation performance.
According to Cimino's study,24 Mn/TiO2 showed a much better Hg0 capture efficiency than Mn/Al2O3, because of the higher proportion of Mn4+ sites on TiO2. This means that the valence and content of active components could be strongly affected by the supports. Results from Zhang et al.25 and Ding et al.26 also suggest the potential influence of supports on the active components, which eventually affects the Hg0 adsorption or oxidation. Therefore, a suitable support is vital for effectively controlling the species and morphologies of MnOx, and further promoting Hg0 adsorption and oxidation.
Montmorillonite, a common Si–Al-based mineral that is widely used in adsorption and catalysis fields (such as the removal of VOCs,27,28 CO2,29,30 and SO2 (ref. 31)), has barely been used in Hg0 removal. Our previous work has proved the Hg0 removal ability of Mn/MK10 (montmorillonite K 10) in flue gas.32 The characteristics of MK10, such as layered structure, porosity, high surface acidity, and excellent thermal stability, all facilitate Hg0 adsorption and oxidation.33 In the present work, we further demonstrate that Mn/MK10 has much better Hg0 removal performance than Mn/TiO2, Mn/Al2O3, and Mn/SiO2. However, both SiO2 and Al2O3 are also the primary components of MK10, and TiO2 is often employed as an efficacious support for Hg0 removal. Therefore, here we focus on the effects of various supports on Mn-based catalysts for Hg0 adsorption and oxidation, and provide new theories for developing Hg0 removal materials.
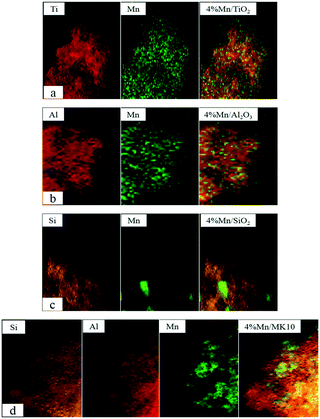
In this work, Mn-based catalysts were prepared using an impregnation method. The Hg0 adsorption and oxidation performances over Mn/MK10 in the temperature range of 100–400 °C were compared with those over Mn/TiO2, Mn/Al2O3, and Mn/SiO2. The species and morphologies of MnOx over various Mn-based catalysts were analyzed by the Brunauer–Emmett–Teller (BET), X-ray diffraction (XRD), high-angle annular dark-field scanning transmission electron microscopy (HAADF-STEM), hydrogen temperature-programmed reduction (H2-TPR), Hg temperature-programmed desorption (Hg-TPD), and X-ray photoelectron spectroscopy (XPS) methods in order to clarify the support effect and the Hg0 oxidation mechanism.
2. Experimental
2.1. Catalyst preparation
Mn-Based catalysts with a Mn loading of 4 wt% were synthesized using an impregnation method. Briefly, requisite quantities of Mn(NO3)2 precursor and supports (TiO2, Al2O3, SiO2, or MK10) were homogeneously mixed in deionized water and stirred at 25 °C for 4 h. Then, excess water in the mixtures was evaporated at 55 °C using a rotary evaporator, and the obtained solid was dried at 110 °C for 12 h and then calcined at 425 °C for 4 h. The obtained samples were crushed and sieved through 60–80 mesh (180–250 μm) screens to test the catalytic activity.2.2. Catalyst characterization
The specific surface areas and pore volumes were measured by N2 adsorption in an automatic porosity analyzer (Autosorb-iQ, Quantachrome). Samples were subjected to XRD using a Rigaku D/Max-RA powder diffractometer with Cu Kα radiation to obtain XRD patterns. HAADF-STEM images were collected on an FEI Tecnai G2 F20 field emission electron microscope. Before the H2-TPR test, the catalyst was degassed in Ar at 300 °C for 1 h. After cooling to room temperature (RT), the catalyst was heated from RT to 600 °C at a ramp of 10 °C min−1 in a flow of 10% H2/Ar. XPS measurement was performed on an ESCALAB 250Xi system using an Al Kα source.Prior to the Hg-TPD tests, 0.05 g of the catalyst was first exposed to the simulated gas containing 120.0 μg m−3 Hg0 at either 150 °C or 350 °C for 2 h. Then, the catalyst was purged with N2 at a flow rate of 500 mL min−1 at 100 °C. When the Hg0 concentration at the outlet was reduced to zero, the catalyst was heated from 100 °C to 700 °C in pure N2 at a heating rate of 10 °C min−1.
2.3. Catalyst activity test
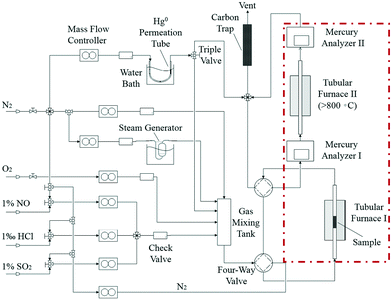
Catalyst activity tests were carried out with 0.05 g of sample in a fixed-bed quartz tube reactor (Fig. 1) that is 4 mm in inner diameter. An Hg0 permeation tube was used to generate a gas containing 120.0 μg m−3 Hg0 with a balance of N2. The simulated flue gas (Hg0 + 5% O2 + N2: the conditions from Fig. 3 to 5) was introduced into the reactor at the steady state. To prevent Hg0 deposition on the inner surface, all lines through which Hg0 passed were heated to 90 °C. Lumex RA915M Zeeman mercury analyzers were used to continuously monitor Hg0 concentration, and a mercury concentration mass balance was conducted before each test. The total gas flow rate, space velocity, and steady reaction time were 500 mL min−1, 478![[thin space (1/6-em)]](https://www.rsc.org/images/entities/char_2009.gif) 000 h−1, and 10 h, respectively. As shown in Fig. 1, the red dashed box includes two tubular furnaces and two mercury analyzers, the corresponding details of which are shown in Fig. 2. The gaseous Hg0 concentration after passing through the catalyst was detected using mercury analyzer I. The sum of the gaseous Hg0 and Hg2+ concentrations, detected using mercury analyzer II, was obtained by heating the outlet mixed gas to 800 °C in tubular furnace II after passing through mercury analyzer I. Therefore, the total Hg0 removal, oxidation, and adsorption efficiencies (ηcap, ηoxi, and ηads, respectively) are calculated as follows:
000 h−1, and 10 h, respectively. As shown in Fig. 1, the red dashed box includes two tubular furnaces and two mercury analyzers, the corresponding details of which are shown in Fig. 2. The gaseous Hg0 concentration after passing through the catalyst was detected using mercury analyzer I. The sum of the gaseous Hg0 and Hg2+ concentrations, detected using mercury analyzer II, was obtained by heating the outlet mixed gas to 800 °C in tubular furnace II after passing through mercury analyzer I. Therefore, the total Hg0 removal, oxidation, and adsorption efficiencies (ηcap, ηoxi, and ηads, respectively) are calculated as follows:| ηcap = [(Hg0inlet − Hg0outlet1)/Hg0inlet] × 100% | (1) |
| ηoxi = [(Hg0outlet2 − Hg0outlet1)/Hg0inlet] × 100% | (2) |
| ηads = ηcap − ηoxi | (3) |
3. Results and discussion
3.1. Activity tests
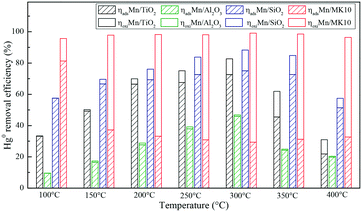
A series of activity tests were carried out to examine the ratio of removed Hg0 to inlet Hg0 over 600 min at different temperatures over various Mn-based catalysts. Fig. 3(a) shows the ratio at various temperatures over pure supports (TiO2, Al2O3, SiO2, and MK10), with all the values below 10%. In particular, no removed Hg0 was observed over the SiO2 support owing to its inert characteristics. Adding 4 wt% of Mn significantly enhanced the Hg0 removal performance of all the supports. As shown in Fig. 3(b), increasing the temperature from 100 °C to 300 °C increased the Hg0 removal ability of Mn/TiO2, Mn/Al2O3, and Mn/SiO2 catalysts. However, further increasing the temperature to 400 °C reduced the ratio. In the case of Mn/MK10, the Hg0 removal performance is relatively high and stable across the whole temperature range. Moreover, the ratio of the four Mn-based catalysts can be ordered as follows: 4% Mn/MK10 > 4% Mn/SiO2 > 4% Mn/TiO2 > 4% Mn/Al2O3, demonstrating that the interactions between the active component and different supports are all different, even with the same loading of Mn.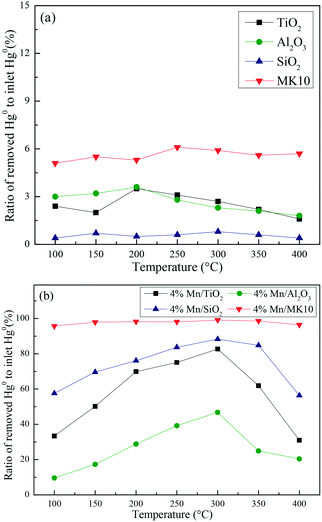 | ||
| Fig. 3 The ratio of removed Hg0 to inlet Hg0 over 600 min at different temperatures over (a) various pure supports and (b) various Mn-based catalysts. | ||
To further illustrate the differences among these Mn-based catalysts, the Hg0 oxidation and adsorption performances at various temperatures were examined. In particular, at the representative temperature of 350 °C, two obvious lines representing Hg0 breakthrough curves were detected for all four catalysts, where the blue and red lines represent Hg0outlet1 and Hg0outlet2, respectively (Fig. 4). Correspondingly, the areas marked with vertical lines, blanks, and oblique lines represent the adsorbed mercury on the catalyst, gaseous Hg2+, and gaseous Hg0, respectively, in order to estimate the proportions of Hg0 adsorption and Hg0 oxidation. The results are summarized in Fig. 5. In the proportions of Hg0 adsorption (slash column) and Hg0 oxidation (blank column) from 100 °C to 400 °C in Fig. 5, the difference details of these catalysts are much clearer. On the one hand, Hg0 removal on 4% Mn/Al2O3 mainly depends on adsorption. For 4% Mn/TiO2 and 4% Mn/SiO2, although there is a small degree of Hg0 oxidation at high temperature, adsorption dominates the overall Hg0 removal. In the case of 4% Mn/MK10, however, Hg0 oxidation plays the main role, as >60% of the Hg0 is oxidized when reacting at above 150 °C. On the other hand, the efficiencies of both Hg0 adsorption and Hg0 oxidation are improved when the temperature is increased from 100 °C to 300 °C (low-temperature window), while these efficiencies decrease with further increase in the temperature from 300 °C to 400 °C (high-temperature window) for Mn/TiO2, Mn/Al2O3, and Mn/SiO2. Therefore, in the following experiments, 150 °C and 350 °C were selected to represent the low- and high-temperature windows, respectively. A series of characterization methods, including BET, XRD, STEM, and H2-TPR, were used to analyze the species, morphologies, and distributions of MnOx over various Mn-based catalysts.
3.2. Species and morphologies of MnOx over Mn-based catalysts
| Sample | TiO2 | Al2O3 | SiO2 | MK10 |
|---|---|---|---|---|
| BET (m2 g−1) | 71.7 | 167.4 | 372.5 | 64.2 |
| V pore (cm3 g−1) | 0.23 | 0.56 | 0.74 | 0.11 |
| Sample | 4% Mn/TiO2 | 4% Mn/Al2O3 | 4% Mn/SiO2 | 4% Mn/MK10 |
|---|---|---|---|---|
| BET (m2 g−1) | 67.4 | 169.9 | 333.4 | 88.4 |
| V pore (cm3 g−1) | 0.22 | 0.53 | 1.36 | 0.14 |
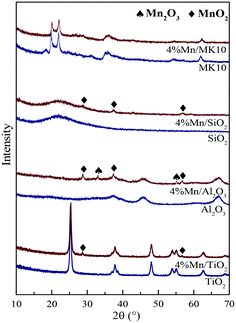
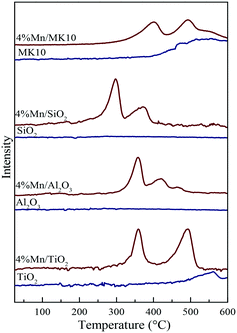
Fig. 8 also shows the H2-TPR results of various Mn-based catalysts as red lines. Two distinct reduction characteristic peaks were observed in Mn/TiO2, Mn/SiO2, and Mn/MK10. Basically, these peaks at low and high temperatures were attributed to the reduction from Mn4+ to Mn3+ and Mn3+ to Mn2+, respectively.24,42 It is worth noting that there are some differences in the peak positions for the Mn-based catalysts. Firstly, three reduction characteristic peaks appeared on 4% Mn/Al2O3. The intermediate peak might result from the conversion from Mn3+ (Mn2O3) to Mn8/3+ (Mn3O4),43 as the XRD results showed the existence of crystalline Mn3+. Therefore, these three reduction peaks on 4% Mn/Al2O3 correspond to the reduction from MnO2 to Mn2O3, Mn2O3 to Mn3O4, and Mn3O4 to MnO. Secondly, the characteristic peaks in 4% Mn/SiO2 were apparently lower in temperature than those in other Mn-based catalysts, but were similar to pure MnOx in other literature studies.44,45 This is primarily ascribed to the poor interaction between MnOx and SiO2. Consequently, the peaks at lower temperatures are caused by the existence of independent MnOx. In other words, the H2-TPR result of 4% Mn/SiO2 shows the reduction peak of MnOx, and is hardly related to the SiO2 support.
It is known that calculating the TOF (turnover frequency) of the catalyst is a useful method to find out the best catalytic system among various catalysts. In this study, the TOFs of the four Mn-based catalysts at different temperatures (150 °C or 350 °C) were calculated. The H2 consumption and Mn dispersion of each Mn-based catalyst can be easily determined by comparing the H2-TPR areas of the catalysts and the quantitative reference material (pure CuO). Therefore, the TOFs of these catalysts were calculated and are summarized in Table 2. As shown in Table 2, the TOFs (s−1) of Mn/MK10 are tens or even hundreds of times higher than those of the other three catalysts, indicating that Mn/MK10 is the best catalytic system among these catalysts. Additionally, the orders of TOFs at both 150 °C and 350 °C are the same as the orders of Hg0 removal efficiencies over these catalysts, which illustrates that the order of the TOFs is meaningful data to determine the ability of Hg0 oxidation among various catalysts.
| 4% Mn/TiO2 | 4% Mn/Al2O3 | 4% Mn/SiO2 | 4% Mn/MK10 | |
|---|---|---|---|---|
| 150 °C | 4.25 × 10⁻¹⁴ | 3.34 × 10⁻¹⁴ | 1.25 × 10⁻¹³ | 2.47 × 10⁻¹² |
| 350 °C | 6.98 × 10⁻¹³ | 2.92 × 10⁻¹⁴ | 5.02 × 10⁻¹³ | 2.73 × 10⁻¹² |
3.3. Support effect on Hg0 adsorption and oxidation
To comprehensively investigate the support effect on Hg0 oxidation and adsorption on the various Mn-based catalysts, Hg-TPD tests were performed after reaction at different temperatures, and the results are shown in Fig. 9 (blue lines: reacted at 150 °C, red lines: reacted at 350 °C).To qualitatively analyze Hg0 oxidation and adsorption and to further prove the production of gaseous Hg2+ on the various Mn-based catalysts, Table 3 summarizes the contents of Hg0 removed and desorbed before and after Hg-TPD tests. Before the tests, the catalysts were first exposed to simulated gas with 120.0 μg m−3 Hg0 for 2 h. Thus, the inlet content of Hg0 is 240.0 μg h m−3. The content of removed Hg0 (A) is the difference between the inlet and the remaining contents of Hg0 during the Hg0 removal process. The adsorbed Hg0 on the catalyst is gradually desorbed with the temperature increasing from 100 °C to 700 °C during the Hg-TPD tests. Thus, the content of desorbed Hg0 (B) is the integral of the desorbed Hg0 concentration during the Hg-TPD tests. Therefore, the difference between A and B can be regarded as the content of gas-phase Hg2+ (C) produced during the Hg0 removal process. In this case, qualitative rather than quantitative analysis of the table data is appropriate.
| After reaction at 150 °C | After reaction at 350 °C | |||||
|---|---|---|---|---|---|---|
| (μg h m−3) | A | B | C | A | B | C |
| 4% Mn/TiO2 | 186.4 | 186.4 | 0 | 198.7 | 157.5 | 41.2 |
| 4% Mn/Al2O3 | 16.6 | 16.6 | 0 | 166.4 | 166.4 | 0 |
| 4% Mn/SiO2 | 118.2 | 118.2 | 0 | 209.3 | 145.8 | 33.5 |
| 4% Mn/MK10 | 231.5 | 24.7 | 206.8 | 234.6 | 4.7 | 229.9 |
As shown in Fig. 9(a), there are two desorption peaks at 350 °C and 436 °C on 4% Mn/TiO2 after reaction at 150 °C (low temperature), while only one characteristic peak at 437 °C appears after reaction at 350 °C (high temperature). All three peaks are ascribed to adsorbed Hg2+, as the BET surface area of 4% Mn/TiO2 is only 67.4 m2 g−1 in Table 1. The desorption peak of physical adsorption on Mn-based catalysts usually appears at around 200 °C,10,46 meaning that chemical adsorption dominates Hg0 removal at both low and high temperatures on 4% Mn/TiO2. Nevertheless, a small amount of gaseous Hg2+ was formed at 350 °C (Table 3), which means that there is a small degree of Hg0 oxidation at high temperature (consistent with the results in Fig. 5).
As shown in Fig. 9(b), the desorption peak only appears at 210 °C on 4% Mn/Al2O3 after reaction at 150 °C, implying that physical adsorption plays a key role in Hg0 removal. As the reaction temperature increases to 350 °C, the characteristic peaks move to 337 °C and 436 °C. Both peaks are assigned to adsorbed Hg2+, revealing the leading role of chemical adsorption at high temperature over 4% Mn/Al2O3. That is, increasing the reaction temperature from 150 °C to 350 °C can lead to the transformation from physical adsorption into chemical adsorption. Furthermore, there is no formation of gaseous Hg2+ according to both the Hg-TPD results in Table 3 and the efficiency results in Fig. 5. Thus, there is no Hg0 oxidation on 4% Mn/Al2O3.
As shown in Fig. 9(c), 4% Mn/SiO2 displayed two strong desorption peaks at 225–255 °C and 475–485 °C after reaction at different temperatures, which are ascribed to physically adsorbed Hg0 and chemically adsorbed Hg2+, respectively. The changes in the peak intensities and areas are quite obvious when the reaction temperature increases from 150 °C to 350 °C. Consequently, the Hg0 removal mechanisms over 4% Mn/SiO2 are different at different temperatures. Apparently, the reaction at 150 °C is dominated by physical adsorption, since the intensity and area of the lower characteristic peak are much larger than those of the higher characteristic peak.
However, the peak area at 476 °C is much larger when 4% Mn/SiO2 is reacted at 350 °C, so chemical adsorption plays the leading role at high temperature. Besides, a small part of gaseous Hg2+ is formed from comparing the contents of Hg0 removed and desorbed (Table 3), illustrating a small extent of Hg0 oxidation at high temperature, just as the results in Fig. 5.
As shown in Fig. 9(d), the desorption peak at 242 °C after 4% Mn/MK10 was reacted at 150 °C should have been assigned to physical adsorption. In this case, however, it is attributed to the adsorbed Hg2+ instead, because of the excellent Hg0 oxidation ability of 4% Mn/MK10 at 150 °C (Fig. 5) and the small BET surface area (Table 1). With the reaction temperature increasing to 350 °C, the characteristic peak moved to 427 °C while the peak intensity and area decreased. This phenomenon implies that more gaseous Hg2+ is produced at 350 °C, further demonstrating the strong oxidation of Hg0 over 4% Mn/MK10. Combining these results with the data in Table 3, we conclude that catalytic oxidation dominates Hg0 removal on 4% Mn/MK10.
Based on the above discussion, it is obvious that various supports can lead to obviously different Hg0 removal mechanisms. Therefore, the support effect is one of the key factors that can significantly influence Hg0 oxidation and adsorption. More specifically, physical adsorption dominates Hg0 removal at low temperature, while chemical adsorption is more important at high temperature over 4% Mn/Al2O3 and 4% Mn/SiO2. At both temperatures, chemical adsorption and oxidation play the main roles for 4% Mn/TiO2 and 4% Mn/MK10, respectively.
3.4. Effect of species and morphologies of MnOx on Hg0 oxidation
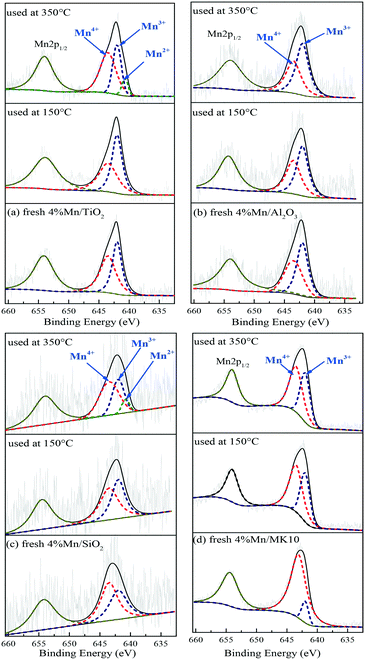
To clarify the change of valence state and the relative proportion of the Mn element on the surface of Mn-based catalysts, XPS was adopted to investigate these catalysts before and after Hg0 removal at 150 °C and 350 °C. The Mn2p results over different catalysts are shown in Fig. 10 and Table 4. Just like other Mn-containing catalysts, the Mn2p region of the catalysts in the present study included Mn2p1/2 with a binding energy of 654.5 eV and Mn2p3/2 with a binding energy of 640–644 eV,47,48 in which the latter can be further fitted to the three peaks at around 640.7, 642.0, and 643.5 eV, corresponding to Mn2+, Mn3+, and Mn4+, respectively.49| Fresh | 150 °C | 350 °C | |||||
|---|---|---|---|---|---|---|---|
| Mn4+ | Mn3+ | Mn4+ | Mn3+ | Mn4+ | Mn3+ | Mn2+ | |
| 4% Mn/TiO2 | 54.4 | 45.6 | 47.1 | 52.9 | 55.2 | 35.4 | 9.4 |
| 4% Mn/Al2O3 | 47.9 | 52.1 | 46.1 | 53.9 | 42.4 | 57.7 | — |
| 4% Mn/SiO2 | 55.7 | 44.3 | 53.5 | 46.5 | 56.2 | 35.0 | 8.8 |
| 4% Mn/MK10 | 88.5 | 11.5 | 58.9 | 41.1 | 57.1 | 42.9 | — |
As shown in Fig. 10(a) and Table 4, the main Mn species in a fresh 4% Mn/TiO2 catalyst are crystalline Mn4+ (54.4%) and amorphous Mn3+ (45.6%). This is similar to the values in 4% Mn/Al2O3 and 4% Mn/SiO2, which contain 47.9% and 55.7% crystalline Mn4+ (Fig. 10(b) and (c)), respectively. However, 88.5% of the Mn was amorphous Mn4+ in 4% Mn/MK10 as seen in Fig. 10(d), being much higher than those for the other three Mn-based catalysts.
After reaction at 150 °C, about 6.9% of the crystalline Mn4+ was converted to Mn3+ on 4% Mn/TiO2, indicating the strong chemical adsorption. In other words, crystalline Mn4+ facilitates the chemical adsorption of Hg0 at low temperature. Meanwhile, there is hardly any conversion of crystalline Mn4+ after reaction at 150 °C on both 4% Mn/Al2O3 and 4% Mn/SiO2, due to the strong physical adsorption at low temperature over these catalysts according to the Hg-TPD results. Furthermore, around 29.6% of the amorphous Mn4+ was reduced to Mn3+ after reaction at 150 °C, revealing the strong Hg0 oxidation performance of 4% Mn/MK10. That is, the high Hg0 oxidation efficiency of 4% Mn/MK10 is ascribed to the large amount of amorphous Mn4+.37,50
After reaction at 350 °C, 31.4% of the amorphous Mn4+ was reduced to Mn3+ in 4% Mn/MK10, also demonstrating the strong Hg0 oxidation ability of amorphous Mn4+ at high temperature. The percentage of amorphous Mn3+ decreased, while that of Mn4+ hardly changed in both 4% Mn/TiO2 and 4% Mn/SiO2. Nevertheless, 9.4% and 8.8% Mn2+ was produced in these two catalysts, respectively, implying the transformation from amorphous Mn3+ into Mn2+. In combination with the Hg0 removal efficiencies and the previous discussions, we conclude that amorphous Mn3+ is good for Hg0 oxidation at high temperature. Besides, the chemical adsorption over 4% Mn/Al2O3 at high temperature is in good agreement with the results in Fig. 10(b) and Table 4 (i.e., about 3.7% of the crystalline Mn4+ was transformed into Mn3+ after reaction at 350 °C).
Therefore, the species and morphologies of MnOx play important roles in Hg0 oxidation. Clearly, amorphous MnO2 is beneficial to Hg0 oxidation and amorphous Mn2O3 is also good for Hg0 oxidation at high temperature, whereas chemical adsorption is mainly promoted by crystalline MnO2.
3.5. Mechanism of Hg0 oxidation
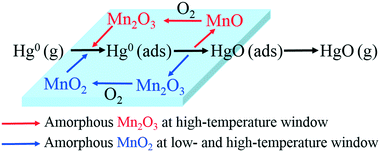
From the above studies, the catalytic mechanism of Hg0 oxidation at different temperature windows can be explained by the Mars–Maessen mechanism. In this mechanism, adsorbed Hg0 would react with the active oxygen atom produced from MnOx to form HgO. Based on the characterization results and discussion, not only the species and the morphologies of MnOx but also the temperature could influence Hg0 oxidation. The Hg0 oxidation mechanism can be explained by the following reactions:| Hg0(g) → Hg0(ads) | (4) |
| Hg0(ads) + 2MnO2 → Hg0(ads) + Mn2O3 | (5) |
| HgO(ads) → HgO(g) | (6) |
| Mn2O3 + 1/2O2(g) → 2MnO2 | (7) |
| Hg0(ads) + Mn2O3 → HgO(ads) + 2MnO | (8) |
| HgO(ads) → HgO(g) | (9) |
| 2MnO + 1/2O2(g) → Mn2O3 | (10) |
Therefore, the overall reaction pathway of Hg0 oxidation can be described as follows: Hg0 is firstly adsorbed on the active sites of Mn-based catalysts to form Hg0 (ads), and then one active oxygen atom is lost from amorphous MnOx to form HgO. The missing lattice oxygen in amorphous MnOx would be replenished by oxygen from the flue gas. Thus, the catalytic oxidation reaction can be carried out continuously.
From all of the above results and discussion, the support effect and Hg0 removal mechanisms over various Mn-based catalysts at different temperatures can be summarized in Fig. 11.
4. Conclusions
The order of Hg0 removal efficiency for various Mn-based catalysts is found to be: 4% Mn/MK10 > 4% Mn/SiO2 > 4% Mn/TiO2 > 4% Mn/Al2O3. The species, morphologies and distributions of MnOx are responsible for the differences in Hg0 removal. The support effects on Hg0 adsorption and oxidation were studied. Physical adsorption dominates Hg0 removal at low temperature, while chemical adsorption is more important at high temperature on 4% Mn/Al2O3 and 4% Mn/SiO2. At both temperatures, chemical adsorption and oxidation play the leading roles in 4% Mn/TiO2 and 4% Mn/MK10, respectively. Furthermore, the effects of the species and morphologies of MnOx on Hg0 oxidation are as follows. Amorphous MnO2 is beneficial to Hg0 oxidation, while amorphous Mn2O3 is only good for Hg0 oxidation at high temperature. A likely reaction pathway for Hg0 oxidation over Mn-based catalysts is the Mars–Maessen mechanism where the lattice oxygen of MnOx reacts with the absorbed Hg0. As a novel Mn-based catalyst with high Hg0 oxidation efficiency, the Mn/MK10 catalyst will be further examined in order to find the origin of its large amount of amorphous MnO2.Conflicts of interest
There are no conflicts to declare.Acknowledgements
This work was supported by the National Key Research and Development Plan (No. 2017YFC0210501) and the Youth Innovation Promotion Association CAS.References
- N. Pirrone, P. Costa, J. M. Pacyna and R. Ferrara, Atmos. Environ., 2001, 35, 2997–3006 CrossRef CAS.
- L. Zhao, C. Li, X. Zhang, G. Zeng, J. Zhang and Y. Xie, Catal. Sci. Technol., 2015, 5, 3459–3472 CAS.
- S. Straube, T. Hahn and H. Koeser, Appl. Catal., B, 2008, 79, 286–295 CrossRef CAS.
- S. Zhao, Y. Ma, Z. Qu, N. Yan, Z. Li, J. Xie and W. Chen, Catal. Sci. Technol., 2014, 4, 4036–4044 CAS.
- J. He, G. K. Reddy, S. W. Thiel, P. G. Smirniotis and N. G. Pinto, Energy Fuels, 2013, 27, 4832–4839 CrossRef CAS.
- M. M. Wiatros-Motyka, C. G. Sun, L. A. Stevens and C. E. Snape, Fuel, 2013, 109, 559–562 CrossRef CAS.
- T. M. Bisson, Z. Xu, R. Gupta, Y. Maham, Y. Liu, H. Yang, I. Clark and M. Pate, Fuel, 2013, 108, 54–59 CrossRef CAS.
- X. Fan, C. Li, G. Zeng, X. Zhang, S. Tao, P. Lu, S. Li and Y. Zhao, Fuel Process. Technol., 2012, 104, 325–331 CrossRef CAS.
- D. Ballestero, C. Gómez-Giménez, E. García-Díezb, R. Juanb, B. Rubiob and M. T. Izquierdob, J. Hazard. Mater., 2013, 260, 247–254 CrossRef CAS PubMed.
- F. Scala, C. Anacleria and S. Cimino, Fuel, 2013, 108, 13–18 CrossRef CAS.
- N. Fernández-Miranda, M. A. Lopez-Anton, M. Díaz-Somoano and M. R. Martínez-Tarazona, Chem. Eng. J., 2016, 285, 77–82 CrossRef.
- S. Zhao, Z. Qu, N. Yan, Z. Li, W. Zhu, J. Pan, J. Xu and M. Li, RSC Adv., 2015, 5, 30841–30850 RSC.
- H. Li, S. Wu, L. Li, J. Wang, W. Ma and K. Shih, Catal. Sci. Technol., 2015, 5, 5129–5138 CAS.
- C. H. Chiu, H. C. His and C. C. Lin, Fuel Process. Technol., 2014, 126, 138–144 CrossRef CAS.
- R. Stolle, H. Koeser and H. Gutberlet, Appl. Catal., B, 2014, 144, 486–497 CrossRef CAS.
- D. Jampaiah, S. J. Ippolito, Y. M. Sabri, J. Tardio, P. R. Selvakannan, A. Nafady, B. M. Reddy and S. K. Bhargava, Catal. Sci. Technol., 2016, 6, 1792–1803 CAS.
- B. Zhao, X. Liu, Z. Zhou, H. Shao and M. Xu, Chem. Eng. J., 2016, 284, 1233–1241 CrossRef CAS.
- D. Jampaiah, S. J. Ippolito, Y. M. Sabri, B. M. Reddy and S. K. Bhargava, Catal. Sci. Technol., 2015, 5, 2913–2924 CAS.
- S. Yang, Y. Guo, N. Yan, D. Wu, H. He, Z. Qu, C. Yang, Q. Zhou and J. Jia, ACS Appl. Mater. Interfaces, 2011, 3, 209–217 CAS.
- H. Li, C. Y. Wu, Y. Li and J. Zhang, Appl. Catal., B, 2012, 111–112, 381–388 CrossRef CAS.
- A. Zhang, Z. Zhang, H. Lu, Z. Liu, J. Xiang, C. Zhou, W. Xing and L. Sun, Ind. Eng. Chem. Res., 2015, 54, 2930–2939 CrossRef CAS.
- C. H. Chiu, H. C. His, H. P. Lin and T. C. Chang, J. Hazard. Mater., 2015, 291, 1–8 CrossRef CAS PubMed.
- Y. Liu, Q. Zhong and X. Liu, J. Hazard. Mater., 2015, 283, 252–259 CrossRef PubMed.
- S. Cimino and F. Scala, Ind. Eng. Chem. Res., 2016, 55, 5133–5138 CrossRef CAS.
- L. Zhang, Y. Zhuo, W. Du, Y. Tao, C. Chen and X. Xu, Ind. Eng. Chem. Res., 2012, 51, 5192–5298 Search PubMed.
- F. Ding, Y. Chun, L. Mi, H. Li, Y. Li and J. Zhang, Ind. Eng. Chem. Res., 2012, 51, 3039–3047 CrossRef CAS.
- I. Fatimah and T. Huda, Appl. Clay Sci., 2013, 74, 115–120 CrossRef CAS.
- D. Chen, M. Huang, S. He, S. He, L. Ding, Q. Wang, S. Yu and S. Miao, Appl. Clay Sci., 2016, 119, 109–115 CrossRef CAS.
- M. Tahir and N. S. Amin, Appl. Catal., B, 2013, 142–143, 512–522 CrossRef CAS.
- L. Stevens, K. Williams, W. Y. Han, T. Drage, J. Wood and J. Wang, Chem. Eng. J., 2013, 215–216, 699–708 CrossRef CAS.
- D. Olszewska, Fuel Process. Technol., 2011, 92, 2412–2419 CrossRef CAS.
- Y. Wu, W. Xu, Y. Yang, M. Shao, T. Zhu and L. Tong, RSC Adv., 2016, 6, 104294–104302 RSC.
- B. S. Kumar, A. Dhakshinamoorthy and K. Pitchumani, Catal. Sci. Technol., 2014, 4, 2378–2396 CAS.
- J. Xie, N. Yan, S. Yang, Z. Qu, W. Chen, W. Zhang, K. Li, P. Liu and J. Jia, Res. Chem. Intermed., 2012, 38, 2511–2522 CrossRef CAS.
- P. Wang, S. Su, J. Xiang, F. Cao, L. Sun, S. Hu and S. Lei, Chem. Eng. J., 2015, 225, 68–75 CrossRef.
- Z. Tan, J. Xiang, S. Su, H. Zeng, C. Zhou, L. Sun, S. Hu and J. Qiu, J. Hazard. Mater., 2012, 239–240, 160–166 CrossRef CAS PubMed.
- Z. Wu, B. Jiang and Y. Liu, Appl. Catal., B, 2008, 79, 347–355 CrossRef CAS.
- Z. Liu, X. Li, J. Y. Lee and T. B. Bolin, Chem. Eng. J., 2015, 275, 1–7 CrossRef CAS.
- H. Li, C. Y. Wu, Y. Li and J. Zhang, Environ. Sci. Technol., 2011, 45, 7394–7400 CrossRef CAS PubMed.
- A. K. Llunga and R. Meijboom, Appl. Catal., B, 2017, 203, 505–514 CrossRef.
- W. Du, L. Yin, Y. Zhuo, Q. Xu, L. Zhang and C. Chen, Fuel Process. Technol., 2015, 131, 403–408 CrossRef CAS.
- A. Zhang, W. Zheng, J. Song, S. Hu, Z. Liu and J. Xiang, Chem. Eng. J., 2014, 236, 29–38 CrossRef CAS.
- G. K. Reddy, J. He, S. W. Thiel, N. G. Pinto and P. G. Smirniotis, J. Phys. Chem. C, 2015, 119, 8634–8644 CAS.
- J. Xie, H. Xu, Z. Qu, W. Huang, W. Chen, Y. Ma, S. Zhao, P. Liu and N. Yan, J. Colloid Interface Sci., 2014, 428, 121–127 CrossRef CAS PubMed.
- D. Jampaiah, K. M. Tur, P. Venkataswamy, S. J. Ippolito, Y. M. Sabri, J. Tardio, S. K. Bhargava and B. M. Reddy, RSC Adv., 2015, 5, 30331–30341 RSC.
- H. Xu, Z. Qu, C. Zong, W. Huang, F. Quan and N. Yan, Environ. Sci. Technol., 2015, 49, 6823–6830 CrossRef CAS PubMed.
- Y. Xie, C. Li, L. Zhao, G. Zeng, X. Zhang, W. Zhang and S. Tao, Appl. Surf. Sci., 2015, 333, 59–67 CrossRef CAS.
- S. Yang, Y. Guo, N. Yan, D. Wu, H. He, J. Xie, Z. Qu and J. Jia, Appl. Catal., B, 2010, 101, 698–708 CrossRef.
- C. He, B. Shen, J. Chen and J. Cai, Environ. Sci. Technol., 2014, 48, 7891–7898 CrossRef CAS PubMed.
- J. Yang, Y. Zhao, J. Zhang and C. Zheng, Environ. Sci. Technol., 2014, 48, 14837–14843 CrossRef CAS PubMed.
| This journal is © The Royal Society of Chemistry 2018 |

