Morphology-dependent oxygen vacancies and synergistic effects of Ni/CeO2 catalysts for N2O decomposition†
Pei
Zhao
,
Feng
Qin
,
Zhen
Huang
,
Chao
Sun
,
Wei
Shen
and
Hualong
Xu
*
Department of Chemistry, Shanghai Key Laboratory of Molecular Catalysis and Innovative Materials and Laboratory of Advanced Materials, Collaborative Innovation Center of Chemistry for Energy Materials, Fudan University, Shanghai 200433, P. R. China. E-mail: shuhl@fudan.edu.cn; Fax: +86 21 65641740; Tel: +86 21 65642401
First published on 22nd November 2017
Abstract
Oxygen vacancies and metal–support synergistic effects in heterogeneous catalysis play a decisive role in catalytic efficiency. In this work, NiO supported on ceria nanorods (Ni/CeO2-NR) and ceria nanocubes (Ni/CeO2-NC) catalysts exhibit strong morphology-dependent oxygen vacancies content and NiO–CeO2 synergistic actions for N2O decomposition. Ni/CeO2-NR catalysts possess higher amounts of oxygen vacancies than Ni/CeO2-NC, while Ni/CeO2-NC samples display stronger metal–support synergistic actions to anchor more surface NiO clusters and boundary Ni–O–Ce nanostructures. Catalytic activity tests show that Ni/CeO2-NC catalysts exhibit a superior efficiency to Ni/CeO2-NR catalysts. The outstanding catalytic activities of Ni/CeO2-NC catalysts are related to a larger number of surface NiO clusters and boundary Ni–O–Ce nanostructures, which are much more active than oxygen vacancies for N2O decomposition. Furthermore, the boundary Ni–O–Ce is found to be a more reactive site than surface NiO clusters. This study presents a new strategy to design high-efficiency supported metal catalysts through controlling oxygen vacancies and metal–support synergistic effects by morphology-dependent synthesis.
1. Introduction
Nitrous oxide (N2O) is considered a hazardous atmospheric pollutant due to its crucial contribution to ozone depletion and greenhouse effect.1–3 N2O is a strong greenhouse gas with a global warming power that is 310 times higher than that of CO2 and it can survive steadily in our global atmosphere for more than one hundred years.4,5 Besides inevitable emissions derived from the land and oceans, other major sources of nitrous oxide are fossil fuel and biomass burning, agricultural fertilization, and chemical industrial processes including adipic and nitric acid production.6 Along with thriving chemical production on a global scale for the past few decades, atmospheric concentration of N2O sustained growth with annual rates of 0.2–0.3%.7 Therefore, N2O destruction is imperative for environmental protection. Furthermore, it is widely accepted that direct catalytic decomposition of N2O could be an eminently feasible and economical technique for abatement of N2O emissions.In recent years, catalytic decomposition of N2O has been explored intensively over a variety of catalysts, such as noble metals,8,9 mixed metal oxides,10,11 perovskites,12 and hexaaluminate catalysts.13 Among numerous promising catalysts, mixed oxides catalysts have been proved to be excellent catalysts with prominent activity and economy. In particular, ceria-based metal oxide catalysts were believed to be satisfactory catalysts for N2O decomposition,14–16 due to their outstanding redox ability and their excellent metal–ceria boundary properties. As reported in previous literature, boundary properties, determined by synergistic effects between metal oxides and their support, have great impacts on catalytic properties.17–19 The synergism between metal oxides and support can not only alter the dispersion and reducibility of active sites, but also prevent metal oxides from sintering, and thus increase catalytic activity. For example, according to reported work,20 synergistic effects between CeO2 and Ni/MCM-22 can suppress sintering of Ni nanoparticles and the formation of coke. Our group also found the synergy of CuO and CeO2 can promote stability and reducibility of the active Cu1 site.14
Besides a synergism effect, the content of oxygen vacancies is also proved to be important for catalytic performance of ceria-based catalysts. Up to now, many researchers have investigated the role of oxygen vacancies on catalytic efficiency of ceria-based catalysts, where the oxygen vacancies concentration can be tailored by morphology control21–23 and cations doping.24,25 Wu et al. fabricated various CeO2-supported VOx species catalysts with controllable CeO2 morphology for oxidative dehydrogenation of isobutene and they related catalytic activity to the oxygen vacancy concentration of the CeO2 support.22 Similarly, a correlation between the catalytic activity of VOx active sites and oxygen vacancy density of CeO2 was revealed in oxidative dehydrogenation of methanol.23 In addition, loading of VOx species on CeO2 support promoted formation of oxygen vacancies, which enhanced catalytic performance of VOx/CeO2 catalysts, confirming the contribution of cations doping to oxygen storage capacity (OSC). Similar research conducted by Huang's group also confirmed that increased oxygen vacancy concentration in NbOx/CeO2 catalysts played a decisive role in promoting oxidative dehydrogenation of propane.26
Since adsorbed oxygen species generated by N2O decomposition process will inhibit catalysts' activity and stability, improvements of oxygen storage capacity and mobility are needed for N2O decomposition. Among the various ceria-based metal oxides catalysts, Ni-doped CeO2 catalyst is an excellent candidate for this reaction owing to nickel's doping for improving oxygen storage capacity and raising catalytic ability.5,27 Our group has studied Ni–Ce mixed oxides with various Ni/Ce molar ratios for N2O decomposition and found that Ni–Ce catalysts presented a noteworthy behaviour for N2O destruction.28 Despite various evidences illustrating the dominant role of oxygen vacancy and synergistic effects in a ceria-based catalyst for many other catalytic reactions, the substantial role of oxygen vacancies and synergistic effects in well-defined Ni–Ce still remains less comprehended in N2O decomposition.
On the basis of the fact that morphology-dependent oxygen vacancies and synergism action have great importance to catalytic reactions, in this study, CeO2 nanorods and nanocubes supported NiO catalysts were prepared, over which the impact of oxygen vacancies and synergistic effects between the nickel oxide and CeO2 system for N2O decomposition were evaluated.
2. Experimental
2.1. Materials
Cerium nitrate hexahydrate (Ce(NO3)3·6H2O), nickel nitrate hexahydrate (Ni(NO3)2·6H2O), and sodium hydroxide (NaOH) were analytically pure and were used without any further purification.2.2. Preparation of CeO2 catalysts
CeO2 materials with two morphologies were synthesized by a hydrothermal method.29 Typically, for the synthesis of CeO2 nanorods (denoted as CeO2-NR), 1.96 g of Ce(NO3)3·6H2O and 19.2 g of NaOH were dissolved in 40 mL of deionized water, respectively. Then the NaOH solution was added into the Ce(NO3)3 solution at room temperature. After 30 min a milky slurry formed, then it was transferred to a 100 mL autoclave. After heating at 100 °C for 24 h, the obtained precipitate was collected, washed with deionized water, and dried at 80 °C for 12 h and calcined at 600 °C for 5 h to obtain CeO2-NR. The CeO2 nanocubes (denoted as CeO2-NC) were synthesized by the same procedure as that for CeO2 nanorods except the hydrothermal temperature was 180 °C.2.3. Preparation of Ni/CeO2 catalysts
The Ni/CeO2-NC and Ni/CeO2-NR catalysts with various Ni loadings were synthesized by incipient wetness impregnation. In a typical procedure, nickel species was supported onto CeO2 with various amounts of nickel nitrate hexahydrate. After impregnation, the catalysts were aged at room temperature for 24 h and dried at 80 °C in air overnight, and calcined at 600 °C for 5 h. In this study, the loading of nickel species was 2%, 4%, 6%, 8%, and 10% (denoted as x% Ni/CeO2-NR and x% Ni/CeO2-NC, respectively, where x is the weight percentage of nickel loading value).2.4. Catalyst characterization
X-ray diffraction (XRD) patterns of the CeO2 and Ni/CeO2 samples were recorded with an X-ray diffractometer (Bruker D8) using Cu Kα radiation (λ = 1.5418 Å). Diffraction patterns were recorded with scan step of 0.02° in the angle of 20 to 80°. Transmission electron microscopy (TEM) and high-resolution electron microscopy (HRTEM) were recorded on a JEM-2100 electron microscope with an accelerating voltage of 200 kV and a scanning transmission electron microscope (STEM, JEOL-TEM) equipped with energy-dispersive X-ray spectroscopy (EDS). The Brunauer–Emmett–Teller (BET) surface area of the catalysts were obtained from N2 adsorption–desorption tests at 77 K on a Micromeritics TRISTAR 3000 apparatus. The catalysts were degassed at 120 °C for 12 h before the measurements. The BJH method was used to determined pore volume and pore size distribution of the materials. The elemental content of nickel species was analyzed by an inductive-coupled plasma-emission spectrometer (ICP-MS) using an Optima 8000 (PerkinElmer, USA). Raman spectra were obtained on a laser confocal microscopy Raman spectrometer in the spectral range from 100 to 1600 cm−1 with a laser wavelength of 532 nm. H2-Temperature programmed reduction (TPR) was conducted by Micromeritics Auto Chem II 2920 with a thermal conductivity detector (TCD) detector. 50 mg catalyst was pretreated at 150 °C for 30 min, and then cooled to room temperature under He. The TPR runs were conducted at a flow rate of 30 mL min−1, and the temperature was increased within a linear heating rate (10 °C min−1) in a stream of 10% H2/Ar in the range of 50–900 °C. Metal dispersions of all the catalysts were measured by H2-TPD. A sample (100 mg) was reduced in 10% H2/Ar at 600 °C for 2 h and then cooled to room temperature. After removing weakly adsorbed hydrogen by purging with Ar, the temperature was raised to 800 °C at a heating rate of 10 °C min−1 to perform TPD measurement. The Ni dispersion was calculated based on the volume of chemisorbed H2.30 X-ray photoelectron spectroscopy (XPS) was performed using a PerkinElmer PHI 5000C system equipped with Al Kα radiation. Binding energies were calibrated by carbon (C1s, 284.6 eV). OSC tests were performed by oxygen pulse injection using the same reactor system as TPR experiments. The catalysts were pretreated the same way as TPR analysis. Next, the catalysts were reduced with a 10% H2/He mixture at 600 °C for 1 h. Whereafter, the samples were cooled down to 400 °C in He flow. Then 5% O2/He was injected every 5 min until saturation. Oxygen consumption was calculated (denoted as OSC). UV/vis diffuse reflectance spectra (UV-vis DRS) were obtained by a Lambd650 spectrometer with an integration sphere coated with BaSO4 as reference. In situ diffuse reflectance infrared Fourier transform (DRIFTs) experiments were performed on a Thermo Nicolet 6700 equipped with a MCT detector and a reaction cell fitted with CaF2 windows. All catalysts were treated at 400 °C under He flow to remove adsorbed species. After cooling to 30 °C in He, the inert gas was replaced by 2% N2O/He. The DRIFT spectra were recorded in a range of 1000–4000 cm−1 with a resolution of 4 cm−1 and accumulation of 32 scans.2.5. Catalyst activity tests
An automated eight flow reactor system was used for testing the activity of N2O decomposition, and 0.2 g catalysts were sieved with a 40–60 mesh screen and then packed in a quartz tubular reactor with an inner diameter of 6 mm. Before a measurement, all catalysts were treated in a helium flow at 400 °C for 60 min in each test and then the reactor was cooled to 250 °C. The reactant gas composed of 2% N2O and balanced helium with/without 2% O2, was set with a GHSV of 19![[thin space (1/6-em)]](https://www.rsc.org/images/entities/char_2009.gif) 000 h−1. Catalytic activity was measured at temperatures from 250 to 500 °C, in steps of 25 °C. At each temperature the reactions were stabilized for 60 min before analysis. Then products were analysed on-line by a Trace GC Ultra with a thermal conductivity detector (TCD), with a 10 m Porapak Q column. The turnover frequency with respect to Ni (TOFNi) was defined as the number of N2O produced per surface Ni atoms per second. The number of surface Ni atoms was obtained by the dispersion date. Since the N2O direct decomposition was confirmed to be the first order in N2O concentration,31 the apparent activation energy (Ea) is calculated by the following equations:
000 h−1. Catalytic activity was measured at temperatures from 250 to 500 °C, in steps of 25 °C. At each temperature the reactions were stabilized for 60 min before analysis. Then products were analysed on-line by a Trace GC Ultra with a thermal conductivity detector (TCD), with a 10 m Porapak Q column. The turnover frequency with respect to Ni (TOFNi) was defined as the number of N2O produced per surface Ni atoms per second. The number of surface Ni atoms was obtained by the dispersion date. Since the N2O direct decomposition was confirmed to be the first order in N2O concentration,31 the apparent activation energy (Ea) is calculated by the following equations:K = A![[thin space (1/6-em)]](https://www.rsc.org/images/entities/char_2009.gif) exp(−Ea/RT) exp(−Ea/RT) |
where x is the conversion of N2O; F0 is the total flow through the reactor (mol s−1); mcat is the amount of the catalyst (g); [N2O] is the molar N2O concentration at the inlet (mol cm3); A is the pre-exponential factor; R is the gas constant (8.314 J mol−1 k−1); T is the temperature (K).
3. Results and discussion
3.1. TEM and HRTEM results
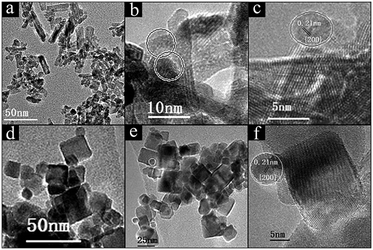
TEM and HRTEM images were recorded to investigate the size and morphologies of CeO2 and Ni/CeO2 with different morphologies. According to Fig. 1, CeO2-NR was successfully fabricated by a hydrothermal approach. It can be observed that CeO2-NR presents a nanorod morphology and has a uniform diameter of around 8 nm and a length within 30–100 nm. In Fig. 1b, a clear interplane spacing of 0.19 nm is attributed to the {110} planes of the ceria. This result suggests that CeO2-NR shows a preferred 1D growth direction along [110], and is enclosed by the {110} and {100} planes, which is consistent with previous literature information.32Fig. 1d and e show the uniform cube morphology of CeO2-NC with a dimension between 30–50 nm. The HRTEM image in Fig. 1e shows obvious {100} lattice fringes with a lattice plane of around 0.27 nm, which indicates that CeO2-NC preferentially exposes the {100} planes (Fig. 1f).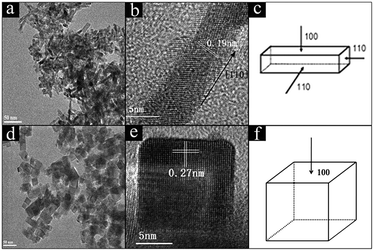 | ||
| Fig. 1 TEM and HRTEM images of CeO2-NR (a and b), and CeO2-NC (d and e); the schematic illustrations for CeO2-NR (c), and CeO2-NC (f). | ||
Fig. 2 shows the morphology of CeO2-NR and CeO2-NC after loading of Ni species. Results indicate that the catalysts maintained their original shapes. For the 8% Ni/CeO2-NR in Fig. 2a–c, the nickel species can be spotted on the surfaces of nanorods in a disorderly distribution. TEM (HRTEM) images in Fig. 2b and c display the nearly spherical nickel species (ca. 5–8 nm in diameters cycled in Fig. 2b and c) with exposed NiO {200} planes (Fig. 2c). For 8% Ni/CeO2-NC catalysts (Fig. 2d–f), in contrast, most of the nickel species are preferentially decorated along the corner of the CeO2 nanocubes and the particle size of spherical nickel species is around 5–10 nm, displaying NiO {200} lattice fringes with a spacing of 0.21 nm in Fig. 2f. This impressive corner deposition may give rise to the strong synergistic effects between NiO and CeO2 support and in turn, enhance physicochemical properties of Ni/CeO2-NC catalysts. Similar observations were obtained for CuOx and MnOx-dispersed CeO2 nanocubes.33,34 In their work, most of the copper species and manganese oxide were deposited along the edges of the CeO2 nanocubes, which intriguing distribution contributed to catalytic properties. Meanwhile, ICP-AES results (Table 1) for nickel contents in Ni/CeO2 with different morphologies and their corresponding STEM-EDS elemental mapping (Fig. S1†) prove the successful impregnation of Ni in CeO2 nanocrystalline.
| Samples | Nia (wt%) | Surface areab (m2 g−1) | CeO2 crystallite sizec (nm) | Nickel species sized (nm) | Lattice parametere (nm) |
|---|---|---|---|---|---|
| a Values determined by ICP-AES. b The specific surface area is calculated using the BET model. c Lattice parameter is obtained by XRD studies. d Lattice parameter is obtained by XRD studies. e Lattice parameter is obtained by XRD studies. | |||||
| CeO2-NR | — | 135.0 | 9.2 | — | 0.5426 |
| 2% Ni/CeO2-NR | 2.28 | 106.0 | 8.0 | — | 0.5421 |
| 4% Ni/CeO2-NR | 3.96 | 95.2 | 8.3 | — | 0.5418 |
| 6% Ni/CeO2-NR | 6.15 | 85.6 | 7.7 | 14.0 | 0.5424 |
| 8% Ni/CeO2-NR | 7.80 | 90.8 | 7.9 | 17.4 | 0.5424 |
| 10% Ni/CeO2-NR | 9.51 | 86.1 | 7.8 | 17.5 | 0.5424 |
| CeO2-NC | — | 38.3 | 19.4 | — | 0.5424 |
| 2% Ni/CeO2-NC | 1.95 | 34.9 | 18.9 | — | 0.5417 |
| 4% Ni/CeO2-NC | 3.86 | 34.7 | 19.3 | — | 0.5422 |
| 6% Ni/CeO2-NC | 5.68 | 31.4 | 18.1 | 12.3 | 0.5422 |
| 8% Ni/CeO2-NC | 7.66 | 30.4 | 19.4 | 14.8 | 0.5422 |
| 10% Ni/CeO2-NC | 9.39 | 29.6 | 18.7 | 16.2 | 0.5422 |
3.2. XRD and N2 adsorption–desorption results
Fig. 3 shows powder XRD patterns of ceria and x% Ni/CeO2 with two different morphologies. It can be deduced that the cubic fluorite-structured of ceria (JCPDS 34-0394) is confirmed by XRD diffraction peaks with 2θ values at 28.4, 32.9, 47.4, 56.2, 58.9, 69.2, 76.7, and 78.9° in CeO2-NR and CeO2-NC as well as their corresponding Ni/CeO2 samples.29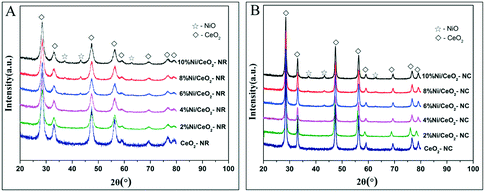 | ||
| Fig. 3 The XRD patterns of the (A) x% Ni/CeO2-NR, and (B) x% Ni/CeO2-NC catalysts (x denotes as weight percentage of nickel loading value). | ||
On the other hand, in the case of high nickel loading from 6% to 10%, besides the characteristic peaks of fluorite-structures of ceria, three weak XRD peaks located at 37.2, 43.2 and 62.8° (2θ) can be attributed to crystalline NiO species and these peaks correspond to (111), (200), and (220) planes, respectively.35,36 However, below a nickel loading of 6%, neither distinct diffraction peaks of NiO nor of Ni are observed, implying a high dispersion of nickel species or relatively low metal contents. Additionally, in spite of identical diffraction peak positions of CeO2-NR and CeO2-NC, the broader diffraction peaks for CeO2-NR suggests a smaller crystallite size. The mean crystallite size of ceria was determined by Scherrer's equation based on the (111) plane of CeO2. With regard to the crystallite size of NiO in Ni/CeO2, their average particle sizes were estimated by line broadening of the (200) line of NiO at 2θ = 43.3° (also utilizing the Scherrer's equation). The calculated results are listed in Table 1.
As displayed in Table 1, the mean crystallite size of CeO2 with two morphologies is nearly the same after the addition of various amounts of nickel nanocrystalline. What's more, the nickel species on CeO2-NR catalysts have a relatively larger size than that on CeO2-NC counterparts at the same metal loading. The NiO crystallite sizes are estimated to be 14.0, 17.4, and 17.5 nm for 6% Ni/CeO2-NR, 8% Ni/CeO2-NR, and 10% Ni/CeO2-NR, respectively. Similarly, the NiO crystallite sizes of Ni/CeO2-NC counterparts increase from 12.3 to 16.2 nm, which is related to agglomerates of nickel species with an increase of nickel loading. It is noteworthy that the estimated similar NiO crystallite size in two types of nickel–ceria can provide corroborative evidence for the exclusion of NiO size effect on catalytic properties.
In addition, the lattice parameter of the Ni/CeO2-NR (Table 1) decreases from 2% to 4% of Ni loading and increased abruptly at 6%, remaining constant till a 10% Ni loading. This interesting trend can be attributed to the limit of solubility for a Ce ↔ Ni exchange within the range of 10–12% (mol) Ni addition (equal to 3.7–4.5 wt%).37 According to a previous report,38 the contraction of the CeO2 lattice parameter upon Ni incorporation was caused by the substitution of Ce4+ ions (rCe4+ = 0.094 nm) by smaller Ni2+ ions (rNi2+ = 0.072 nm) to form a Ni–O–Ce bond in the range of 2% to 4% loading. This result is consistent with Vegard's rule. Nevertheless, beyond the 4% doping, increasing Ni loading leads an increase of lattice parameters. This unusual phenomenon can be attributed to the additional incorporation of Ni in an interstitial position upon a 4% Ni impregnation. This is because both substitution and interstitial point defects can change unit cell parameters, and the latter can generate the lattice expansion.39 Therefore, we can deduce that the maximum Ni substitution for Ce4+ occurs at 4% Ni doping for CeO2-NR, and then the excess Ni ions will occupy the interstitial sites, thus the enhancement of lattice parameters takes place at 6% Ni doping. In the case of Ni/CeO2-NC, the nickel substitution limit is 2% metal loading. For this reason, the lattice parameter of ceria with 4% Ni doping suddenly increases. To that end, the different nickel solubility limits and doping behaviour of nickel in ceria may induce the substantial differences in oxygen vacancies for Ni/CeO2-NR and Ni/CeO2-NC.40
The surface areas of CeO2-NR and CeO2-NC supports are 135.0 and 38.3 m2 g−1, respectively. After nickel deposition, the specific surface areas of Ni/CeO2-NR and Ni/CeO2-NC decrease to different extents. In addition, the Ni/CeO2-NR catalysts with various nickel content show surface areas almost three times higher than the Ni/CeO2-NC catalysts. Even with the much higher surface areas of Ni/CeO2-NR, it does not dominate the excellent catalytic properties.
3.3. Raman and OSC results
Oxygen vacancies as lattice defects are efficient for storing oxygen and are capable of reacting as valuable reactive sites together with metal oxides active sites in metal–ceria catalysts.41 Both Raman spectra and OSC tests are favourable tools to reveal the formation and concentration of oxygen vacancies for ceria-based catalysts. Fig. 4 displays the Raman results of Ni/CeO2-NR and Ni/CeO2-NC excited by a 532 nm laser. It can be seen that both CeO2-NR and CeO2-NC show an adsorption band at 457 and 598 cm−1 (insets in Fig. 4A and B), which are indicative of octahedrally symmetrical vibration modes in a ceria crystal nanostructure (F2g) and defect-induced (D) modes due to the presence of oxygen vacancies (Ov), respectively.42,43 It was reported that a CeO2 nanocrystal should have a sharp and symmetric peaks centered at 466 cm−1.44 | ||
| Fig. 4 Visible Raman spectra of various (A) Ni/CeO2-NR, (B) Ni/CeO2-NC, and (C) the corresponding ID/IF2g values for various Ni/CeO2 samples. | ||
However, the Raman profiles for ceria in Fig. 4 show a red shift to 457 cm−1, and this discrepancy is suspected to cause the diversity of ceria particle sizes.
Generally, the relative intensity ratio of ID/IF2g is widely accepted as an indicator for the concentration of Ov. On the basis of the calculated information in Fig. 4C, the ID/IF2g values of ceria follows the sequence: CeO2-NR (0.053) > CeO2-NC (0.024), implying a richer Ov density in the CeO2-NR nanostructure. To understand the distinct impact of nickel species on Ov for ceria supports with different morphologies, the Raman spectra for various Ni/CeO2-NR and Ni/CeO2-NC were also recorded in Fig. 4A and B. After the addition of nickel species, the Raman profiles of all the nickel-containing samples were nearly the same as the ceria supports except for the peak shift to a lower wave number. The F2g band of all the Ni/CeO2-NR and Ni/CeO2-NC shifts to a range of 441–447 and 440–450 cm−1, respectively, which indicated that Ni2+ can substitute for Ce4+ to form the Ce–O–Ni bond. This observation is consistent with the XRD results. Fig. 4C shows the ID/IF2g ratio as a function of nickel loading for Ni–CeO2 catalysts. For CeO2-NR and CeO2-NC catalysts, the ID/IF2g ratio increases with the nickel loading, verifying the vital role of nickel doping for yielding Ov. Meanwhile, the intensity ratio increases along with the increase of nickel loading from 2% to 6%, and then basically remains unchanged from 6% to 10% Ni/CeO2-NR. This interesting trend may be associated with the substitution and interstitial point defects limit. As analysed by XRD, the maximum Ni substitution for Ce4+ occurs at 4% Ni doping for CeO2-NR to form substitution defects and then the additional nickel species serve as interstitial point defects, which both significantly enhance Ov concentration. From this inference, it is expected that the 10% Ni loading will have the highest Ov concentration. However, that does not happen as desired. Therefore, one has to think that this abnormal result can be caused by the limit value of interstitial point defects, which occurs at 6% Ni loading. Similarly, the Raman curve for Ni/CeO2-NC catalysts shows an ultimate Ov density at 4% nickel impregnation. What's more, in Fig. 4C, it is evident that the Ni/CeO2-NR catalysts present a higher Ov concentration than that of Ni/CeO2-NC, which implies that the ceria morphology has a significant effect on the Ov amounts.
To further quantitate the amount of Ov, the OSC tests were measured (shown in Table 2). In Table 2, the O2 consumption for Ni/CeO2 catalysts is displayed, where the Ni/CeO2-NR and Ni/CeO2-NC catalysts exhibit a marked increase for OSC values compared with ceria supports. The Ni/CeO2-NR offers a larger OSC value than that of Ni/CeO2-NC at all nickel contents, which is consistent with the Raman results. According to Raman and XRD results, both substitution and interstitial point defects, which are caused by Ni incorporation into ceria, can contribute to the creation of Ov. Apparently, the maximum value of substitution and interstitial point defects for Ni/CeO2 with two morphologies are detected to take place at different nickel loadings, resulting in the diversity of Ov for each nickel–ceria sample.
| T max/(°C) | OSC (μmol [O2] gcat−1) | Ni dispersion (%) | Reaction ratea (10−6 mol s−1 gcat−1) | TOFNib (s−1) | E a (kJ mol) | ||
|---|---|---|---|---|---|---|---|
| γ peak | δ peak | ||||||
| a The reaction rate was defined as the mole number of N2O produced per gram of catalyst per second at 325 °C. b The TOF value was calculated at 325 °C. | |||||||
| CeO2-NR | — | — | 41.00 | — | 8.43 | — | 141.6 |
| 2% Ni/CeO2-NR | 322 | 353 | 152.9 | 39.7 | 11.41 | 6.35 × 10⁻² | 136.3 |
| 4% Ni/CeO2-NR | 320 | 352 | 346.5 | 19.9 | 16.03 | 8.54 × 10⁻² | 133.5 |
| 6% Ni/CeO2-NR | 324 | 360 | 571.7 | 12.0 | 18.68 | 11.27 × 10⁻² | 130.8 |
| 8% Ni/CeO2-NR | 325 | 361 | 725.5 | 9.9 | 43.87 | 24.06 × 10⁻² | 119.0 |
| 10% Ni/CeO2-NR | 325 | 366 | 874.6 | 6.1 | 21.41 | 15.27 × 10⁻² | 122.4 |
| CeO2-NC | — | — | 25.36 | — | 5.89 | — | 160.7 |
| 2% Ni/CeO2-NC | 315 | 373 | 136.4 | 17.1 | 26.81 | 32.11 × 10⁻² | 128.1 |
| 4% Ni/CeO2-NC | 306 | 372 | 277.3 | 13.3 | 30.50 | 34.94 × 10⁻² | 122.2 |
| 6% Ni/CeO2-NC | 314 | 370 | 447.5 | 9.5 | 49.99 | 36.18 × 10⁻² | 111.1 |
| 8% Ni/CeO2-NC | 316 | 376 | 648.8 | 6.8 | 62.50 | 50.69 × 10⁻² | 107.7 |
| 10% Ni/CeO2-NC | 312 | 375 | 798.7 | 3.8 | 44.46 | 47.88 × 10⁻² | 112.8 |
3.4. H2-TPR results
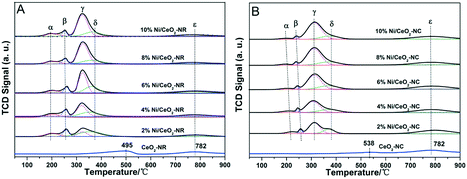
H2-TPR profiles were adopted to examine the reducibility of Ni/CeO2 catalysts and the synergistic effects between NiO and CeO2, and the profiles of ceria exhibit two reduction peaks in the region of 400–800 °C (Fig. 5), where the peaks at low temperature and high temperature can be attributed to the surface oxygen and bulk oxygen reduction in ceria, respectively.45 It is obvious that the reduction of surface oxygen for CeO2-NR and CeO2-NC occurs at 495 °C and 538 °C, respectively, and the order of H2 reduction areas for surface oxygen is CeO2-NR > CeO2-NC, suggesting a more facile surface oxygen reducibility for CeO2-NR and shape-dependence of reduction behaviour.After impregnation of Ni, the reduction behaviour of ceria alters dramatically in the low temperature zone, although the reduction ability of bulk oxygen (ε peak in Fig. 5A and B) remains unchanged. For the H2-TPR profiles of the Ni/CeO2 samples (Fig. 5), there are five main reduction peaks (α, β, γ, δ, and ε). The first two peaks α and β (starting at 133 °C and 136 °C, while reaching maximum in the region of 241–260 °C and 254–261 °C for Ni/CeO2-NR and Ni/CeO2-NC, separately) are ascribed to adsorbed oxygen species caused by the formation of Ni–O–Ce structures.46 Because once the Ni2+ is incorporated into a CeO2 lattice to generate a solid solution, the charge unbalance and lattice distortion will generate increased oxygen vacancies on the surface. In that case, surface oxygen can oxidize H2 at low temperatures. Similarly, the β peak's position in Ni/CeO2-NC continuously decrease from 260 to 241 °C with the increase of nickel content; however, the reduction temperature of Ni/CeO2-NR nearly remains constant.
As reported in the literature,39,47 the γ peaks can be linked to the reduction of the well-dispersed NiO phase interacting strongly with the CeO2 support (called boundary Ni–O–Ce), whereas the δ peak can be attributed to the reduction of the phase separated surface NiO clusters on CeO2. In addition, with careful observations for Ni/CeO2-NR and Ni/CeO2-NC profiles, the peak area ratio of γ(γ/γ + δ) continuously increases with the nickel content, as shown in Table S1.† These results suggest most nickel species can exist in the form of a well-dispersed Ni–O–Ce structure. What's more, the Tmax of γ and δ peak (Table 2) of Ni/CeO2-NC catalysts present a lower reduction temperature than that of Ni/CeO2-NR, implicating the synergistic effects between nickel species and CeO2-NC.48
In short, the reducible NiO species exist in two different forms, i.e., NiO clusters and the Ni–O–Ce structure. Because the subtle variations in surface structures of the support may change the redox properties of catalysts,49 the difference in synergism between metal oxides and support may be due to different nickel bonding ability with ceria. This essential disparate synergistic action can play an influential role for heterogeneous catalysis.
3.5. UV-vis results
Fig. 6 displays the DRS UV-vis results for ceria and several nickel-containing catalysts. Absorbance bands are observed at around 260 and 352 nm for the CeO2-NR catalyst; these are attributed to the Ce3+ ← O2− charge transfer, and Ce4+ ← O2− charge transfer, respectively.50 Since ceria is an n-type semiconductor and has a band gap energy (Eg) value of standard 3.3 eV,51 the absorbed light of λ should be lower than λg, which centers at 400 nm. Thus, the red or blue shifts of ceria spectra and the multiple peaks splitting may come from the different cation's environments or the disparate oxidation states for Ce3+ and Ce4+.52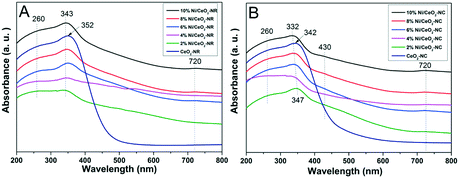 | ||
| Fig. 6 DRS-UV-vis spectra of (A) CeO2-NR and x% Ni/CeO2-NR, and (B) CeO2-NC and x% Ni/CeO2-NC catalysts (x denotes as weight percentage of nickel loading value). | ||
In contrast, in Fig. 6A for Ni/CeO2-NR with a nickel loading from 2% to 10%, all the catalysts show an extra distinctive band at around 720 nm except for the characteristic bands at 260 and 352 nm of ceria. The blue shift for Ce4+ ← O2− charge transfer at 343 nm is detected in nickel-containing catalysts, and the lattice distortions in ceria from nickel dopant can account for this shift. According to a literature report,53 the band at about 720 nm can be related to octahedral Ni2+. What's more, the intensity of octahedrally coordinated Ni2+ gets stronger with increasing nickel loading, which further verifies that the generation of bulk NiOx species can derive from octahedrally coordinated Ni2+.54 For the DRS bands of CeO2-NC (Fig. 6B), similar spectra to CeO2-NR are observed and a blue shift appears in the DR spectra since the coordination number of Ce4+ increases or the crystallite size changed.52
Although the DRS profiles of all the Ni/CeO2-NC (shown in Fig. 6B) resemble those for Ni/CeO2-NR, the additional peak at 430 nm is also assigned to the charge transfer of octahedral Ni2+.53 For DRS UV-vis results displayed in Fig. 6A, no noticeable peaks are in this region, which manifests the diversity in nickel environment. In the comparison of surface nickel species on two different type of ceria, i.e., CeO2-NR and CeO2-NC, we took the 8% Ni/CeO2 catalyst for example (in Fig. S2†). The weaker signals at 430 nm and 720 nm indicate a lower content of octahedrally coordinated Ni2+ in the 8% Ni/CeO2-NR structure. The surface content of nickel species was further analysed by the following XPS analysis.
3.6. XPS results
XPS measurements were carried out to identify surface composition and element valance states. Fig. 7A–C display the Ce3d, O1s, and Ni 2p spectra for the CeO2 and Ni/CeO2 samples, respectively. In Fig. 7A, the peaks labelled as V0, V′, and U′ are ascribed to Ce3+ 3d states, while the peaks labelled as V, V′′, and V′′′ (referring to Ce 3d3/2) and U, U′′, and U′′′ (Ce 3d5/2) are the characteristic peaks of Ce4+.16,49 The relative concentration of Ce3+ is calculated from the peak area ratio of Ce3+/(Ce4+ + Ce3+).56 According to Table 3, the density of Ce3+ in ceria supports increases upon the deposition of nickel species. Such an increasing trend maintains until the 6% and 4% nickel loading for Ni/CeO2-NR and Ni/CeO2-NC, respectively. Apparently, Ni/CeO2-NR obtains a higher Ce3+ number compared with that of Ni/CeO2-NC. These results suggest that Ni addition can introduce variation in the redox properties of CeO2 supports. As illustrated by the Kröger–Vink equation, the existence of Ce3+ in a ceria lattice site is commonly accompanied by the formation of oxygen vacancies in it.55 Therefore, it can be concluded that Ni/CeO2-NR has larger amounts of oxygen vacancies than that of Ni/CeO2-NC, which is in line with Raman spectra results. The O1s spectra of different Ni/CeO2 samples (Fig. 7B) are fitted into two peaks, where the peaks located at 528.9–529.3 eV are attributed to lattice oxygen species (Olatt), whereas the peaks with higher binding energy at 530.7–531.5 eV belong to surface oxygen species (Oads).57 Obviously, the amount of surface oxygen in nickel-containing samples is much higher than that of ceria, implying the indispensable role of nickel doping in oxygen vacancy creation.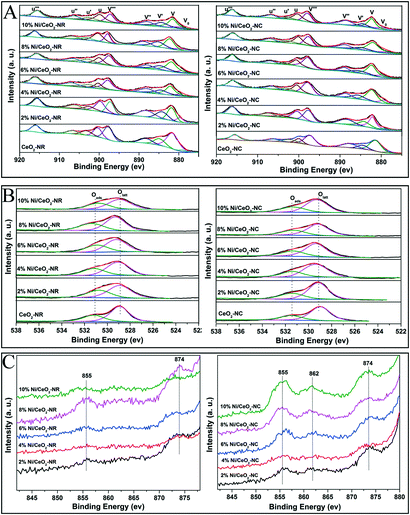 | ||
| Fig. 7 The core-level XPS spectra of all the CeO2 and Ni/CeO2 catalyst Ce 3d (A), O1s (B) and Ni 2p (C). | ||
| Samples | Surface content of Ni (wt%) | Ce3+/Ce3+ + Ce4+ (at%) | Oads/Oads + Olatt (at%) |
|---|---|---|---|
| CeO2-NR | — | 19.50 | 29.86 |
| 2% Ni/CeO2-NR | 1.36 | 24.93 | 35.19 |
| 4% Ni/CeO2-NR | 2.35 | 25.69 | 37.50 |
| 6% Ni/CeO2-NR | 1.28 | 26.94 | 37.69 |
| 8% Ni/CeO2-NR | 3.79 | 26.30 | 38.18 |
| 10% Ni/CeO2-NR | 4.95 | 26.16 | 37.83 |
| CeO2-NC | — | 16.48 | 27.14 |
| 2% Ni/CeO2-NC | 5.28 | 18.70 | 29.96 |
| 4% Ni/CeO2-NC | 7.14 | 19.98 | 30.33 |
| 6% Ni/CeO2-NC | 12.61 | 18.52 | 31.56 |
| 8% Ni/CeO2-NC | 16.49 | 19.72 | 31.71 |
| 10% Ni/CeO2-NC | 22.47 | 19.74 | 31.32 |
In the case of nickel species, the Ni 2p photoelectron spectrum is shown in Fig. 7C. The peaks at ca. 855 and 874 eV for Ni/CeO2-NC samples can be attributed to the Ni 2p3/2 and Ni 2p1/2 signals, respectively, fitting with the characteristic states of NiO species.58 Another weak broad peak located at 862 eV can be associated with a shakeup satellite peak corresponding to Ni2O3 species,59 where the electron transfer between the nickel species and ceria occurs along the Ni–CeO2 boundary, reflecting strong synergistic effects between Ni–CeO2. In contrast, Ni/CeO2-NR exhibits much weaker Ni 2p and shakeup satellite peaks. Further analysis for Ni content from XPS date (see Table 3) indicates that surface Ni content in Ni/CeO2-NC is higher than its theoretical value, while the Ni/CeO2-NR offers a lower Ni content, which corresponds with the UV-vis results. This phenomenon confirms that nickel species preferably exist on the CeO2-NC surface, and are inclined to incorporate into the subsurface/bulk phase of CeO2-NR support. These results can be interpreted by the better nickel solubility ability in the CeO2-NR, which agreed with the XRD results.
3.7. In situ DRIFTs results
Interactions of N2O with ceria and 8% Ni/CeO2 catalyst at 325 °C for 60 min were performed using in situ DRIFTs spectroscopy. Fig. 8A shows the DRIFT spectra recorded with various catalysts under N2O. In Fig. 8A, the bands at 2579, 2549, 2236, 2215, 1301, and 1270 cm−1 can be assigned to gas-phase or adsorbed N2O.60 For the sake of comparison, the DRIFT spectra were then recorded after He purge at 325 °C for 30 min, and the results are depicted in Fig. 8B. After removing gas-phase and weakly adsorbed N2O, the adsorbed N2O at 1270 cm−1 can be clearly observed at 8% Ni/CeO2-NC catalysts, while a weak intensity occurs with other catalysts. This implies that the chemisorption of N2O on 8% Ni/CeO2-NC catalysts is stronger than that of 8% Ni/CeO2-NR and the adsorption sites could be cerium oxide sites and/or nickel species.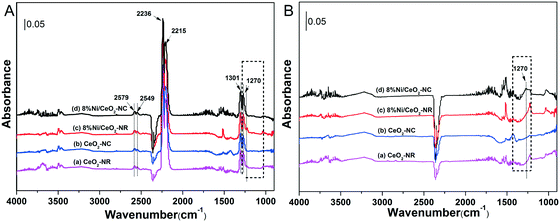 | ||
| Fig. 8 DRIFT spectra after flowing 2% N2O in He at 325 °C over various catalysts for 60 min (A), and followed by He purge at 325 °C for 30 min (B). | ||
3.8. Characteristic of the used catalysts
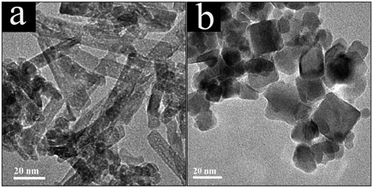
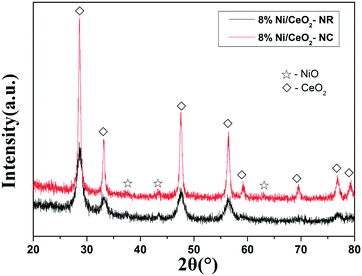
The morphologies of used Ni/CeO2-NR and Ni/CeO2-NC were observed by TEM images in Fig. 9. After the reaction, the 8% Ni/CeO2-NR and 8% Ni/CeO2-NC still maintain their original shapes, which suggests that Ni/CeO2-NR and Ni/CeO2-NC have good structure stability during the N2O decomposition reaction. XRD patterns of the used Ni/CeO2-NR and Ni/CeO2-NC nanostructures are shown in Fig. 10. The diffraction peaks of NiO and CeO2 can be observed in 8% Ni/CeO2-NR and 8% Ni/CeO2-NC catalysts, indicating an unchanged structure after the catalytic reaction.3.9. Catalytic N2O decomposition performance
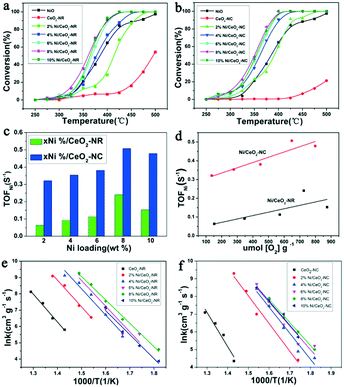
The catalytic activities of Ni/CeO2-NR and Ni/CeO2-NC catalysts were tested for N2O decomposition. Fig. 11a and b display N2O decomposition conversion as a function of the temperature over Ni/CeO2 catalysts with a rod nanostructure and cube nanostructure (0%, 2%, 4%, 6%, 8%, 10%), respectively. For comparison, the NiO was also measured. The CeO2-NR and CeO2-NC exhibit a relative low catalytic performance, while these two samples obtain an enhanced activity after the introduction of nickel species, evidently revealing the decisive function of NiO species on the catalytic performance. Besides, beyond the 2% nickel loading, the NiO-decorated CeO2-NR and CeO2-NC can achieve better catalytic performance as compared to the NiO and CeO2 catalysts, and 6% and 8% nickel–ceria gain similar activity for N2O decomposition. When further increasing Ni doping to 10%, the catalytic performance decreases slightly. This observation highlights the significance of surface NiO clusters and boundary Ni–O–Ce as well as the crucial factor of nickel content for N2O elimination.In order to gain a better comparison for the catalytic efficiency of the materials, TOF values with respect to the exposed Ni atom (TOFNi) and the reaction rate (r) at 325 °C for the series of Ni/CeO2 catalysts were calculated (plotted in Fig. 11c and listed in Table 2). As clearly presented in Table 2, the reaction rate of CeO2-NR is higher than that of CeO2-NC, where r value for CeO2-NR and CeO2-NC is 8.43 × 10⁻⁶ mol s−1 gcat−1 and 5.89 × 10⁻⁶ mol s−1 gcat−1, respectively. However, compared with Ni/CeO2-NC catalysts, nickel–ceria with rod structures instead provide a lower r value. The TOFNi values of N2O over x% Ni/CeO2-NC are higher than that of x% Ni/CeO2-NR, demonstrating the superiority of Ni/CeO2-NC to Ni/CeO2-NR. Moreover, it can be seen that the TOFNi values for x% Ni/CeO2 catalysts (x = 2, 4, 6, 8) reach a maximum at 8% Ni loading, namely, nickel–ceria with moderate nickel concentration possess the highest activity for N2O decomposition. Nevertheless, excessive deposited Ni may form large NiO clusters, which in turn inhibits the efficiency of nickel–ceria materials. Therefore, based on these data, it can be concluded that the catalytic activities of nickel–ceria catalysts are not only associated with the catalyst's morphology, but also with existence of a nickel species. The apparent activation energies (Ea) for these Ni/CeO2 catalysts are calculated from their Arrhenius plots (Fig. 11e and f), which are listed in Table 2. For the x% Ni/CeO2-NC catalysts, the apparent activation energies are lower than the values of x% Ni/CeO2-NR catalysts. As a result, the catalytic activities of x% Ni/CeO2-NC catalysts are higher than that of x% Ni/CeO2-NR catalysts.
Table 4 lists a comparison of catalytic N2O decomposition results over Ni/CeO2-NC catalysts with other reported ceria-based catalysts. By comparison, the T50 of 8% Ni/CeO2-NC catalyst is lower than other ceria-based materials except for the RhOx/Ce0.9Pr0.1O2 reported by Bueno-López's group.66 Although Rh-based catalysts have much lower T50 temperatures, the lower cost of mixed oxides could remedy their inferior performance. Therefore, the Ni/CeO2-NC is a superior catalyst for N2O decomposition.
| Catalysts (metal loading) | Reaction conditions during catalytic test | T 50 (°C) | Ref. |
|---|---|---|---|
| a Half conversion temperature (T50). | |||
| Co3O4/CeO2 (10 wt%) | GHSV = 30![[thin space (1/6-em)]](https://www.rsc.org/images/entities/char_2009.gif) 000 h−1, [N2O] = 1000 ppm 000 h−1, [N2O] = 1000 ppm |
410 | 16 |
| CuO/CeO2 (10 wt%) | GHSV = 45![[thin space (1/6-em)]](https://www.rsc.org/images/entities/char_2009.gif) 000 h−1, [N2O] = 2500 ppm 000 h−1, [N2O] = 2500 ppm |
380 | 61 |
| CuO–CeO2 (20 wt%) | GHSV = 40![[thin space (1/6-em)]](https://www.rsc.org/images/entities/char_2009.gif) 000 h−1, [N2O] = 1000 ppm 000 h−1, [N2O] = 1000 ppm |
462 | 62 |
| Fe2O3/CeO2 (40 mol% of Cu) | GHSV = 23![[thin space (1/6-em)]](https://www.rsc.org/images/entities/char_2009.gif) 800 h−1, [N2O] = 4500 ppm 800 h−1, [N2O] = 4500 ppm |
470 | 63 |
| CuO/CeO2 (40 mol% of Cu) | GHSV = 45![[thin space (1/6-em)]](https://www.rsc.org/images/entities/char_2009.gif) 000 h−1, [N2O] = 2500 ppm 000 h−1, [N2O] = 2500 ppm |
440 | 64 |
| Ir/Al2O3 + CeO2 (0.5 wt%) | GHSV = 40![[thin space (1/6-em)]](https://www.rsc.org/images/entities/char_2009.gif) 000 h−1, [N2O] = 1000 ppm 000 h−1, [N2O] = 1000 ppm |
480 | 65 |
| RhOx/Ce0.9Pr0.1O2 (1 wt%) | GHSV = 42![[thin space (1/6-em)]](https://www.rsc.org/images/entities/char_2009.gif) 000 h−1, [N2O] = 1000 ppm 000 h−1, [N2O] = 1000 ppm |
242 | 66 |
| Ni/CeO2-NC (8 wt%) | GHSV = 19![[thin space (1/6-em)]](https://www.rsc.org/images/entities/char_2009.gif) 000 h−1, [N2O] = 26 000 h−1, [N2O] = 26![[thin space (1/6-em)]](https://www.rsc.org/images/entities/char_2009.gif) 000 ppm 000 ppm |
350 | Present work |
The impact of O2 in the reactant feed on deN2O performance was investigated over the 8% Ni/CeO2-NC and 8% Ni/CeO2-NR samples and the results were depicted in Fig. 12. For comparison, we also investigated the catalytic behaviour over 8% Ni/γ-Al2O3. As shown in Fig. 12, the catalytic activities over the studied catalysts take the following order: 8% Ni/CeO2-NC > 8% Ni/CeO2-NR > 8% Ni/γ-Al2O3 in the absence of O2. However, under O2 reaction conditions, the deN2O activities of all the catalysts suffer a decrease to various degrees, as indicated by the upward shift of T50. It can be seen from the resulting N2O conversion profiles that the upward shifts of T50 are up to 15 °C, 6 °C, and 28 °C for 8% Ni/CeO2-NC, 8% Ni/CeO2-NR, and 8% Ni/γ-Al2O3, respectively. These results indicate the Ni/CeO2-NC and Ni/CeO2-NR catalysts can be a better candidate for N2O destruction with or without the presence of O2 in comparison with Ni/γ-Al2O3.
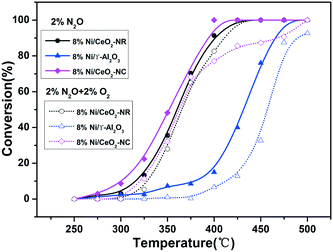 | ||
| Fig. 12 Conversion curves for N2O decomposition reaction over 8% Ni/CeO2-NR, 8% Ni/CeO2-NC, and 8% Ni/γ-Al2O3 in the absence and presence of O2 in the feed stream. | ||
3.10. Structure–activity relationships of Ni/CeO2 catalysts
It is well known that ceria-based materials have been regarded as a superior candidates in several catalytic activities due to the excellent redox efficiency of CeO2.67,68 Based on previous reports,69,70 the surface oxygen vacancy (Vo) in reduced ceria can act as the reactive site in a variety of catalytic reactions. Reduced ceria can be oxidized by N2O, leading to a rapid generation of N2 molecules and Ce4+, that can further desorb oxygen and regenerate Vo accompanied by Ce3+ species. This inference indicates that Vo can also serve as the active site for N2O decomposition. As a result, CeO2-NR with a larger number of Vo is more active than CeO2-NC. In order to better analyse the quantitative relationship between TOFNi and Vo concentration, TOFNi values of N2O as a function as OSC for CeO2 and Ni/CeO2 were demonstrated in Fig. 11d. Clearly, the TOFNi over Ni/CeO2 with two shapes increase with Vo concentration (OSC), indicating involvement of the reduced ceria in N2O decomposition. The extent of its participation in this reaction can be evaluated by the OSC value.In terms of the structure–activity correlation between catalytic activity and OSC, it is apparent that the TOFNi values of N2O for Ni/CeO2-NC are notably higher than the date from Ni/CeO2-NR, despite the less Vo on the Ni/CeO2-NC nanostructures. This essential information hints the fact that apart from the Vo, there ought to be other vital factors in improving catalyst efficiency. Indeed, numerous factors are closely relevant to catalytic activity, such as the existence of forms of active components, BET surface areas, and particle size.4,16,71 However, in our work, BET surface areas and NiO particle size does not dominate the catalytic efficiency. Based on the claim from the aforementioned catalytic data in Fig. 11, both surface NiO clusters and boundary Ni–O–Ce contribute a momentous portion to the raised deN2O performance of Ni/CeO2-NC catalysts.
Taking account of the verdict from Raman spectra, OSC measurements, H2-TPR and XPS data, although the Ni/CeO2-NR has more Vo as well as bulk Ce1−xNixO2 solid solution, the CeO2-NC occupies stronger synergistic actions to anchor more surface NiO and Ni–O–Ce structure on the surface. The results can be successfully verified by H2-TPR and XPS. Based on the catalytic data depicted in Fig. 11, the surface NiO clusters and boundary Ni–O–Ce, the main active sites, are more active than Vo (serving as secondary active site) for the deN2O reaction. Therefore, nickel–ceria nanocubes, offering less Vo but possessing stronger synergistic actions to hold more NiO clusters and boundary Ni–O–Ce structure, exhibit superior performance to nickel–ceria nanorods. Accordingly, the concentration of Vo and the degree of synergistic actions, deciding the distribution of surface NiO and boundary Ni–O–Ce, are vital factors for catalytic efficiency.
In order to explore the impact of NiO clusters and boundary Ni–Ce–O on catalytic efficiency, we calculated the TOF value of surface NiO clusters and boundary Ni–Ce–O, respectively, and the results are listed in Table S1.† It can be seen that the TOF values of boundary Ni–Ce–O are larger than those of NiO clusters over all the catalysts. This result indicates that the boundary Ni–Ce–O is the more reactive site for deN2O performance. As shown in Table S1,† when the nickel loading increases from 2% to 6%, the Ni2+ can incorporate into the ceria lattice to engender the bulk Ce1−xNixO2 solid solution to generate Vo, along with the formation of a small amount of surface NiO and boundary Ni–O–Ce nanostructures. Meanwhile, the TOF of NiO and boundary Ni–Ce–O increases. From 6% to 8% loading, the TOF of surface NiO and boundary Ni–O–Ce increase dramatically and an excess of 10% loading leads to a slight decrease of TOF, which is induced by coverage of active sites. These proofs indicate that catalytic performance is closely related to the Ni loading. Taking into account all the results, we propose the following tentative mechanism of N2O decomposition over Ni/CeO2 catalysts:
| Ce3+–V0 + ONN → N2 + Ce4+–O− | (1) |
| Ce4+–O− + Ce4+–O– → O2 + 2Ce3+–V0 | (2) |
| Ce4+–O− + ONN → N2 + O2 + Ce3+ –V0 | (3) |
| Ni2+–ONN → Ni2+–ONN | (4) |
| Ni2+–ONN → Ni3+–O− + N2 | (5) |
| 2Ni3+−O− → 2Ni2+ + O2 | (6) |
| Ni3+–O− + ONN → N2 + O2 + Ni2+ | (7) |
| Ni3+–O− + Ce3+–V0 → Ni2+ + Ce4+–O− | (8) |
In the case of CeO2-NR and CeO2-NC supports, the participation of Vo in the N2O decomposition reaction can follow steps (1)–(3). While for the Ni/CeO2-NR and Ni/CeO2-NC, N2O molecules adsorb on Ni2+ active sites (step (4)) and then the Ni3+–O− species form (step (5)). The chemisorption of N2O on catalysts can be confirmed by the in situ DRIFTs results. Regeneration of active Ni2+ sites can occur by oxygen recombination step (step (6)) or by reaction of Ni3+–O− complex with nitrous oxide (step (7)). Taking the H2-TPR and XPS results into account, since synergetic effects between NiO and CeO2, and high lattice oxygen mobility originating from the reducible ceria occurs, the Ce3+ can reduce Ni3+–O− to Ni2+, and in turn regenerate the catalyst active site (step (8)). The formed Ce4+–O− can desorb oxygen molecules and regenerate Ce3+ by step (2) or (3). In summary, both Vo and surface NiO as well as boundary Ni–O–Ce can be involved in the proposed mechanism. Therefore, by comparison with CeO2-NC supports, the higher catalytic efficiency of CeO2-NR can be attributed to a larger amount of Vo on the material. Considering the synergetic effects between NiO and CeO2 support, boundary, Ni–O–Ce can be a superior active site to NiO clusters, which can be confirmed by the higher TOF value of boundary Ni–O–Ce. According to the proposed reaction mechanism, the higher the amount of boundary Ni–O–Ce is, the better catalytic efficiency a material possesses. Therefore, the Ni/CeO2-NC catalysts with higher concentrations of boundary Ni–O–Ce have higher catalytic activity.
4. Conclusion
In this work, a series of Ni/CeO2 with nanorods and nanocubes morphology were successfully fabricated and their catalytic efficiencies were tested for N2O decomposition, which strongly exhibit morphology-dependent effects. It was discovered that the Ni/CeO2-NC catalysts with all ranges of nickel loading exhibit a higher catalytic performance than that of Ni/CeO2-NR catalysts, regardless of the better catalytic activity of CeO2-NR. Comprehensive characterizations revealed that Ni/CeO2-NR possess more oxygen vacancies (Vo) than that of Ni/CeO2-NC. However, the CeO2-NC have stronger synergetic actions to accommodate more surface NiO clusters and boundary Ni–O–Ce structure, which serve as more active reaction centres for the deN2O reaction as compared to Vo, leading to boosted catalytic efficiency of Ni/CeO2-NC. Besides, the TOF value of boundary Ni–O–Ce is higher than that of NiO clusters, which indicates the boundary Ni–O–Ce is a more reactive site. In brief, the concentration of Vo and the ceria morphology-dependent synergetic effects between metal and supports, as well as the existential form of nickel species, are the main factors in deN2O reactions. Thus, morphology-controlled synthesis and screening the optimal existential form of metal species can be utilized for the synthesis of other supported catalysts with high catalytic efficiency.Conflicts of interest
There are no conflicts to declare.Acknowledgements
This work was supported by National Key Research and Development Program of China (Grant 2017YFB0602204); National Natural Science Foundation of China (Grant 91645201); the Shanghai Science and Technology Committee (Grant 14DZ2273900).References
- C. Sui, X. Y. Niu, Z. Wang, F. L. Yuan and Y. J. Zhu, Catal. Sci. Technol., 2016, 6, 8505 CAS.
- J. Pérez-Ramírez, F. Kapteijin, K. Schöffel and J. A. Moulijin, Appl. Catal., B, 2003, 44, 117 CrossRef.
- A. R. Ravishankara, J. S. Daniel and R. W. Portmann, Science, 2009, 326, 123 CrossRef CAS PubMed.
- R. Amrousse and A. Tsutsumi, Catal. Sci. Technol., 2016, 6, 438 CAS.
- M. Konsolakis, ACS Catal., 2015, 5, 6397 CrossRef CAS.
- D. Pietrogiacomi, M. C. Campa, L. R. Carbone, S. Tuti and M. Occhiuzzi, Appl. Catal., B, 2016, 187, 218 CrossRef CAS.
- Q. L. Zhang, X. S. Tang, P. Ning, Y. K. Duan, Z. X. Song and Y. Z. Shi, RSC Adv., 2015, 5, 51263 RSC.
- S. Parres-Esclapez, M. J. Illán-Gómez, C. Salinas-Martínez de Lecea and A. Bueno-López, Appl. Catal., B, 2010, 96, 370 CrossRef CAS.
- Q. Q. Lin, Y. Q. Huang, Y. Wang, L. Li, X. Y. Liu, F. Lv, A. Q. Wang, W. C. Li and T. Zhang, J. Mater. Chem. A, 2014, 2, 5178 CAS.
- Q. Shen, L. D. Li, J. J. Li, H. Tian and Z. P. Hao, J. Hazard. Mater., 2009, 163, 1332 CrossRef CAS PubMed.
- L. Xue, H. He, C. Liu, C. B. Zhang and B. Zhang, Environ. Sci. Technol., 2009, 43, 890 CrossRef CAS PubMed.
- C. D. Huang, Y. Y. Zhu, X. D. Wang, X. Liu, J. H. Wang and T. Zhang, J. Catal., 2017, 347, 9 CrossRef CAS.
- Y. Zhang, X. D. Wang, Y. Y. Zhu, B. L. Hou, X. F. Yang, X. Liu, J. H. Wang, J. Li and T. Zhang, J. Phys. Chem. C, 2014, 118, 1999 CAS.
- H. B. Zhou, Z. Huang, C. Sun, F. Qin, D. S. Xiong, W. Shen and H. L. Xu, Appl. Catal., B, 2012, 125, 492 CrossRef CAS.
- M. Zabilskiy, P. Djinović, E. Tchernychova, O. P. Tkachenko, L. M. Kustov and A. Pintar, ACS Catal., 2015, 5, 5357 CrossRef CAS.
- G. Grzybek, P. Stelmachowski, S. Gudyka, P. Indyka, Z. Sojka, N. Guillén-Hurtado, V. Rico-Pérez, A. Bueno-López and A. Kotarba, Appl. Catal., B, 2016, 180, 622 CrossRef CAS.
- G. C. Zou, Y. Xu, S. J. Wang, M. X. Chen and W. F. Shangguan, Catal. Sci. Technol., 2015, 5, 1084 CAS.
- L. Jiang, M. Wei, X. Y. Xu, Y. J. Lin, Z. Lü, J. Q. Song and X. Duan, Ind. Eng. Chem. Res., 2011, 50, 4398 CrossRef CAS.
- H. B. Li, Y. Y. Cui, Q. Q. Liu and W. L. Dai, ChemCatChem DOI:10.1002/cctc.201701384.
- R. Amin, X. Q. Chang and B. S. Liu, Ind. Eng. Chem. Res., 2017, 56, 7445 CrossRef CAS.
- Y. X. Gao, R. T. Li, S. L. Chen, L. F. Luo, T. Cao and W. X. Huang, Phys. Chem. Chem. Phys., 2015, 17, 31862 RSC.
- Z. L. Wu, V. Schwartz, M. J. Li, A. J. Rondinone and S. H. Overbury, J. Phys. Chem. Lett., 2012, 3, 1517 CrossRef CAS PubMed.
- Y. Li, Z. H. Wei, F. Gao, L. Kovarik, C. H. F. Peden and Y. Wang, J. Catal., 2014, 315, 15 CrossRef CAS.
- A. D. Liyanage, S. D. Perera, K. Tan, Y. Chabal and K. J. Balkus Jr, ACS Catal., 2014, 4, 577 CrossRef CAS.
- N. Qiu, J. Zhang and Z. Y. Wu, Phys. Chem. Chem. Phys., 2014, 16, 22659 RSC.
- Y. M. Liu, L. F. Luo, Y. X. Gao and W. X. Huang, Appl. Catal., B, 2016, 197, 214 CrossRef CAS.
- C. Ohnishi, K. Asano, S. Iwamoto, K. Chikama and M. Inoue, Catal. Today, 2007, 120, 145 CrossRef CAS.
- H. B. Zhou, P. L. Hu, Z. Huang, F. Qin, W. Shen and H. L. Xu, Ind. Eng. Chem. Res., 2013, 52, 4504 CrossRef CAS.
- H. X. Mai, L. D. Sun, Y. W. Zhang, R. Si, W. Feng, H. P. Zhang, H. C. Liu and C. H. Yan, J. Phys. Chem. B, 2005, 109, 24380 CrossRef CAS PubMed.
- Q. Liu, J. J. Gao, M. J. Zhang, H. F. Li, F. N. Gu, G. W. Xu, Z. Y. Zhong and F. B. Su, RSC Adv., 2014, 4, 16094 RSC.
- N. Liu, R. D. Zhang, B. H. Chen, Y. P. Li and Y. X. Li, J. Catal., 2012, 294, 99 CrossRef CAS.
- R. H. Gao, D. S. Zhang, P. Maitarad, L. Y. Shi, T. Rungrotmongkol, H. R. Li, J. P. Zhang and W. G. Cao, J. Phys. Chem. C, 2013, 117, 10502 CAS.
- S. Putla, M. H. Amin, B. M. Reddy, A. Nafady, K. A. Al Farhan and S. K. Bhargava, ACS Appl. Mater. Interfaces, 2015, 7, 16525 CAS.
- P. Sudarsanam, B. Hillary, B. Mallesham, B. G. Rao, M. H. Amin, A. Nafady, A. Alsalme, B. M. Reddy and S. K. Bhargava, Langmuir, 2016, 32, 2208 CrossRef CAS PubMed.
- X. Liao, Y. Zhang, M. Hill, X. Xia, Y. X. Zhao and Z. Jiang, Appl. Catal., A, 2014, 488, 256 CrossRef CAS.
- M. L. Ang, U. Oemar, E. T. Saw, L. Mo, Y. Kathiraser, B. H. Chia and S. Kawi, ACS Catal., 2014, 4, 3237 CrossRef CAS.
- L. Barrio, A. Kubacka, G. Zhou, M. Estrella, A. Martínez-Arias, J. C. Hanson, M. Fernández-García and J. A. Rodriguez, J. Phys. Chem. C, 2010, 114, 12689 CAS.
- N. Wang, W. Z. Qian, W. Chu and F. Wei, Catal. Sci. Technol., 2016, 6, 3594 CAS.
- P. Pal, R. K. Singha, A. Saha, R. Bal and A. B. Panda, J. Phys. Chem. C, 2015, 119, 13610 CAS.
- X. Q. Wang, M. Q. Shen and J. Wang, J. Phys. Chem. C, 2010, 114, 10221 CAS.
- B. Choudhury and A. Choudhury, Mater. Chem. Phys., 2012, 131, 666 CrossRef CAS.
- Z. Y. Pu, X. S. Liu, A. P. Jia, Y. L. Xie, J. Q. Lu and M. F. Luo, J. Phys. Chem. C, 2008, 112, 15045 CAS.
- A. Chen, Y. Zhou, N. Ta, Y. Li and W. J. Shen, Catal. Sci. Technol., 2015, 5, 4184 CAS.
- F. Vindigni, M. Manzoli, A. Damin, T. Tabakova and A. Zecchina, Chem. – Eur. J., 2011, 17, 4356 CrossRef CAS PubMed.
- E. Aneggi, D. Wiater, C. Leitenburg, J. Llorca and A. Trovarelli, ACS Catal., 2014, 4, 172 CrossRef CAS.
- W. Liu, W. Z. Wang, K. Tang, J. X. Guo, Y. Q. Ren, S. P. Wang, L. J. Feng and Y. Z. Yang, Catal. Sci. Technol., 2016, 6, 2427 CAS.
- K. Tang, W. Liu, J. Li, J. X. Guo, J. C. Zhang, S. P. Wang, S. L. Niu and Y. Z. Yang, ACS Appl. Mater. Interfaces, 2015, 7, 26839 CAS.
- R. K. Singha, A. Yadav, A. Agrawal, A. Shukla, S. Adak, T. Sasaki and R. Bal, Appl. Catal., B, 2016, 191, 165 CrossRef CAS.
- G. Pantaleo, V. La Parola, F. Deganello, R. K. Singha, R. Bal and A. M. Venezia, Appl. Catal., B, 2016, 189, 233 CrossRef CAS.
- A. Bensalem, F. Bozon-Verduraz, M. Delamar and G. Bugli, Appl. Catal., A, 1995, 121, 81 CrossRef CAS.
- R. Zhang, J. T. Miller and C. D. Baertsch, J. Catal., 2012, 294, 69 CrossRef CAS.
- A. Kambolis, H. Matralis, A. Trovarelli and Ch. Papadopoulou, Appl. Catal., A, 2010, 377, 16 CrossRef CAS.
- J. S. Lisboa, L. E. Terra, P. R. J. Silva, H. Saitovitch and F. B. Passos, Fuel Process. Technol., 2011, 92, 2075 CrossRef CAS.
- P. V. R. Rao, V. P. Kumar, G. S. Rao and K. V. R. Chary, Catal. Sci. Technol., 2012, 2, 1665 CAS.
- P. Sudarsanam, B. Hillary, M. Hassan Amin, S. B. A. Hamid and S. K. Bhargava, Appl. Catal., B, 2016, 185, 213 CrossRef CAS.
- K. A. Michalow-Mauke, Y. Lu, K. Kowalski, T. Graule, M. Nachtegaal, O. Kröcher and D. Ferri, ACS Catal., 2015, 5, 5657 CrossRef CAS.
- W. Liu, T. Deng, L. J. Feng, A. Xie, J. C. Zhang, S. P. Wang, X. F. Liu, Y. Z. Yang and J. X. Guo, CrystEngComm, 2015, 17, 4850 RSC.
- P. Prieto, V. Nistor, K. Nouneh, M. Oyama, M. Abd-Lefdil and R. Díaz, Appl. Surf. Sci., 2012, 258, 8807 CrossRef CAS.
- J. W. Cui, J. B. Luo, B. G. Peng, X. Y. Zhang, Y. Zhang, Y. Wang, Y. Q. Qin, H. M. Zheng, X. Shu and Y. C. Wu, Nanoscale, 2016, 8, 770 RSC.
- P. E. Fanning and M. A. Vannice, J. Catal., 2002, 207, 166 CrossRef CAS.
- M. Zabilskiy, P. Djinović, B. Erjavec, G. Dražić and A. Pintar, Appl. Catal., B, 2015, 163, 113 CrossRef CAS.
- M. Konsolakis, S. A. C. Carabineiro, E. Papista, G. E. Marnellos, P. B. Tavares, J. Agostinho Moreira, Y. Romaguera-Barcelay and J. L. Figueiredob, Catal. Sci. Technol., 2015, 5, 3714 CAS.
- F. J. Perez-Alonso, I. Melián-Cabrera, M. López Granados, F. Kapteijn and J. L. G. Fierro, J. Catal., 2006, 239, 340 CrossRef CAS.
- M. Zabilskiy, B. Erjavec, P. Djinović and A. Pintar, Chem. Eng. J., 2014, 254, 153 CrossRef CAS.
- E. Pachatouridou, E. Papista, A. Delimitis, M. A. Vasiliades, A. M. Efstathiou, M. D. Amiridis, O. S. Alexeev, D. Bloom, G. E. Marnellos, M. Konsolakis and E. Iliopoulou, Appl. Catal., B, 2016, 187, 259 CrossRef CAS.
- V. Rico-Pérez, C. Salinas-Martínez de Lecea and A. Bueno-López, Appl. Catal., A, 2014, 472, 134 CrossRef.
- S. Q. Chen, L. P. Li, W. B. Hu, X. S. Huang, Q. Li, Y. S. Xu, Y. Zuo and G. S. Li, ACS Appl. Mater. Interfaces, 2015, 7, 22999 CAS.
- X. W. Liu, K. B. Zhou, L. Wang, B. Y. Wang and Y. D. Li, J. Am. Chem. Soc., 2009, 131, 3140 CrossRef CAS PubMed.
- F. Wang, C. M. Li, X. Y. Zhang, M. Wei, D. G. Evans and X. Duan, J. Catal., 2015, 329, 177 CrossRef CAS.
- F. Wang, S. He, H. Chen, B. Wang, L. R. Zheng, M. Wei, D. G. Evans and X. Duan, J. Am. Chem. Soc., 2016, 138, 6298 CrossRef CAS PubMed.
- I. I. Soykal, H. Sohn, D. Singh, J. T. Miller and U. S. Ozkan, ACS Catal., 2014, 4, 585 CrossRef CAS.
Footnote |
| † Electronic supplementary information (ESI) available. See DOI: 10.1039/c7cy02301d |
| This journal is © The Royal Society of Chemistry 2018 |


