 Open Access Article
Electrochemical water oxidation using a copper complex†
Sebastian
Nestke
a,
Emanuel
Ronge
b and
Inke
Siewert
 *a
*a
aUniversität Göttingen, Institut für Anorganische Chemie, Tammannstr. 4, 37077 Göttingen, Germany. E-mail: inke.siewert@chemie.uni-goettingen.de
bUniversität Göttingen, Institut für Materialphysik, Friedrich-Hund-Platz 1, 37077 Göttingen, Germany
First published on 7th June 2018
Abstract
Herein, we report the application of the mononuclear copper complex 1, [CuII(L)]2+, in electrochemical water oxidation catalysis (L = 1,3-bis(((1-methyl-1H-imidazol-2-yl)methyl)amino)propan-2-ol). The complex exhibits a N4 donor set consisting of two amine and two imidazole units and a dangling OH unit in close proximity to the copper ion. 1 exhibits a moderate apparent rate constant kcat of 0.12 s−1 in catalysis and operates at an overpotential of 0.83 V. Detailed investigations allowed us to derive a mechanism for water oxidation. The catalysis proceeds only under basic conditions, where [CuII(L)(OH)]+, 1H−1, is the main solution species, which indicates that a negatively charged ligand is necessary to drive the catalysis. Initial oxidation of 1H−1 is coupled to proton loss forming a copper(III) species and further oxidation initiates oxygen evolution. Initial oxidation of 1 under neutral, i.e. non-catalytic, conditions is pH independent, highlighting the importance of PCET steps during catalysis. We collected reasonable evidence that catalysis proceeds via a water nucleophilic attack mechanism. The electrolyte presumably acts as a proton acceptor in catalysis as the onset potential depends on the buffer employed.
Introduction
The production of sustainable fuels such as H2, methanol, CO or formate requires the reduction of oxidised precursors H+ or CO2.1 Water is considered as a cheap and abundant electron and proton source in this regard. Its oxidation requires a potential of 1.23 V under standard conditions. One of the most efficient catalysts in the electrochemical oxygen evolution catalysis (OEC) is platinum metal.2 However, the high price of platinum makes it rather unattractive and therefore catalysts based on earth-abundant metals have been developed. Molecular electrocatalysts based on iron, nickel, cobalt, and copper have been identified, which lower the overpotential substantially and are stable under the highly oxidative conditions of the catalysis.3 Since the initial report of the copper bipyridine system, A, by Mayer and co-workers in 2012,4 copper catalysts have attracted considerable attention.5 Selected molecular copper complexes with N-donor ligands, which have been explored in molecular OEC, are shown in Table 1.| Donor set L | pH | η/V | k cat/s−1 | TON | |
|---|---|---|---|---|---|
| a η: E(O2|H2O) relative to half peak potential. b η: E(O2|H2O) relative to onset potential. c η: E(O2|H2O) relative to applied potential during electrolysis. d n.a. = not available. | |||||
A![[thin space (1/6-em)]](https://www.rsc.org/images/entities/char_2009.gif) 4 4 |
N2 | 12.5 | 0.75b | 100 | 30 |
B![[thin space (1/6-em)]](https://www.rsc.org/images/entities/char_2009.gif) 5a 5a |
N4O | 11 | 0.52a | 33 | 13 |
C![[thin space (1/6-em)]](https://www.rsc.org/images/entities/char_2009.gif) 5c 5c |
N2 | 12.4 | 0.64c | 0.4 | 1 |
D![[thin space (1/6-em)]](https://www.rsc.org/images/entities/char_2009.gif) 5e 5e |
N5 | 8 | 0.64c | ∼20 | 19 |
E′![[thin space (1/6-em)]](https://www.rsc.org/images/entities/char_2009.gif) 5f 5f |
N4 | 11.5 | 0.40 | 3.6 | 0.5 |
E′′![[thin space (1/6-em)]](https://www.rsc.org/images/entities/char_2009.gif) 5f 5f |
N4 | 11.5 | 0.17 | 0.16 | 0.5 |
F![[thin space (1/6-em)]](https://www.rsc.org/images/entities/char_2009.gif) 5j 5j |
N4 | 7 | 0.88b | 7 | n.a.d |
G![[thin space (1/6-em)]](https://www.rsc.org/images/entities/char_2009.gif) 5l 5l |
N2 | 12 | 0.30a | 35 | n.a.d |
H![[thin space (1/6-em)]](https://www.rsc.org/images/entities/char_2009.gif) 5m 5m |
N4 | 12.5 | 1.00 | 33 | 1.43 |
These complexes show moderate to high apparent rate constants kcat at overpotentials as low as 0.17 V.5f Some of these complexes (E, F) exhibited an equatorial N donor ligand-set and such complexes proved to be stable under the oxidative conditions of the catalysis. This prompted us to investigate 1 as a catalyst in the water oxidation reaction (Fig. 1).61 exhibits a tetradentate N ligand set and a dangling OH unit, which could allow for efficient proton transfer (PT) pathways during catalysis.7 The complex also catalyses the electrochemical dihydrogen evolution from seawater – earth's most abundant water source,6b which would potentially allow water splitting catalysis in a one cell compartment with cheap electrode materials.
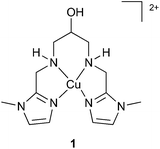 | ||
| Fig. 1 Copper complex that catalyses the electrochemical hydrogen6b and oxygen evolution reactions. | ||
Results and discussion
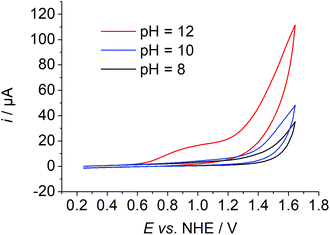
The synthesis, purification, and characterisation of 1 have been described previously.6 The purity of the complex was confirmed by elemental analysis. A common three electrode setup employing an SCE reference electrode, a platinum counter electrode and a GC working electrode was used for electrochemical measurements. If not otherwise noted, potentials are referenced vs. NHE. The complex exhibits a reduction process at −0.28 V in neutral water. Under basic conditions an increase in current was observed at applied potentials above 1 V. A pre-wave was visible at ∼1 V and a catalytic wave was visible with an onset potential of ∼1.3 V at pH values of the solution above 10 (Fig. 2 and Fig. S2†).CV measurements of 1 in acetonitrile and acetonitrile/water mixtures indicate that the catalytic wave could indeed belong to water oxidation. In dry acetonitrile, no oxidation process of 1 was observed, but the addition of 10% basic water led to an oxidation process at a potential of 0.49 V vs. Fc+/0 and a pronounced wave at a potential of 0.91 V vs. Fc+/0 (Fig. S3†).
We investigated the influence of the working electrode on the catalysis and utilised a boron doped diamond (BDD) electrode. However, considerable background activity was visible under basic conditions and therefore the GC electrode was used for all further investigation (Fig. S4†).
A controlled potential electrolysis experiment (CPE) at an applied potential of 1.494 V confirmed oxygen evolution under basic conditions, i.e. pH = 12 (Fig. S5†). Gas bubbles were visible at the electrode surface and the colour of the solution changed from purple to blue. The amount of evolved O2 was analysed by gas chromatography (Fig. S19†). Catalysis exhibits a Faraday efficiency of 60% (average of 6 runs) and a maximum TON of 6 after 30 min of electrolysis, which is rather high in comparison with the previous reports employing copper complexes (Table 1). The pH of the solution decreased from 12.04 to 11.8 during electrolysis due to proton formation. No hydrogen peroxide was detected after the CPE experiment with a potassium iodide/starch test.
We collected reasonable evidence that the catalyst remains homogeneous during catalysis. Visual inspection of the electrode after CPE did not reveal any deposit. The rinse test was negative, that is a CV and CPE measurement of the electrode after a CPE experiment in a freshly prepared buffer solution was similar to the background measurement (Fig. S9†). Scanning electron microscopy (SEM) and energy-dispersive X-ray spectroscopy (EDX) of the electrode surface revealed very little deposition of copper containing materials (Fig. S23 and 24†). The electrode surface has a roughness and shape similar to that after a CPE experiment without the complex (Fig. S25 and 26†). In line with this, virtually no current passed and no notable oxygen formation was detected, when we reused the GC electrode in a second experiment by employing a complex free buffer solution (Fig. S10†). That is to say that the very small amounts of deposited copper containing materials are not active in the OER. The concentration of 1 after chemical oxidation and after CPE was the same as that determined by visible spectroscopy (Fig. S22†). CPE with Cu(II)SO4 was used as the reference system for copper deposition (Fig. S8, S27 and S28†).5b
Subsequently, we investigated the kinetics of the catalysis. Notably, in order to obtain reproducible results, the electrode was polished after each CV scan (Fig. S11†). Catalysis proceeds at an overpotential of 0.83 V at pH = 12 as determined from CV data (E = 1.35 V at icat/2, [1] = 5 mM).8 In order to estimate the apparent rate constant kcat of the catalysis, scan rate dependent data were collected (Fig. S12†). The kcat is proportional to ic2 as shown in eqn (1).9ic denotes the catalytic peak current, ncat the number of transferred electrons for water oxidation, F the Faraday constant, A the electrode surface, ccat the catalyst concentration, and D the diffusion coefficient in phosphate buffer at pH 12. D was determined from the CuII/CuI redox pair.
 | (1) |
The apparent rate constant can be calculated from ic over ipvs. the square root of the scan rate plot (eqn (2)). ip denotes the current in the no-catalytic event and it has been determined from the CuII/CuI reduction process of 1 (eqn (S1), Fig. S13†).
 | (2) |
The apparent rate constant at 1.494 V equals 0.12 s−1, which is at the lower limit of previously reported catalysts.
A plot of the catalytic current at E = 1.494 V vs. the pH of the solution indicates an increase in current under basic conditions with a rather sharp onset above pH values of the solution of 10 (Fig. 3). The first derivative of the CV traces at different pH values of the solution revealed two pH-dependent inflection points. The first one is accompanied by a small increase in current and the second one by a pronounced increase (Fig. S2 and S15†).
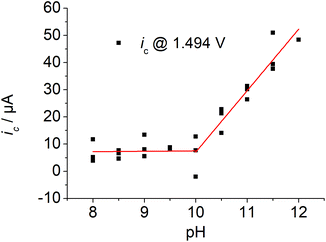 | ||
| Fig. 3 Plot of the current ic at E = 1.494 V vs. solution's pH, 3 runs, ([1] ≈ 1 mM, I = 0.1 M PO43−, ν = 0.1 mV s−1). | ||
We assigned the first oxidation process to an oxidation of the initial copper(II) species to a copper(III) species, as the corresponding zinc complex is redox inactive in this potential region (Fig. S14†). No catalysis has been observed at an applied potential of the wave of the first oxidation process (Eappl = 0.944 V, Fig. S5†). Thus, further oxidation beyond the copper(III) state initiates catalysis. Previous speciation studies showed that [Cu(L)(H2O)]2+ is the dominant species when the pH of the solution is below 11 and the deprotonated species [Cu(L)(OH)]+ above pH values of the solution of 11.6b This indicates that the doubly charged complex exhibits no noticeable activity and negatively charged ligands are important to enter catalysis. The peak potential of the first oxidation process is pH independent below pH ∼10 and it shifts by 54 mV per pH above pH ∼10, which is characteristic of a 1e−/1H+ coupled redox process according to the Nernst equation (Fig. S15†). Since catalysis only takes place under basic conditions, this fact highlights the importance of PCET steps during oxidation. The second oxidation process shifts by 25 mV per pH indicating proton involvement during oxidation. Indeed, the catalytic wave exhibits a strong kinetic isotopic effect (KIE) (Fig. S16†): changing from H2O to D2O leads to a pronounced current decrease of the catalytic wave. A KIE of 5 was calculated according to eqn (3).
 | (3) |
Three mechanisms are discussed in the literature for O–O bond formation pathways in water oxidation catalysis, water nucleophilic attack at high valent metal species (WNA),10 radical coupling of two high valent metal species (RC)11 or redox isomerisation of a dinuclear Cu2O2 species (RI).5m The first type proceeds via single sites, while the latter two mechanisms involve binuclear species. Such dimeric species have not been observed previously for single site Cu complexes bearing an equatorial N4 donor set and it was also very unlikely for 1: (i) previous speciation studies of 1 in solution showed the formation of a mononuclear complex, when a copper to ligand ratio of one is employed6b and (ii) the equatorial N4 coordination mode of the ligand precludes dimerisation as observed for A4 or H.5m Indeed, concentration dependent measurements showed a first order kinetics in 1 as the current increases linearly with increasing catalyst concentration ([1] = 0.5–5.0 mM, Fig. 4).
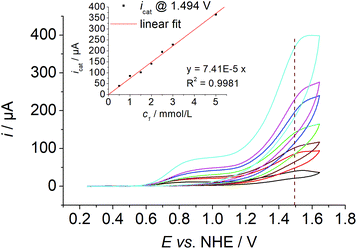 | ||
| Fig. 4 Concentration dependent CV data of 1 ([1] ≈ 0.5–5.0 mM, I = 0.1 MPO43−, pH = 12, ν = 0.1 V s−1). Inset: Plot of the catalytic current ic at E = 1.494 V vs. [1]. | ||
This indicates that the catalysis proceeds through a WNA mechanism. In the WNA mechanism, water attacks the highly oxidised copper species forming a CuIIOOH species, and further oxidation of the intermediate leads to the release of dioxygen. Meyer and co-workers proposed a CuIV![[double bond, length as m-dash]](https://www.rsc.org/images/entities/char_e001.gif) O/CuIII–O˙ species as a crucial intermediate after initial 2e− oxidation of B, which reacts with water forming a copper(II) peroxide species5a while Llobet and co-workers gave evidence for the formation of [(L˙)CuIII(OH)] after initial 2e− oxidation of E, which binds an additional hydroxide ion only weakly leading to a SET-WNA mechanism.5f,12 Ligand oxidation was less likely in 1, as the zinc complex is redox inactive under oxidative conditions (Fig. S14†). CV measurements in the presence of various amounts of H2O2 did not allow us to conclude on the formation of a peroxide intermediate, as H2O2 oxidation occurs at a similar potential (Fig. S17†). The addition of H2O2 leads to a colour change from purple to blue, and Vis spectroscopy showed a blue-shift of the d–d-band of 1 from 580 nm over 660 nm (10 eq.) to 675 nm (100 eq., Fig. S20†). The colour change and the blue-shift of the d–d-bands were similar to the shift observed after CPE (Fig. S21†): λmax shifted to 655 nm after CPE at 0.944 V and to 675 nm after CPE at 1.494 V.
O/CuIII–O˙ species as a crucial intermediate after initial 2e− oxidation of B, which reacts with water forming a copper(II) peroxide species5a while Llobet and co-workers gave evidence for the formation of [(L˙)CuIII(OH)] after initial 2e− oxidation of E, which binds an additional hydroxide ion only weakly leading to a SET-WNA mechanism.5f,12 Ligand oxidation was less likely in 1, as the zinc complex is redox inactive under oxidative conditions (Fig. S14†). CV measurements in the presence of various amounts of H2O2 did not allow us to conclude on the formation of a peroxide intermediate, as H2O2 oxidation occurs at a similar potential (Fig. S17†). The addition of H2O2 leads to a colour change from purple to blue, and Vis spectroscopy showed a blue-shift of the d–d-band of 1 from 580 nm over 660 nm (10 eq.) to 675 nm (100 eq., Fig. S20†). The colour change and the blue-shift of the d–d-bands were similar to the shift observed after CPE (Fig. S21†): λmax shifted to 655 nm after CPE at 0.944 V and to 675 nm after CPE at 1.494 V.
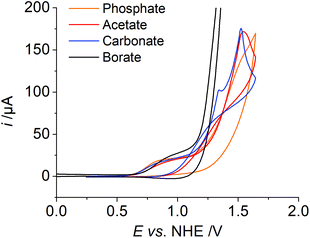
Finally, the influence of the electrolyte on catalysis was evaluated, as the redox potential shifts per pH and the large H/D isotope effect indicates PCET during catalysis and the buffer could act as a proton acceptor. The first oxidation wave, which we assigned to the CuII/CuIII oxidation, has a similar potential in all measurements independent of the electrolyte (Fig. 5, phosphate, borate, acetate and carbonate salt). We also observe a catalytic wave in all four solutions indicating that the activity is an inherent property of 1 and not due to an impurity in the electrolytes (Fig. S18†). By far the highest catalytic current is observed with borate buffer. For phosphate, carbonate, and acetate, the catalytic current is very similar, indicating a similar catalytic activity in all three cases (Table 2). The onset of the catalytic wave depends on the electrolyte and therefore we assume that the anion is involved in the catalysis as a proton acceptor, which was discussed previously.5a,e Notably, we observe a trace crossing of the forward and reverse scans, when carbonate or acetate is employed as an electrolyte. Such a trace crossing could indicate the formation of an oxidised species that reacts in a chemical reaction to form a second species, which has a less positive standard potential with respect to the initial catalyst.13 Such a scenario is consistent with the formation of a peroxide intermediate, which is easier to reduce than the initial catalyst.5b
| Electrolyte | E onset i @ 50 μA | E @ i c/2 | i c/ip |
|---|---|---|---|
| B(OH)3 | 1.18 V | 1.32 V | 40 |
| Na2CO3 | 1.24 V | 1.39 V | 9 |
| NaOAc | 1.30 V | 1.36 V | 10 |
| K2HPO4 | 1.29 V | 1.35 V | 7 |
Taking all experimental observations together, we derived a minimum mechanism for water oxidation employing 1 in phosphate buffer (Scheme 1). The initial oxidation of [CuII(L)(OH)]+ forming [CuIII(L)(O)]+ is metal based and coupled with proton loss. Further oxidation of [CuIII(L)(O)]+ initiates the catalysis. This step is also coupled to PT events and we have reasonable evidence that the buffer acts as a proton acceptor, since the onset potential of the catalysis depends on the electrolyte. Subsequently, a peroxide intermediate is formed via WNA at the high valent copper species, which is oxidised at a lower standard potential than the initial catalyst and this oxidation leads to oxygen evolution.
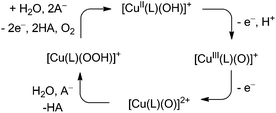 | ||
| Scheme 1 Proposed mechanism for the electrochemical water oxidation catalysed by 1 under basic conditions. | ||
Conclusion
1 proved to be a stable, homogeneous catalyst in the electrochemical-driven water oxidation catalysis. In comparison with the previously reported copper catalysts, the complex exhibits a moderate apparent rate constant and a reasonable overpotential. The dangling OH unit has no impact on catalysis. The complex is active under basic conditions, highlighting the need for a negatively charged ligand at the metal centre and PCET steps during oxidation. Under neutral conditions, the complex exhibits neutral ligands and its initial oxidation is not coupled to PT, while 1H−1 is the main solution species under basic conditions, and its initial oxidation is accompanied by a proton loss. Further oxidation is also coupled to PT events and initiates catalysis under basic conditions. The catalysis proceeds presumably via a single site mechanism involving the formation of a peroxide intermediate through the nucleophilic attack of water and high valent copper-oxido species.Experimental
Synthesis
The synthesis and purification of 1 has been described previously.6Electrochemistry
A common three electrode setup was used with a glassy carbon electrode (CH Instruments, A = 7.1 mm2) or boron doped diamond (Windsor Scientific, A = 7.1 mm2) as the working electrode, a platinum wire as the counter electrode (99.999%, 1 mm diameter) and a SCE as the reference electrode (ALS). All electrochemical data were referenced against NHE by adding 0.244 V to the measured potentials. Before each scan the GC working electrode was pre-treated by rinsing with Millipore water, 30 second polishing with an alox-slurry (0.05 μm), rinsing with Millipore water, 3 minute sonication in Millipore water, rinsing with Millipore water and drying. Electrolyte solution (0.1 M) was prepared by titrating a 0.1 M K2HPO4 solution with KOH. Unless otherwise noted, the electrolyte solution was stirred over Chelex® (100–200 mesh particle size, sodium form) for 20 minutes and the filtrate was used to improve the reproducibility and to remove the traces of other metals, if present.For bulk electrolysis the solutions were degassed by “pump, freeze, thaw” cycles. The solutions were frozen, evacuated and then the solutions were allowed to defreeze. This was repeated 4 times. A glassy carbon rod (7 mm diameter) was used as the working electrode and a platinum spiral as the counter electrode. Bulk electrolysis was performed in a custom made air tight two compartment cell. Working and counter electrodes were separated by a glass frit. For better reproducible results the working electrode was cycled 30 times between 1.84 V and −0.76 V with 500 mV s−1 in electrolyte solution before electrolysis. For surface analysis GC plates (1 × 1 cm) were used in the same air tight two compartment cells as for the bulk electrolysis and pre-treated in the same way as the working electrode for bulk electrolysis. After electrolysis the plates were carefully rinsed with Millipore water and dried.
Conflicts of interest
There are no conflicts to declare.Acknowledgements
This work was supported by funding from the DFG (Emmy Noether Programm: SI 1577/2 (IS)), the Fonds der Chemischen Industrie and the Dr Otto Röhm Gedächtnisstiftung.References
- S. R. Foit, I. C. Vinke, L. G. J. de Haart and R.-A. Eichel, Angew. Chem., Int. Ed., 2017, 56, 5402 CrossRef PubMed.
- H. Dau, C. Limberg, T. Reier, M. Risch, S. Roggan and P. Strasser, ChemCatChem, 2010, 2, 724 CrossRef; J. Hessels, R. J. Detz, M. T. M. Koper and J. N. H. Reek, Chem. – Eur. J., 2017, 23, 16413 CrossRef PubMed.
- Selected recent reviews: (a) P. Du and R. Eisenberg, Energy Environ. Sci., 2012, 5, 6012 RSC; (b) R. Cao, W. Lai and P. Du, Energy Environ. Sci., 2012, 5, 8134 RSC; (c) J. G. McAlpin, T. A. Stich, W. H. Casey and R. D. Britt, Coord. Chem. Rev., 2012, 256, 2445 CrossRef; (d) X. Liu and F. Wang, Coord. Chem. Rev., 2012, 256, 1115 CrossRef; (e) A. Singh and L. Spiccia, Coord. Chem. Rev., 2013, 257, 2607 CrossRef; (f) M. D. Kärkäs, O. Verho, E. V. Johnston and B. Åkermark, Chem. Rev., 2014, 114, 11863 CrossRef PubMed; (g) A. R. Parent and K. Sakai, ChemSusChem, 2014, 7, 2070 CrossRef PubMed; (h) J. D. Blakemore, R. H. Crabtree and G. W. Brudvig, Chem. Rev., 2015, 115, 12974 CrossRef PubMed; (i) I. Siewert, Chem. – Eur. J., 2015, 21, 15078 CrossRef PubMed; (j) M. D. Kärkäs and B. Åkermark, Dalton Trans., 2016, 45, 14421 RSC; (k) T. J. Meyer, M. V. Sheridan and B. D. Sherman, Chem. Soc. Rev., 2017, 46, 6148 RSC; (l) P. Garrido-Barros, C. Gimbert-Suriñach, R. Matheu, X. Sala and A. Llobet, Chem. Soc. Rev., 2017, 46, 6088 RSC.
- S. M. Barnett, K. I. Goldberg and J. M. Mayer, Nat. Chem., 2012, 4, 498 CrossRef PubMed.
- (a) M.-T. Zhang, Z. Chen, P. Kang and T. J. Meyer, J. Am. Chem. Soc., 2013, 135, 2048 CrossRef PubMed; (b) Z. Chen and T. J. Meyer, Angew. Chem., Int. Ed., 2013, 52, 700 CrossRef PubMed; (c) T. Zhang, C. Wang, S. Liu, J.-L. Wang and W. Lin, J. Am. Chem. Soc., 2014, 136, 273 CrossRef PubMed; (d) D. L. Gerlach, S. Bhagan, A. A. Cruce, D. B. Burks, I. Nieto, H. T. Truong, S. P. Kelley, C. J. Herbst-Gervasoni, K. L. Jernigan and M. K. Bowman, et al. , Inorg. Chem., 2014, 53, 12689 CrossRef PubMed; (e) M. K. Coggins, M.-T. Zhang, Z. Chen, N. Song and T. J. Meyer, Angew. Chem., Int. Ed., 2014, 53, 12226 CrossRef PubMed; (f) P. Garrido-Barros, I. Funes-Ardoiz, S. Drouet, J. Benet-Buchholz, F. Maseras and A. Llobet, J. Am. Chem. Soc., 2015, 137, 6758 CrossRef PubMed; (g) L.-L. Zhou, T. Fang, J.-P. Cao, Z.-H. Zhu, X.-T. Su and S.-Z. Zhan, J. Power Sources, 2015, 273, 298 CrossRef; (h) X.-J. Su, M. Gao, L. Jiao, R.-Z. Liao, P. E. M. Siegbahn, J.-P. Cheng and M.-T. Zhang, Angew. Chem., Int. Ed., 2015, 54, 4909 CrossRef PubMed; (i) F. Yu, F. Li, J. Hu, L. Bai, Y. Zhu and L. Sun, Chem. Commun., 2016, 52, 10377 RSC; (j) A. Prevedello, I. Bazzan, N. Dalle Carbonare, A. Giuliani, S. Bhardwaj, C. Africh, C. Cepek, R. Argazzi, M. Bonchio and S. Caramori, et al. , Chem. – Asian J., 2016, 11, 1281 CrossRef PubMed; (k) T.-T. Li and Y.-Q. Zheng, Dalton Trans., 2016, 45, 12685 RSC; (l) L. A. Stott, K. E. Prosser, E. K. Berdichevsky, C. J. Walsby and J. J. Warren, Chem. Commun., 2017, 53, 651 RSC; (m) S. J. Koepke, K. M. Light, P. E. VanNatta, K. M. Wiley and M. T. Kieber-Emmons, J. Am. Chem. Soc., 2017, 139, 8586 CrossRef PubMed; (n) K. J. Fisher, K. L. Materna, B. Q. Mercado, R. H. Crabtree and G. W. Brudvig, ACS Catal., 2017, 7, 3384 CrossRef.
- (a) G. T. Musie, X. Li and D. R. Powell, Inorg. Chim. Acta, 2003, 348, 69 CrossRef; (b) S. Nestke, M. Kügler, J. Scholz, M. Wilken, C. Jooss and I. Siewert, Eur. J. Inorg. Chem., 2017, 2017, 3376 CrossRef.
- R. Matheu, M. Z. Ertem, J. Benet-Buchholz, E. Coronado, V. S. Batista, X. Sala and A. Llobet, J. Am. Chem. Soc., 2015, 137, 10786 CrossRef PubMed.
- A. M. Appel and M. L. Helm, ACS Catal., 2014, 4, 630 CrossRef.
- P. Zanello, C. Nervi and F. Fabrizi de Biani, Inorganic Electrochemistry: Theory, Practice and Application, RSC Pub., Cambridge, UK, 2012 Search PubMed.
- (a) J. J. Concepcion, J. W. Jurss, J. L. Templeton and T. J. Meyer, J. Am. Chem. Soc., 2008, 130, 16462 CrossRef PubMed; (b) J. J. Concepcion, J. W. Jurss, M. K. Brennaman, P. G. Hoertz, A. O. T. Patrocinio, N. Y. Murakami Iha, J. L. Templeton and T. J. Meyer, Acc. Chem. Res., 2009, 42, 1954 CrossRef PubMed; (c) L.-P. Wang, Q. Wu and T. Van Voorhis, Inorg. Chem., 2010, 49, 4543 CrossRef PubMed.
- (a) S. Romain, L. Vigara and A. Llobet, Acc. Chem. Res., 2009, 42, 1944 CrossRef PubMed; (b) L. Duan, F. Bozoglian, S. Mandal, B. Stewart, T. Privalov, A. Llobet and L. Sun, Nat. Chem., 2012, 4, 418 CrossRef PubMed.
- I. Funes-Ardoiz, P. Garrido-Barros, A. Llobet and F. Maseras, ACS Catal., 2017, 7, 1712 CrossRef.
- C. Amatore, J. Pinson, J. M. Savéant and A. Thiebault, J. Electroanal. Chem. Interfacial Electrochem., 1979, 107, 59 CrossRef.
Footnote |
| † Electronic supplementary information (ESI) available. See DOI: 10.1039/c8dt01323c |
| This journal is © The Royal Society of Chemistry 2018 |

