A novel PTP1B inhibitor extracted from Ganoderma lucidum ameliorates insulin resistance by regulating IRS1-GLUT4 cascades in the insulin signaling pathway
Zhou
Yang
a,
Fan
Wu
a,
Yanming
He
b,
Qiang
Zhang
b,
Yuan
Zhang
c,
Guangrong
Zhou
a,
Hongjie
Yang
b and
Ping
Zhou
 *a
*a
aState Key Laboratory of Molecular Engineering of Polymers, Department of Macromolecular Science, Fudan University, Shanghai 200433, P. R. China. E-mail: pingzhou@fudan.edu.cn; Fax: (+86) 21-55664038; Tel: (+86)21-55664038
bYueyang Hospital of Integrated Traditional Chinese and Western Medicine, Shanghai University of Traditional Chinese Medicine, Shanghai 200437, P. R. China
cDepartment of Medicine, St Vincent's Hospital, University of Melbourne, Fitzroy, Victoria 3065, Australia
First published on 24th November 2017
Abstract
Insulin resistance caused by the overexpression of protein tyrosine phosphatase 1 B (PTP1B) as well as the dephosphorylation of its target is one of the main causes of type 2 diabetes (T2D). A newly discovered proteoglycan, Fudan-Yueyang Ganoderma lucidum (FYGL) extracted from Ganoderma lucidum, was first reported to be capable of competitively inhibiting PTP1B activity in vitro in our previous work. In the present study, we sought to reveal the mechanism of PTP1B inhibition by FYGL at the animal and cellular levels. We found that FYGL can decrease blood glucose, reduce body weight and ameliorate insulin resistance in ob/ob mice. Decrease of PTP1B expression and increase of the phosphorylation of PTP1B targets in the insulin signaling pathway of skeletal muscles were observed. In order to clearly reveal the underlying mechanism of the hypoglycemic effect caused by FYGL, we further investigated the effects of FYGL on the PTP1B-involved insulin signaling pathway in rat myoblast L6 cells. We demonstrated that FYGL had excellent cell permeability by using a confocal laser scanning microscope and a flow cytometer. We found that FYGL had a positive effect on insulin-stimulated glucose uptake by using the 2-deoxyglucose (2-DG) method. FYGL could inhibit PTP1B expression at the mRNA level, phosphorylating insulin receptor substrate-1 (IRS1), as well as activating phosphatidylinositol-3 kinase (PI3K) and protein kinase B (Akt). Finally, FYGL increased the phosphorylation of adenosine monophosphate-activated protein kinase (AMPK) and consequently up-regulated the expression of glucose transporter type 4 (GLUT4), promoting GLUT4 transportation to the plasma membrane in PTP1B-transfected L6 cells. Our study provides theoretical evidence for FYGL to be potentially used in T2D management.
Introduction
Today, more and more people around the world are suffering from type 2 diabetes (T2D). As a vital issue in T2D, insulin resistance is characterized by the deficiency of response to insulin, which influences glucose uptake and utilization in peripheral tissues.1 Usually, T2D is caused by the dysregulation of the insulin signaling pathway.As a member of the insulin receptor substrate (IRS) family, insulin receptor substrate-1 (IRS1) is a direct physiological substrate of the insulin receptor and plays an important role in insulin signal transmission.2 It has more than 20 potential phosphorylation sites of the tyrosine residue.2 IRS1 is inactive at most times but can be activated by insulin via phosphorylating tyrosine residues. The phosphorylation of IRS1 on tyrosine residues interacts with phosphatidylinositol-3 kinase (PI3K) in the Src-homologous 2 (SH2) domain, which phosphorylates phosphatidyl-inositol 2 phosphates (PIP2) into phosphatidyl-inositol 3 phosphates (PIP3). PI3K then recruits Akt to the plasma membrane through the plextrin homology (PH) domain.3,4 Adenosine monophosphate-activated protein kinase (AMPK) is considered as an energy sensor in eukaryotic cells and organisms, which can be phosphorylated by Akt, finally leading to the translocation of glucose transporter type 4 (GLUT4) to the plasma membrane.5,6 The dephosphorylation of IRS1 on tyrosine residues can potentially inactivate the whole process of insulin signal transduction, leading to insulin resistance.
Protein tyrosine phosphatase 1 B (PTP1B) is an insulin resistance-related protein, and has been regarded as an important target in the management of T2D since 1991.7 As a member of the protein tyrosine phosphatase (PTP) family, PTP1B is widely expressed in insulin-sensitive peripheral tissues such as adipose and muscular tissues. It localizes in the endoplasmic reticulum (ER) of the cells,8 and negatively regulates insulin signal transduction by dephosphorylating IRS on tyrosine residues.9 In insulin-resistant states, an overexpression of PTP1B is found in skeletal muscles, hepatic tissues and adipose tissues.10–12 Since the overexpression of PTP1B can inactivate the whole insulin signaling pathway in vivo, developing PTP1B inhibitors has become a hot topic for the treatment of T2D in recent decades.13
Many PTP1B inhibitors have been reported in recent years, but most of them have poor cell permeability and low bioavailability.14Ganoderma lucidum (G. lucidum), which is also called “Lingzhi” in Chinese, is a well-known Chinese medicinal fungus and has long been used as a traditional Chinese medicine for health.15G. lucidum possesses a wide range of pharmacological functions including anti-cancer and anti-diabetes activities.16–18G. lucidum contains at least 150 components. Among all these components, polysaccharides, proteins and triterpenoids are the most interesting compounds for medicinal research.19 Previously, our laboratory extracted an ingredient from G. lucidum, named FYGL (Fudan-Yueyang G. lucidum), and demonstrated that FYGL has a dominant neutral hyperbranched proteoglycan, and its dominant sequence is shown in Fig. 1.20,21FYGL has been proved to have inhibitory potency on PTP1B activity in vitro. However, the action mechanism of FYGL in vivo is still unclear.
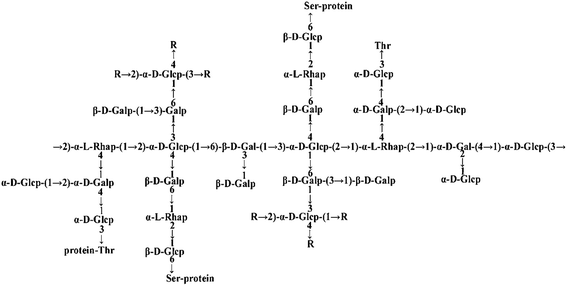 | ||
| Fig. 1 The structure of FYGL. Ara: arabinose, Gal: galactose, Glc: glucose, Rha: rhamnose. Thr: threonine, Ser: serine. The suffixes p and f represent pyranose and furanose, respectively. | ||
In this study, we sought to reveal the mechanism of PTP1B inhibition by FYGL at both animal and cell levels. We found that FYGL can decrease blood glucose and body weight in ob/ob mice, and regulate protein expression and phosphorylation involved in the insulin signaling pathway of skeletal muscle tissues. Moreover, in order to understand the underlying mechanism of FYGL in depth, we selected L6 cell lines which engage in glucose uptake for the study. We demonstrated that FYGL can enhance glucose uptake in L6 cells by regulating the PTP1B-involved insulin signaling pathway from IRS1 to GLUT4.
Materials and methods
Materials
Dried fruiting bodies of G. lucidum were purchased from Leiyunshang Pharmaceutical Co. Ltd (Shanghai, China). Octanol, fluorescein isothiocyanate (FITC), and Triton X-100 were obtained from Aladdin Co. Ltd (Shanghai, China). Dulbecco's modified Eagle's medium (DMEM) and fetal bovine serum (FBS) were purchased from Gibco Co. Ltd (USA). BCA (bicinchoninic acid) kit, PBS, 4% paraformaldehyde, penicillin and streptomycin were acquired from Sangon Co. Ltd (Shanghai, China). Cell counting kit-8 (CCK-8) was purchased from Dojindo Co. Ltd (Shanghai, China). 4′,6-Diamidino-2-phenylindole (DAPI), rhodamine-phalloidin, polylysine, trizol, SYBR green I and glucose uptake assay kit were provided by Yeasen Co. Ltd (Shanghai, China). RIPA lysis buffer and lipofectamine 6000 were bought from Beyotime Co. Ltd (Shanghai, China). FYGL was extracted from G. lucidum according to the protocol proposed in our previous work.20 Ultrapure water was prepared in-house.Animal trials
All animal trial procedures were approved by the Animal Experiments Committee of Medical College, Fudan University, in accordance with China's national law on animal care and use. 10 male eight-week-old wild type (WT) C57BL/6 mice and 50 male eight-week-old obese C57BL/6 (ob/ob) mice were obtained from the Chinese Academy of Sciences, Shanghai Institute of Materia Medica. All animals were housed at 22 ± 2 °C and 45–75% relative humidity with a 12 h light/dark cycle. The 50 ob/ob mice were randomly divided into 5 groups with 10 mice in each group, model, and given FYGL (150, 300, 400 mg kg−1) and metformin (250 mg kg−1) once a day. The 10 WT mice and the model group were treated with equal amounts of saline. Fasting blood glucose (FBG) was measured with a glucose meter once a week, and body weight was measured twice a week. 4 weeks later, all the mice were killed and their skeletal muscle tissues were homogenized. Serum was also isolated and the level of lipid and insulin was estimated by using an ELISA kit (Senbeijia Co. Ltd, Nanjing, China), and the insulin resistance index (IRI) was calculated by eqn (1).22| IRI = FBG (mmol L−1) × insulin level (mU L−1)/22.5. | (1) |
Cell culture
L6 rat skeletal muscle cells were cultured in DMEM supplement with 10% FBS and 1% penicillin–streptomycin at 37 °C under a 5% CO2 atmosphere.CCK-8 test of FYGL toxicity on L6 cells
L6 cells were transferred into 96-well plates with a density of 5 × 10³–1 × 10⁴ cells per well. FYGL at the given concentrations in DMEM with 2% FBS was added into the wells and incubated for 24 h; then the solution was removed, and CCK-8 was added and cultured for another one hour. Each sample was replicated in six wells. The optical density (OD) was measured at 450 nm by using a microplate reader (Bio-Tek, USA) and the cell viability was calculated.Uptake assay of FYGL in L6 cells
Firstly, FYGL was labeled with FITC. 1 mg FITC was dissolved in 1 mL DMSO to form 1 mg mL−1 solution, and then the solution was added into sodium buffer containing 1 mg mL−1FYGL at a volume ratio of 1/10. The mixture was stirred at 4 °C away from light for 24 h. After the reaction, the solution was dialyzed and lyophilized. L6 cells were incubated with FITC–FYGL for 6 h, and then washed with PBS and fixed with 4% paraformaldehyde for 10 min. The fixed cells were permeated with 0.2% Triton X-100/PBS. The cell nucleus was stained with DAPI and the cytoskeleton was stained with rhodamine-phalloidin. The stained cells were mounted on a glass slide for observation with a confocal laser scanning microscope (C2+, Nikon, Japan). In addition, L6 cells were also incubated with FITC–FYGL at various concentrations for 6 h, and then the cell suspensions were analyzed by flow cytometry (Gallios, Beckman Coulter, USA) at channel FL1 (excitation wavelength at 488 nm and emission wavelength at 525 nm).Glucose uptake assay in L6 cells
L6 cells were transferred into 96-well plates with a density of 5 × 10³–1 × 10⁴ cells per well overnight, and then starved in serum-free media for 4 h to increase the glucose demand. After that, FYGL at the given concentrations was added into the wells and the plates were incubated for 24 h, followed by stimulation with 200 nM insulin for 10 min. Furthermore, 10 μL 2-deoxyglucose (2-DG) was added into the wells and incubated for 20 min, and then the cells were washed with ice-cold PBS three times. The cells were lysed with nicotinamide adenine dinucleotide phosphate (NADP) extraction buffer containing 1% Triton X-100, and incubated at 80 °C for 10 min. Then 1 μL glucose 6-phosphate dehydrogenase (G6PDH) enzyme was added into 10 μL cell lysate and incubated at 37 °C for 1 h. Finally, the fluorescence intensity of nicotinamide adenine dinucleotide phosphate hydrogen (NADPH) was recorded by using a fluorescence microplate reader (excitation wavelength at 530 nm and emission wavelength at 585 nm), and the relative glucose uptake was calculated finally.Cell transient transfection with PTP1B plasmid
L6 cells were transferred into 6-well plates with a density of 2.5 × 10⁵–5 × 10⁵ cells per well for 12 to 16 h; then the cells were transfected with 2.5 μg PTP1B plasmid (synthesized by Xinjia Bio Co). After 6 h, the opti-MEM containing plasmid was removed, and the cells were washed with PBS three times.RNA extraction and quantitative PCR
RNA was released from L6 cells using trizol reagent, and then reverse transcribed to complementary DNA (cDNA) under the action of a reverse transcription enzyme. SYBR Green I including Taq enzyme and a series of primers β-actin (as the internal reference), PTP1B and GLUT4 were mixed with cDNA, proliferated on a qPCR instrument (Bio-Rad, Germany), and then the melt and proliferation curves were analyzed. All the primers were synthesized by Sangon Co, and their sequences are as follows: rat β-actin, 5′-CCCATCTATGAGGGTTACGC-3′ and 5′-TTTAATGTCA-CGCACGATTTC-3′; rat PTP1B, 5′-TGTGATCGAGGGTGCAAAG-3′ and 5′-CT-CCAGGTCTTCATGGGAAAG-3′; rat GLUT4, 5′-GCGTGGGTTTCGTGCTTT-3′ and 5′-GGTAGTTCCCGATGGCTC-3′. The relative expression of mRNA was determined by eqn (2).23| CmRNA = 2−Δ(ΔCt) | (2) |
Protein extraction and western blot
Skeletal muscle tissues of mice and L6 cells were lysed in RIPA lysis buffer (50 mM Tris at pH 7.4, 150 mM NaCl, 1% Triton X-100, 1% sodium deoxycholate, 0.1% SDS, sodium orthovanadate, sodium fluoride, EDTA and leupeptin, 1% phenylmethanesulfonyl fluoride) and centrifuged (12![[thin space (1/6-em)]](https://www.rsc.org/images/entities/char_2009.gif) 000g, 10 min, 4 °C). The cell lysates were separated by 8% SDS-PAGE and transferred to a polyvinylidene fluoride membrane, immunoblotted with the primary rabbit monoclonal antibodies anti-IRS1, anti-IRS1 (phospho Ser307), anti-PI3K, anti-Akt, anti-Akt (phospho Ser473), anti-AMPK, anti-AMPK (phospho Thr172) and anti-GAPDH (all of them from Cell Signaling, USA), and anti-IRS1 (phospho Tyr612) and anti-GLUT4 (both from ABCAM, Cambridge, UK), and then incubated with secondary goat anti-rabbit antibody (Cell Signaling, USA). The bands were visualized with an enhanced chemiluminescence solution (ECL, Biotanon) and detected with an Image Lab camera (Bio-Rad, Germany), and then quantified by densitometry scanning with the ImageJ software.
000g, 10 min, 4 °C). The cell lysates were separated by 8% SDS-PAGE and transferred to a polyvinylidene fluoride membrane, immunoblotted with the primary rabbit monoclonal antibodies anti-IRS1, anti-IRS1 (phospho Ser307), anti-PI3K, anti-Akt, anti-Akt (phospho Ser473), anti-AMPK, anti-AMPK (phospho Thr172) and anti-GAPDH (all of them from Cell Signaling, USA), and anti-IRS1 (phospho Tyr612) and anti-GLUT4 (both from ABCAM, Cambridge, UK), and then incubated with secondary goat anti-rabbit antibody (Cell Signaling, USA). The bands were visualized with an enhanced chemiluminescence solution (ECL, Biotanon) and detected with an Image Lab camera (Bio-Rad, Germany), and then quantified by densitometry scanning with the ImageJ software.
Immunofluorescence assay for GLUT4 translocation
L6 cells were seeded on glasses and analyzed using the immunofluorescence assay as follows: the cells were fixed with 4% paraformaldehyde, and then permeated with 0.2% Triton X-100/PBS and blocked with 3% goat serum/PBS for 30 min. Afterwards, the cells were incubated with GLUT4 antibody for 1 h and secondary goat anti-rabbit antibody (Alexa Flour 647 conjugate, Cell Signaling) for another 1 h, and then stained with DAPI. The images were obtained using a confocal laser scanning microscope.Inhibition measurement of T-cell protein tyrosine phosphatase (TC-PTP)
50 μL 40 μg mL−1 TC-PTP in Tris-buffer (TBS, pH = 7.5) was added into 50 μL FYGL at designated concentrations in TBS, and incubated for 10 min at room temperature, and then 50 μL 1 mM p-nitrophenyl phosphate (pNPP, as substrate) in TBS was added into the mixed solution and incubated for 30 min at 37 °C. The reaction was finally terminated with 50 μL 3M NaOH. The OD at 405 nm was measured using a microplate reader (Bio-Tek, USA) and IC50 (the concentration of the inhibitor at which it has a 50% inhibition of the initial one) was calculated.Statistical analysis
All data are presented as means ± S.E. One-way ANOVA test was performed to analyze the statistical significance between two groups. A difference is considered to be statistically significant when the p value <0.05.Results
T2D treatment with FYGL in vivo
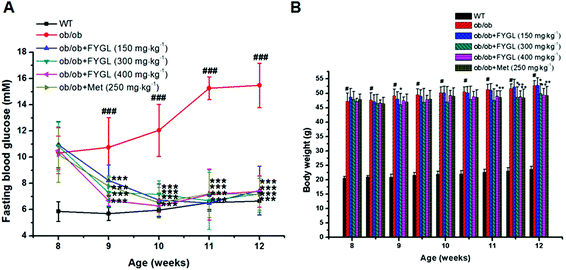
Saline, FYGL (150, 300, 400 mg kg−1) and metformin (250 mg kg−1) were administered orally to WT and ob/ob mice for 4 weeks. As shown in Fig. 2A, FBG was decreased after one week of treatment with FYGL and metformin in ob/ob mice, and recovered to the FBG level of WT mice three weeks later. The body weight of ob/ob mice compared with that of WT mice is shown in Fig. 2B. Although the body weight of ob/ob mice treated with 150 mg kg−1FYGL was not significantly decreased, it was decreased with a relatively higher dose (300, 400 mg kg−1) of FYGL after 3 weeks, which was similar to that of ob/ob mice treated with 250 mg kg−1 metformin. As shown in Table 1, the serum lipid level was reduced after treatment with FYGL for 4 weeks. A high level of insulin was found in ob/ob mice, while it was decreased when treated with a high dose (400 mg kg−1) of FYGL or metformin for 4 weeks, and the IRI was also significantly ameliorated.| Parameter | Lipid (pg mL−1) | Insulin (mU L−1) | IRI |
|---|---|---|---|
| WT | 346.94 ± 22.87* | 18.66 ± 2.32*** | 5.51 ± 1.25*** |
| ob/ob | 412.82 ± 5.16 | 52.31 ± 5.68 | 35.81 ± 7.81 |
| FYGL (150 mg kg−1) | 393.32 ± 0.59* | 55.76 ± 7.14 | 18.45 ± 6.97** |
| FYGL (300 mg kg−1) | 389.52 ± 8.37* | 50.22 ± 4.46 | 16.04 ± 4.46*** |
| FYGL (400 mg kg−1) | 363.59 ± 0.36** | 41.09 ± 5.35* | 13.47 ± 3.93*** |
| Met (250 mg kg−1) | 362.17 ± 22.21* | 38.18 ± 6.02* | 12.18 ± 3.96*** |
Effects of FYGL on IRS1-GLUT4 cascades in vivo
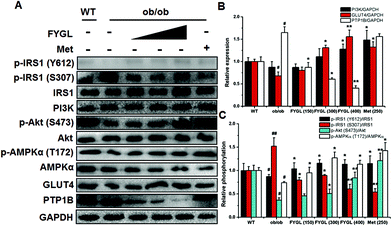
In light of the evidence that FYGL regulated blood glucose and body weight in ob/ob mice, we extracted skeletal muscle tissues from mice, and analyzed the expression and phosphorylation of proteins involved in the insulin signaling pathway. As shown in Fig. 3, FYGL inhibited the expression of PTP1B in ob/ob mice, and up-regulated the phosphorylation of IRS1 on Tyr612 as well as down-regulated the phosphorylation of IRS1 on Ser307. In the downstream of IRS1, FYGL activated PI3K/Akt cascades and enhanced the phosphorylation of AMPK on Thr172, and finally increased the expression of GLUT4. To clearly reveal the mechanism of FYGL regulating blood glucose, the effect of FYGL on L6 cells is necessarily investigated.Safety of FYGL on L6 cells
L6 cells were incubated with FYGL at the given concentrations from 0 to 1000 μg mL−1 for 24 h. As shown in Fig. 4, the cell viability remained similar to that of the control group (without FYGL) with the concentration of FYGL up to 200 μg mL−1, which provided an indication of the optimal concentration region for the following work. Although the cell viability was decreased when the concentration of FYGL ranged from 300 to 1000 μg mL−1, it still maintained 90% or so, indicating that FYGL was safe for L6 cells in a wide concentration range.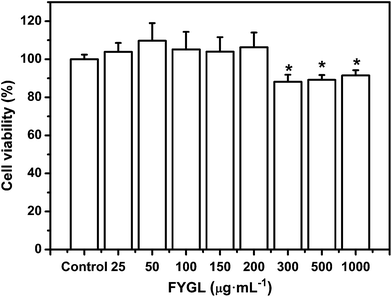 | ||
| Fig. 4 Cell viability in the absence or presence of 25, 50, 100, 150, 200, 300, 500 and 1000 μg mL−1FYGL for 24 h at 37 °C. Data are presented as means ± S.E. (n = 6). *p < 0.05 versus control group. | ||
Cellular uptake of FYGL
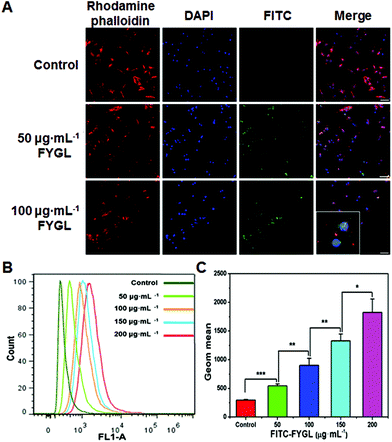
Fig. 5A exhibits the uptake of FYGL at various concentrations in L6 cells demonstrated by confocal laser scanning microscopy. It is found that FYGL (labeled with FITC green fluorescence) was located in L6 cells after 6 h incubation, demonstrating that FYGL can be easily absorbed by L6 cells. Fig. 5B further demonstrates the uptake of FYGL by using the flow cytometry method based on the fluorescence amount of FITC–FYGL, in which as the concentration of FITC–FYGL increased, the peak position along the x-axis gradually moved toward the right. Fig. 5C alternatively depicts the absorption of FYGL by L6 cells versus Geom mean which was increased in a dose-dependent manner.Inhibition of PTP1B mRNA expression in L6 cells by FYGL
Because PTP1B is overexpressed in the peripheral tissues in T2D, the PTP1B-transfected L6 cells were selected for investigation in this work. The cycle time (Ct) was obtained from each proliferation curve (data not shown), and the relative expression of PTP1B mRNA was calculated by eqn (2). Table 2 shows the relative expression of PTP1B mRNA in L6 cells; a significant overexpression of PTP1B was observed in PTP1B-transfected cells. Interestingly, FYGL markedly diminished the expression of PTP1B mRNA in L6 cells in a dose-dependent manner until saturation when the concentration was higher than 100 μg mL−1, which possibly had a positive regulation on the subsequent insulin signaling pathway.| Transfected with PTP1B | − | + | + | + | + |
|---|---|---|---|---|---|
| $The expression of PTP1B mRNA in normal L6 cells is normalized to 1.0, and the group of L6 cells transfected with PTP1B in the absence of FYGL is regarded as the control. Data are expressed as means ± S.E. (n = 5). ***p < 0.001 versus control group, and ###p < 0.001 versus the former group. | |||||
| FYGL (μg mL−1) | 0 | 0 | 50 | 100 | 150 |
| Relative expression of PTP1B mRNA | 1.0 ± 0.12 | 1510 ± 99 | 209 ± 31 | 42 ± 6 | 41 ± 5 |
| ### | *** | *** | *** | ||
| ### | ### | ||||
Enhancement of glucose uptake in L6 cells by FYGL
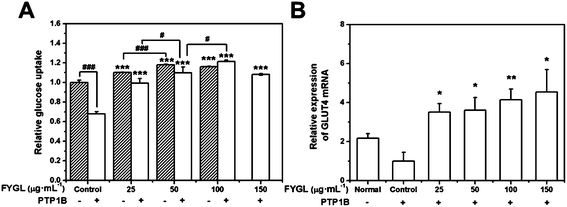
Fig. 6A shows the dependence of relative glucose uptake on FYGL concentration from 0 to 150 μg mL−1 in L6 cells under insulin stimulation. It is found that FYGL promoted L6 cells to absorb glucose dose-dependently until saturation in normal (PTP1B−) cells. In overexpressed PTP1B (PTP1B+) cells, the relative glucose uptake was much less than that in PTP1B− cells. However, FYGL treatment remarkably enhanced the glucose uptake in a dose-dependent manner in PTP1B+ cells. When the concentration of FYGL was higher than 100 μg mL−1, the glucose uptake reached saturation in PTP1B+ cells. Therefore, it is important to further investigate the effect of FYGL on a specific signaling pathway in L6 cells by using qPCR and western blot methods.Effect of FYGL on the expression of GLUT4 mRNA
The relative expression of GLUT4 mRNA was calculated according to eqn (2). Fig. 6B shows the relative expression of GLUT4 mRNA in the absence and presence of FYGL. From Fig. 6B, FYGL significantly up-regulated the expression of GLUT4 mRNA in PTP1B+ cells, compared with the control group.Effects of FYGL on IRS1-GLUT4 cascades in vitro
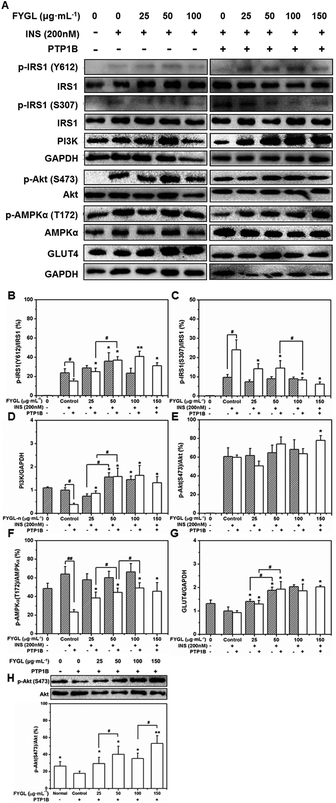
Fig. 7A shows the western blot bands reflecting the expression of PTP1B-involved proteins. The phosphorylation of IRS1 and Akt occurred only with insulin stimulation (Fig. 7A). Normally, insulin releases IRS1 from the plasma membrane to the cytoplasm after binding to the insulin receptor (InR), and phosphorylates IRS1 on tyrosine residues as well as on serine and threonine residues, among which, the phosphorylation on tyrosine residues can activate insulin signal transduction, while the phosphorylation on serine or threonine residues are negative feedback regulators.24,25Fig. 7B shows that FYGL improved the phosphorylation of IRS1 on Tyr612 in PTP1B− cells when the FYGL concentration was lower than 50 μg mL−1. PTP1B can dephosphorylate IRS1 on tyrosine residues, thus inhibiting the whole insulin signaling pathway.26 Herein, the overexpression of PTP1B noticeably inhibited the phosphorylation of IRS1 on Tyr612, compared with that in PTP1B− cells. However, with FYGL treatment in PTP1B+ cells, the phosphorylation of IRS1 on Tyr612 was increased in a dose-dependent manner until saturation when the FYGL concentration was higher than 100 μg mL−1.As shown in Fig. 7C, FYGL seemed to have no influence on the phosphorylation of IRS1 on Ser307 in PTP1B− cells even under high concentration. However, when the overexpression of PTP1B caused more phosphorylation of IRS1 on Ser307, FYGL gradually alleviated this effect at the concentration range from 25 to 150 μg mL−1, demonstrating that FYGL can inhibit the phosphorylation of IRS1 on Ser307.
As shown in Fig. 7D, the expression of PI3K in PTP1B− cells was increased when the concentration of FYGL was higher than 50 μg mL−1. In PTP1B+ cells, the overexpression of PTP1B clearly decreased the expression of PI3K, while in the addition of FYGL from 25 to 150 μg mL−1, the expression of PI3K was increased until saturation finally.
From Fig. 7E and 6F, FYGL had no clear impact on the phosphorylation of Akt and AMPKα in PTP1B− cells, which was similar to the previous results of the phosphorylation of IRS1 on Ser307. It is found that the phosphorylation of Akt on Ser473 was less sensitive to FYGL, compared with the expression of PI3K in PTP1B+ cells. It has been reported that the phosphorylation extent of Akt is more sensitive to insulin than other factors, and can be enhanced with insulin concentration.27 Therefore, to eliminate the interference of insulin at high concentration, we decreased the concentration of insulin to 100 nM to examine the phosphorylation extent of Akt on Ser473 under the same conditions. As can be seen in Fig. 7H, the dephosphorylation effect of PTP1B on Akt was clearly reflected in PTP1B+ cells, and the positive effect of phosphorylation by FYGL was also revealed. High concentration of insulin might cover up the effect of FYGL in Fig. 7E. Furthermore, in AMPK cascade, the phosphorylation level on Thr172 was very low in PTP1B+ cells (Fig. 7F); however, FYGL increased the phosphorylation of AMPKα in a dose-dependent manner until saturation when the FYGL concentration was higher than 100 μg mL−1.
GLUT4 is a transporter protein widely expressed in mammalian myocytes; its function is to transfer glucose from blood into cells.6Fig. 7G shows that the expression of GLUT4 was not affected by insulin stimulation, but increased when the concentration of FYGL was from 25 to 150 μg mL−1. Therefore we investigated GLUT4 translocation influenced by PTP1B and FYGL as follows.
Effect of FYGL on GLUT4 translocation
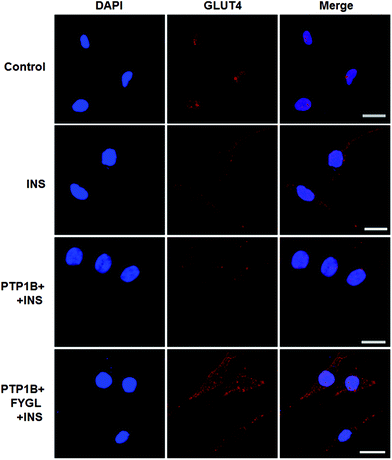
The overexpression of PTP1B inhibits the translocation of GLUT4 in cells.28Fig. 8 shows that GLUT4 translocated into the plasma membrane in PTP1B− cells under insulin stimulation, while the translocation process was inhibited in PTP1B+ cells. However, 150 μg mL−1FYGL recovered the translocation and made more GLUT4 translocate into the plasma membrane in PTP1B+ cells.Inhibitory efficiency of TC-PTP by FYGL
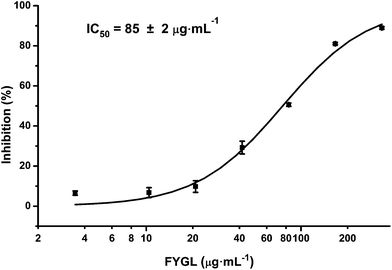
PTP1B and TC-PTP share 74% homology in the catalytic domain, while TC-PTP is important for the control of inflammation.29Fig. 9 shows the inhibitory curve of TC-PTP by FYGL, and TC-PTP inhibition IC50 was 85 ± 2 μg mL−1. Compared with our previous result that PTP1B inhibition IC50 is only 5.12 ± 0.05 μg mL−1, by FYGL,20 the inhibitory efficiency of TC-PTP by FYGL was much lower, suggesting that FYGL has high selectivity for PTP1B inhibition.Discussion and conclusions
FYGL was extracted from an edible mushroom, which has good biocompatibility and affinity with the human body. Many small molecule PTP1B inhibitors have poor cell permeability; thus they cannot be used in the human body.30 As a novel macromolecular PTP1B inhibitor, FYGL was demonstrated to be a neutral hyperbranched proteoglycan consisting of 4 monosaccharide residues and 17 amino acid residues;21 the special structure exhibited good amphiphilic property to support cellular absorption and transportation in vivo. Moreover, FYGL exhibited highly selective inhibition for PTP1B rather than TC-PTP, suggesting that FYGL is very safe for health. Compared with WT mice, ob/ob mice exhibit high blood glucose and heavy weight naturally, while in this study, treatment with FYGL for 4 weeks significantly decreased blood glucose and body weight, and ameliorated insulin resistance by decreasing the IRI in ob/ob mice. Diabetes is closely related to obesity associated with high serum lipid;31 herein, FYGL decreased the lipid level in ob/ob mice for an anti-diabetes activity, along with a loss of body weight. The functional mode of FYGL was analyzed in skeletal muscle to further identify the effect in vivo. PTP1B is overexpressed in skeletal muscle and liver tissues in ob/ob mice, and the reduction of PTP1B can promote insulin-dependent signaling.32 Herein, FYGL dramatically down-regulated the expression of PTP1B in the skeletal muscle tissues of ob/ob mice, so the function mechanism of FYGL in skeletal muscle cells was possibly associated with PTP1B-involved IRS1/PI3K/Akt/AMPK/GLUT4 cascades in the signaling pathway.IRS1, widely expressed in mammalian myocytes, is a docking protein for InR.24 Ding et al. reported that a polyphenol drug (named norathyriol) up-regulates the phosphorylation level of IRS1 on tyrosine residues through the inhibition of PTP1B in myoblasts.33 In the current study, the overexpression of PTP1B inactivated IRS1 by dephosphorylation on Tyr612 and phosphorylation on Ser307, while in PTP1B+ cells and skeletal muscles of ob/ob mice, FYGL can not only improve the phosphorylation of IRS1 on Tyr612, but also weaken the phosphorylation of IRS1 on Ser307. The function may be related to the inhibition of PTP1B expression, which results in a positive regulation of downstream cascades.
PI3K/Akt cascades play a crucial role in insulin signal transduction.34 However, insulin resistance and abnormal accumulation of fatty acid often weaken the insulin signal transduction of IRS1/Akt cascades in muscle tissues.35 It has been reported that the overexpression of PTP1B can attenuate the expression of PI3K and the phosphorylation of Akt2 in vivo,36 and a high expression of PTP1B mRNA can also negatively modulate the insulin-stimulated phosphorylation of Akt in human skeletal muscles.37 In this work, we found that the overexpression of PTP1B diminished the expression of PI3K and the phosphorylation of Akt on Ser473, while FYGL activated PI3K/Akt cascades through down-regulating the expression of PTP1B, which is similar to fumosorinone, an anti-diabetic drug improving the phosphorylation of Akt via inhibiting the expression of PTP1B.38
AMPK is composed of a catalytic α subunit and regulatory β/γ subunits, among which AMPKα is widely distributed in tissues.5 AMPKα can be activated by both phosphorylation on Thr172 and allosteric modification, but its activity is always suppressed by insulin resistance.39 In this study, the phosphorylation of AMPKα on Thr172 was remarkably suppressed in ob/ob mice and PTP1B+ cells. Interestingly, FYGL can up-regulate the phosphorylation of AMPKα in PTP1B+ cells and skeletal muscles in ob/ob mice. It was reported that salidroside can also enhance the phosphorylation of Akt and AMPKα in the skeletal muscle cells of db/db mice,40 Src-homology 2-domain-containing phosphatase (SHP)-1 in PTPs down-regulates GLUT4 expression at the mRNA and protein level in L6 cells, and transfection with the interfering mutant of SHP-1 can up-regulate GLUT4 expression and increase glucose uptake, because GLUT4 expression is a major determinant in muscle glucose transport.41 As a downstream protein of AMPK, GLUT4 gene expression can be increased by phosphorylating histone deacetylase 5 in myocytes.42 The in vivo evidence supports the functional mode that FYGL successfully activates AMPKα, and consequently increases GLUT4 expression at the mRNA and protein level. Moreover, since PTP1B is a negative modulator in GLUT4 translocation,28 the capacity of glucose uptake is seriously inhibited in PTP1B+ cells. In our work, FYGL increased GLUT4 expression and promoted GLUT4 translocation by inhibiting PTP1B, thus enhancing glucose uptake in L6 cells. This finding strongly supported animal trial results and explained that FYGL can regulate blood glucose in an insulin resistance model.
In summary, the present study systematically investigated the pharmacological effects of FYGL on the insulin signaling pathway in the skeletal muscle tissues of ob/ob mice and L6 cells. We demonstrated that FYGL had hypoglycemic and weight loss effects on ob/ob mice, and found that FYGL successfully inhibited the expression of PTP1B in the skeletal muscle tissues of ob/ob mice and in PTP1B-transfected cells, then activated IRS1, PI3K, Akt and AMPKα, up-regulated the GLUT4 amount as revealed by augmented mRNA and protein expression, and promoted GLUT4 translocation to the plasma membrane, therefore enhancing glucose uptake in L6 cells and decreasing blood glucose in ob/ob mice. Our work illustrated the underlying mechanism of FYGL against insulin resistance, and provided further insight into therapeutic strategies for T2D.
Abbreviations
| 2-DG | 2-Deoxyglucose |
| Akt | Protein kinase B |
| AMPK | Adenosine monophosphate-activated protein kinase |
| ER | Endoplasmic reticulum |
| FBG | Fasting blood glucose |
| FYGL | Fudan-Yueyang Ganoderma lucidum |
| GLUT4 | Glucose transporter type 4 |
| InR | Insulin receptor |
| IRS | Insulin receptor substrate |
| OD | Optical density |
| PH | Plextrin homology |
| Phospho | Phosphorylation |
| PI3K | Phosphatidylinositol-3 kinase |
| PTP1B | Protein tyrosine phosphatase 1 B |
| Ser | Serine |
| SH2 | Src-homologous 2 |
| SHP | Src-homology 2-domain-containing phosphatase |
| T2D | Type 2 diabetes |
| Thr | Threonine |
| Tyr | Tyrosine |
Author contributions
Z. Y., F. W., and G. Z. performed the experiments. Z. Y., Y. H. and Q. Z. analyzed the data. Z. Y. and P. Z. designed all the experiments. Z. Y., Y. Z. and P. Z. wrote the manuscript. H. Y. and P. Z. provided the funds.Conflicts of interest
The authors claim that the researchers in this study have no conflict of interest.Acknowledgements
This work was supported by the Natural Science Foundation of China (Nos. 21374022 and 81374032), the Senior Visiting Scholar Foundation of Key Laboratory of Fudan University (No. 15FGJ03), the Science and Technology Innovation Action Plan of STCSM (No. 11DZ1971802), and the Scientific Program of Shanghai Municipal Public Health Bureau (No. 2010231).References
- H. E. Lebovitz, Exp. Clin. Endocrinol. Diabetes, 2001, 109, S135–S148 CrossRef CAS PubMed.
- X. J. Sun, P. Rothenberg, C. R. Kahn, J. M. Backer, E. Araki, P. A. Wilden, D. A. Cahill, B. J. Goldstein and M. F. White, Nature, 1991, 352, 73–77 CrossRef CAS PubMed.
- J. M. Backer, M. G. Myers, S. E. Shoelson, D. J. Chin, X. J. Sun, M. Miralpeix, P. Hu, B. Margolis, E. Y. Skolnik, J. Schlessinger and M. F. White, EMBO J., 1992, 11, 3469–3479 CAS.
- P. Pagesy, Y. Fardini, T. T. Nguyen, M. Lohmann, C. Pierre-Eugene, N. Tennagels and T. Issad, Arch. Physiol. Biochem., 2016, 122, 54–60 CrossRef CAS PubMed.
- G. R. Steinberg and B. E. Kemp, Physiol. Rev., 2009, 89, 1025–1078 CrossRef CAS PubMed.
- S. Rea and D. E. James, Diabetes, 1997, 46, 1667–1677 CrossRef CAS PubMed.
- P. L. Rothenberg, W. S. Lane, A. Karasik, J. Backer, M. White and C. R. Kahn, J. Biol. Chem., 1991, 266, 8302–8311 CAS.
- J. V. Frangioni, P. H. Beahm, V. Shifrin, C. A. Jost and B. G. Néel, Cell, 1992, 68, 545–560 CrossRef CAS PubMed.
- K. A. Kenner, E. Anyanwu, J. M. Olefsky and J. Kusari, J. Biol. Chem., 1996, 271, 19810–19816 CrossRef CAS PubMed.
- F. Ahmad and B. J. Goldstein, Metab., Clin. Exp., 1995, 44, 1175–1184 CrossRef CAS PubMed.
- C. Taghibiglou, F. Rashid-Kolvear, S. C. Van Iderstine, H. Le-Tien, I. G. Fantus, G. F. Lewis and K. Adeli, J. Biol. Chem., 2002, 277, 793–803 CrossRef CAS PubMed.
- F. Ahmad, R. V. Considine, T. L. Bauer, J. P. Ohannesian, C. C. Marco and B. J. Goldstein, Metab., Clin. Exp., 1997, 46, 1140–1145 CrossRef CAS.
- B. G. Szczepankiewicz, G. Liu, P. J. Hajduk, C. Abad-Zapatero, Z. H. Pei, Z. L. Xin, T. H. Lubben, J. M. Trevillyan, M. A. Stashko, S. J. Ballaron, H. Liang, F. Huang, C. W. Hutchins, S. W. Fesik and M. R. Jirousek, J. Am. Chem. Soc., 2003, 125, 4087–4096 CrossRef CAS PubMed.
- A. K. Tamrakar, C. K. Maurya and A. K. Rai, Expert Opin. Ther. Pat., 2014, 24, 1101–1115 CrossRef CAS PubMed.
- P. Batra, A. K. Sharma and R. Khajuria, Int. J. Med. Mushrooms, 2013, 15, 127–143 CrossRef CAS PubMed.
- M. M. Martinez-Montemayor, R. R. Acevedo, E. Otero-Franqui, L. A. Cubano and S. F. Dharmawardhane, Nutr. Cancer, 2011, 63, 1085–1094 CrossRef CAS PubMed.
- B. Boh, Recent Pat. Anti-Cancer Drug Discovery, 2013, 8, 255–287 CrossRef CAS PubMed.
- W. Cui, Y. H. Cheng, L. L. Geng, D. S. Liang, T. J. Hou and M. J. Ji, J. Chem. Inf. Model., 2013, 53, 1157–1167 CrossRef CAS PubMed.
- H. T. Ma, J. F. Hsieh and S. T. Chen, Phytochemistry, 2015, 114, 109–113 CrossRef CAS PubMed.
- B.-S. Teng, C.-D. Wang, H.-J. Yang, J.-S. Wu, D. Zhang, M. Zheng, Z.-H. Fan, D. Pan and P. Zhou, J. Agric. Food Chem., 2011, 59, 6492–6500 CrossRef CAS PubMed.
- D. Pan, L. Q. Wang, C. H. Chen, B. W. Hu and P. Zhou, Carbohydr. Polym., 2015, 117, 106–114 CrossRef CAS PubMed.
- R. C. Turner, R. R. Holman, D. Matthews, T. D. R. Hockaday and J. Peto, Metab., Clin. Exp., 1979, 28, 1086–1096 CrossRef CAS PubMed.
- H. A. Erlich, D. H. Gelfand and R. K. Saiki, Nature, 1988, 331, 461–462 CrossRef.
- X. J. Sun, M. Miralpeix, M. G. Myers, E. M. Glasheen, J. M. Backer, C. R. Kahn and M. F. White, J. Biol. Chem., 1992, 267, 22662–22672 CAS.
- R. A. Hellerharrison, M. Morin and M. P. Czech, J. Biol. Chem., 1995, 270, 24442–24450 CrossRef CAS.
- T. O. Johnson, J. Ermolieff and M. R. Jirousek, Nat. Rev. Drug Discovery, 2002, 1, 696–709 CrossRef CAS PubMed.
- T. Horinouchi, A. Hoshi, T. Harada, T. Higa, S. Karki, K. Terada, T. Higashi, Y. Mai, P. Nepal, Y. Mazaki and S. Miwa, Br. J. Pharmacol., 2016, 173, 1018–1032 CrossRef CAS PubMed.
- H. Chen, S. J. Wertheimer, C. H. Lin, S. L. Katz, K. E. Amrein, P. Burn and M. J. Quon, J. Biol. Chem., 1997, 272, 8026–8031 CrossRef CAS PubMed.
- A. Bourdeau, N. Dube and M. L. Tremblay, Curr. Opin. Cell Biol., 2005, 17, 203–209 CrossRef CAS PubMed.
- X. Guo, D. Gu, M. Wang, Y. Huang, H. Li, Y. Dong, J. Tian, Y. Wang and Y. Yang, Food Funct., 2017, 8, 3271–3275 CAS.
- M. A. Lazar, Science, 2005, 307, 373–375 CrossRef CAS PubMed.
- R. J. Gum, L. L. Gaede, S. L. Koterski, M. Heindel, J. E. Clampit, B. A. Zinker, J. M. Trevillyan, R. G. Ulrich, M. R. Jirousek and C. M. Rondinone, Diabetes, 2003, 52, 21–28 CrossRef CAS PubMed.
- H. Ding, Y. Zhang, C. Xu, D. Hou, J. Li, Y. Zhang, W. Peng, K. Zen, C. Y. Zhang and X. Jiang, Diabetologia, 2014, 57, 2145–2154 CrossRef CAS PubMed.
- M. Combettes-Souverain and T. Issad, Diabetes Metab., 1998, 24, 477–489 CAS.
- R. Hage Hassan, A. C. Pacheco de Sousa, R. Mahfouz, I. Hainault, A. Blachnio-Zabielska, O. Bourron, F. Koskas, J. Gorski, P. Ferre, F. Foufelle and E. Hajduch, J. Biol. Chem., 2016, 291, 3019–3029 CrossRef PubMed.
- W. Ji, X. Chen, J. Lv, M. Wang, S. Ren, B. Yuan, B. Wang and L. Chen, Int. J. Endocrinol., 2014, 2014, 312452 Search PubMed.
- A. J. Stull, Z. Q. Wang, X. H. Zhang, Y. Yu, W. D. Johnson and W. T. Cefalu, Diabetes, 2012, 61, 1415–1422 CrossRef CAS PubMed.
- Z. Q. Liu, T. Liu, C. Chen, M. Y. Li, Z. Y. Wang, R. S. Chen, G. X. Wei, X. Y. Wang and D. Q. Luo, Toxicol. Appl. Pharmacol., 2015, 285, 61–70 CrossRef CAS PubMed.
- K. A. Coughlan, R. J. Valentine, B. S. Sudit, K. Allen, Y. Dagon, B. B. Kahn, N. B. Ruderman and A. K. Saha, J. Biol. Chem., 2016, 291, 5664–5675 CrossRef CAS PubMed.
- T. Zheng, X. Yang, D. Wu, S. Xing, F. Bian, W. Li, J. Chi, X. Bai, G. Wu, X. Chen, Y. Zhang and S. Jin, Br. J. Pharmacol., 2015, 172, 3284–3301 CrossRef CAS PubMed.
- S. Bergeron, M. J. Dubois, K. Bellmann, M. Schwab, N. Larochelle, J. Nalbantoglu and A. Marette, Endocrinology, 2011, 152, 4581–4588 CrossRef CAS PubMed.
- S. L. McGee, B. J. van Denderen, K. F. Howlett, J. Mollica, J. D. Schertzer, B. E. Kemp and M. Hargreaves, Diabetes, 2008, 57, 860–867 CrossRef CAS PubMed.
| This journal is © The Royal Society of Chemistry 2018 |

